

Line 9 10 11 1. Create the table that contains the following information for the last...
Fantastic news! We've Found the answer you've been seeking!
Question:


Transcribed Image Text:
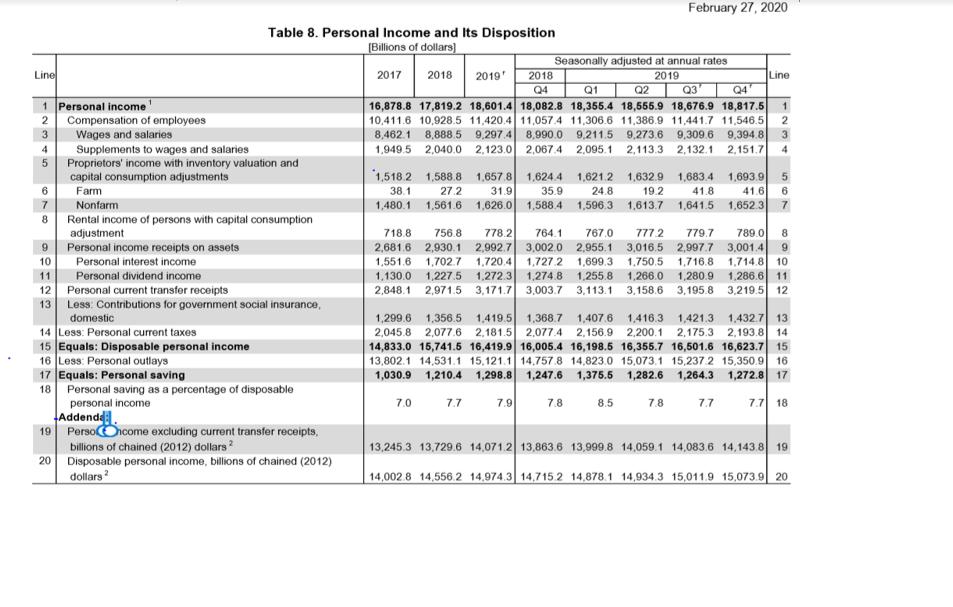
Line 9 10 11 1. Create the table that contains the following information for the last available quarter. Please note that sing the data for previous quarters will produce grade zero for this part of the project. 12 13 Omit the intermediate lines found in Tables 7 and 8 on the web site. . Gross domestic product Gross national product Net national product (you should calculate it as Gross national product minus Consumption of fixed capital) National income Personal income 1 Gross domestic product (GDP) 2 Plus: Income receipts from the rest of the world 3 Less: Income payments to the rest of the world 4 Equals: Gross national product 5 Less: Consumption of fixed capital 6 Less: Statistical discrepancy 7 Equals: National income 8 February 27, 2020 Table 7. Relation of Gross Domestic Product, Gross National Product, and National Income [Billions of dollars) Compensation of employees Wages and salaries Supplements to wages and salaries Proprietors' income with inventory valuation and capital consumption adjustments Rental income of persons with capital consumption adjustment Corporate profits with inventory valuation and capital consumption adjustments Net interest and miscellaneous payments Taxes on production and imports less subsidies 14 15 16 Business current transfer payments (net) 17 Current surplus of government enterprises Addenda: 18 Gross domestic income (GDI) 19 Average of GDP and GDI Seasonally adjusted at annual rates 2019 2017 2018 2019' 2018 Q4 Q1 Q2 Q3 Q4 19,519.4 20,580.2 21,427.1 20,897.8 21,098.8 21,340.3 21,542.5 21,726.8 957.9 1,106.2 714.6 1,127.0 1,149.0 1,177.2 1,160.4 874.4 891.2 876.2 851.4 838.3 19,762.7 20,848.1 3,121.4 3,291.4 3,463.0 -67.6 10.8 16,708.8 17,545.9 17,743.1 17,912.4 18,092.3 18,216.2 8 10,411.6 10,928.5 11,420.4 11,057.4 11,306.6 11,386.9 11,441.7 11,546.5 8,462.1 8,888.5 9,297.4 8,990.0 9,211.5 9,273.6 9,309.6 9,394.8 9 1,949.5 2,040.0 2.123.0 2,067.4 2,095.1 2,113.3 2,132.1 2.151.7 10 21,150.4 21,356.7 21,641.3 21,851.5 3,358.1 3.402.2 3,446.5 3,485.9 3.517.5 49.2 42.1 102.5 149.5 1,518.2 1.588.8 1.657.8 1,624.4 718.8 756.8 778.2 764.1 1.621.2 1,632.9 1,683.4 767.0 777.2 779.7 20,848.6 21,056.7 21,237.8 21,393.1. 20,873.2 21,077.8 21,289.0 21,467.8 0.2 0.2 0.5 0.7 19,587.0 20,569.4 19,553.2 20,574.8 -0.3 20 Statistical discrepancy as a percentage of GDP 0.1 r Revised. Revisions include changes to series affected by the incorporation of revised wage and salary estimates for the third quarter of 2019. Source: U.S. Bureau of Economic Analysis Line 1 2 3 4 5 6 7 2,005.9 2,074.6 2,085.6 2,006.9 2,082.7 2.078.0 13 608.0 672.6 644 8 668.4 657 2 644.7 636.4 641.1 14 1,303.3 1,377.4 1.419.7 1,393.9 1,399.8 1.417.4 1,425.1 1,436.4 15 145.4 153.7 170.0 159.2 165.4 163.3 184.6 166.6 16 -2.5 -6.5 -12.0 -9.9 -11.5 -12.9 -12.6 -11.0 17 1.693.9 11 789.0 12 18 19 20 February 27, 2020 Line 1 Personal income 2345 5 678 90223 10 Personal interest income Personal dividend income 11 Compensation of employees Wages and salaries Supplements to wages and salaries Proprietors' income with inventory valuation and capital consumption adjustments Farm Nonfarm Rental income of persons with capital consumption adjustment Personal income receipts on assets 12 Personal current transfer receipts Table 8. Personal Income and Its Disposition [Billions of dollars] 2017 2018 2019' 20 Less: Contributions for government social insurance, domestic 14 Less: Personal current taxes 15 Equals: Disposable personal income 16 Less: Personal outlays 17 Equals: Personal saving 18 Personal saving as a percentage of disposable personal income Addende 19 Personcome excluding current transfer receipts, billions of chained (2012) dollars Disposable personal income, billions of chained (2012) dollars 1,518.2 1.588.8 1,657.8 38.1 27.2 31.9 1,480.1 1.561.6 1,626.0 2018 Q4 Q1 Q2 Q4 Q3 16,878.8 17,819.2 18,601.4 18,082.8 18,355.4 18,555.9 18,676.9 18,817.5 10,411.6 10,928.5 11,420.4 11,057.4 11,306.6 11,386.9 11,441.7 11,546.5 8,462 1 8,888.5 9,297.4 8,990.0 9,211.5 9,273.6 9,309.6 9,394.8 1,949.5 2,067 4 2,095.1 2,113.3 2,132.1 2,151.7 2,040.0 2,123.0 7.0 Seasonally adjusted at annual rates 2019 7.7 7.9 February 27, 2020 718.8 756.8 778.2 764.1 767.0 777.2 779.7 789.0 8 2,681.6 2,930.1 2,992.7 3,002,0 2,955.1 3,016.5 2,997.7 3,001.4 9 1,551.6 1.702.7 1.720.4 1.727.2 1,699.3 1.750.5 1.716.8 1,714.8 10 1,130.0 1,227.5 1.272.3 1,274.8 1,255.8 1,266.0 1,280.9 1,286.6 11 2,848.1 2,971.5 3,171.7 3,003.7 3,113.1 3.158.6 3,195.8 3,219.5 12 1,624.4 1.621.2 1,632.9 1.683.4 1,693.9 5 35.9 24.8 19.2 41.8 1,588.4 1,596.3 1.613.7 1,641.5 1.652.3 7 41.6 1,299.6 1,356.5 1.419.5 1,368.7 1.407.6 1.416.3 1,421.3 1.432.7 13 2,045.8 2,077.6 2,181.5 2,077.4 2,156.9 2,200.1 2,175.3 2,193.8 14 14,833.0 15,741.5 16,419.9 16,005.4 16,198.5 16,355.7 16,501.6 16,623.7 15 13,802.1 14.531.1 15.121.1 14,757.8 14,823.0 15.073.1 15,237.2 15,350.9 16 1,030.9 1,210.4 1,298.8 1,247.6 1,375.5 1,282.6 1,264.3 1,272.8 17 7.7 18 7.8 8.5 Line 7.8 1234 7.7 567 13,245.3 13,729.6 14,071.2 13,863.6 13.999.8 14,059.1 14,083.6 14,143.8 19 14,002.8 14.556.2 14.974.3 14.715.2 14.878.1 14,934.3 15,011.9 15.073.9 20 2. What is the difference between gross domestic product (GDP) and gross national product (GNP)? What is the difference in what GDP measures compared to GNP? 3. Based on the table, what calculations must you make to determine GNP from GDP? 4. What is national income (NI)? What does NI measure? 5. Which was higher in this year, GNP or NI? By how much? 6. What calculations must you make to determine NI from GNP? 7. NI is composed of a number of categories. What category makes up the largest portion of NI? 8. Please analyze and discuss the significance of the data that you received for this Data exercise. Reflect on what you have learned from this exercise. Line 9 10 11 1. Create the table that contains the following information for the last available quarter. Please note that sing the data for previous quarters will produce grade zero for this part of the project. 12 13 Omit the intermediate lines found in Tables 7 and 8 on the web site. . Gross domestic product Gross national product Net national product (you should calculate it as Gross national product minus Consumption of fixed capital) National income Personal income 1 Gross domestic product (GDP) 2 Plus: Income receipts from the rest of the world 3 Less: Income payments to the rest of the world 4 Equals: Gross national product 5 Less: Consumption of fixed capital 6 Less: Statistical discrepancy 7 Equals: National income 8 February 27, 2020 Table 7. Relation of Gross Domestic Product, Gross National Product, and National Income [Billions of dollars) Compensation of employees Wages and salaries Supplements to wages and salaries Proprietors' income with inventory valuation and capital consumption adjustments Rental income of persons with capital consumption adjustment Corporate profits with inventory valuation and capital consumption adjustments Net interest and miscellaneous payments Taxes on production and imports less subsidies 14 15 16 Business current transfer payments (net) 17 Current surplus of government enterprises Addenda: 18 Gross domestic income (GDI) 19 Average of GDP and GDI Seasonally adjusted at annual rates 2019 2017 2018 2019' 2018 Q4 Q1 Q2 Q3 Q4 19,519.4 20,580.2 21,427.1 20,897.8 21,098.8 21,340.3 21,542.5 21,726.8 957.9 1,106.2 714.6 1,127.0 1,149.0 1,177.2 1,160.4 874.4 891.2 876.2 851.4 838.3 19,762.7 20,848.1 3,121.4 3,291.4 3,463.0 -67.6 10.8 16,708.8 17,545.9 17,743.1 17,912.4 18,092.3 18,216.2 8 10,411.6 10,928.5 11,420.4 11,057.4 11,306.6 11,386.9 11,441.7 11,546.5 8,462.1 8,888.5 9,297.4 8,990.0 9,211.5 9,273.6 9,309.6 9,394.8 9 1,949.5 2,040.0 2.123.0 2,067.4 2,095.1 2,113.3 2,132.1 2.151.7 10 21,150.4 21,356.7 21,641.3 21,851.5 3,358.1 3.402.2 3,446.5 3,485.9 3.517.5 49.2 42.1 102.5 149.5 1,518.2 1.588.8 1.657.8 1,624.4 718.8 756.8 778.2 764.1 1.621.2 1,632.9 1,683.4 767.0 777.2 779.7 20,848.6 21,056.7 21,237.8 21,393.1. 20,873.2 21,077.8 21,289.0 21,467.8 0.2 0.2 0.5 0.7 19,587.0 20,569.4 19,553.2 20,574.8 -0.3 20 Statistical discrepancy as a percentage of GDP 0.1 r Revised. Revisions include changes to series affected by the incorporation of revised wage and salary estimates for the third quarter of 2019. Source: U.S. Bureau of Economic Analysis Line 1 2 3 4 5 6 7 2,005.9 2,074.6 2,085.6 2,006.9 2,082.7 2.078.0 13 608.0 672.6 644 8 668.4 657 2 644.7 636.4 641.1 14 1,303.3 1,377.4 1.419.7 1,393.9 1,399.8 1.417.4 1,425.1 1,436.4 15 145.4 153.7 170.0 159.2 165.4 163.3 184.6 166.6 16 -2.5 -6.5 -12.0 -9.9 -11.5 -12.9 -12.6 -11.0 17 1.693.9 11 789.0 12 18 19 20 February 27, 2020 Line 1 Personal income 2345 5 678 90223 10 Personal interest income Personal dividend income 11 Compensation of employees Wages and salaries Supplements to wages and salaries Proprietors' income with inventory valuation and capital consumption adjustments Farm Nonfarm Rental income of persons with capital consumption adjustment Personal income receipts on assets 12 Personal current transfer receipts Table 8. Personal Income and Its Disposition [Billions of dollars] 2017 2018 2019' 20 Less: Contributions for government social insurance, domestic 14 Less: Personal current taxes 15 Equals: Disposable personal income 16 Less: Personal outlays 17 Equals: Personal saving 18 Personal saving as a percentage of disposable personal income Addende 19 Personcome excluding current transfer receipts, billions of chained (2012) dollars Disposable personal income, billions of chained (2012) dollars 1,518.2 1.588.8 1,657.8 38.1 27.2 31.9 1,480.1 1.561.6 1,626.0 2018 Q4 Q1 Q2 Q4 Q3 16,878.8 17,819.2 18,601.4 18,082.8 18,355.4 18,555.9 18,676.9 18,817.5 10,411.6 10,928.5 11,420.4 11,057.4 11,306.6 11,386.9 11,441.7 11,546.5 8,462 1 8,888.5 9,297.4 8,990.0 9,211.5 9,273.6 9,309.6 9,394.8 1,949.5 2,067 4 2,095.1 2,113.3 2,132.1 2,151.7 2,040.0 2,123.0 7.0 Seasonally adjusted at annual rates 2019 7.7 7.9 February 27, 2020 718.8 756.8 778.2 764.1 767.0 777.2 779.7 789.0 8 2,681.6 2,930.1 2,992.7 3,002,0 2,955.1 3,016.5 2,997.7 3,001.4 9 1,551.6 1.702.7 1.720.4 1.727.2 1,699.3 1.750.5 1.716.8 1,714.8 10 1,130.0 1,227.5 1.272.3 1,274.8 1,255.8 1,266.0 1,280.9 1,286.6 11 2,848.1 2,971.5 3,171.7 3,003.7 3,113.1 3.158.6 3,195.8 3,219.5 12 1,624.4 1.621.2 1,632.9 1.683.4 1,693.9 5 35.9 24.8 19.2 41.8 1,588.4 1,596.3 1.613.7 1,641.5 1.652.3 7 41.6 1,299.6 1,356.5 1.419.5 1,368.7 1.407.6 1.416.3 1,421.3 1.432.7 13 2,045.8 2,077.6 2,181.5 2,077.4 2,156.9 2,200.1 2,175.3 2,193.8 14 14,833.0 15,741.5 16,419.9 16,005.4 16,198.5 16,355.7 16,501.6 16,623.7 15 13,802.1 14.531.1 15.121.1 14,757.8 14,823.0 15.073.1 15,237.2 15,350.9 16 1,030.9 1,210.4 1,298.8 1,247.6 1,375.5 1,282.6 1,264.3 1,272.8 17 7.7 18 7.8 8.5 Line 7.8 1234 7.7 567 13,245.3 13,729.6 14,071.2 13,863.6 13.999.8 14,059.1 14,083.6 14,143.8 19 14,002.8 14.556.2 14.974.3 14.715.2 14.878.1 14,934.3 15,011.9 15.073.9 20 2. What is the difference between gross domestic product (GDP) and gross national product (GNP)? What is the difference in what GDP measures compared to GNP? 3. Based on the table, what calculations must you make to determine GNP from GDP? 4. What is national income (NI)? What does NI measure? 5. Which was higher in this year, GNP or NI? By how much? 6. What calculations must you make to determine NI from GNP? 7. NI is composed of a number of categories. What category makes up the largest portion of NI? 8. Please analyze and discuss the significance of the data that you received for this Data exercise. Reflect on what you have learned from this exercise.
Expert Answer:
Answer rating: 100% (QA)
To create the table for the last available quarter we need to extract the relevant information from the provided data Here is the table containing the ... View the full answer

Related Book For 

Income Tax Fundamentals 2013
ISBN: 9781285586618
31st Edition
Authors: Gerald E. Whittenburg, Martha Altus Buller, Steven L Gill
Posted Date:
Students also viewed these economics questions
-
The following additional information is available for the Dr. Ivan and Irene Incisor family from Chapters 1-5. Ivan's grandfather died and left a portfolio of municipal bonds. In 2012, they pay Ivan...
-
Managing Scope Changes Case Study Scope changes on a project can occur regardless of how well the project is planned or executed. Scope changes can be the result of something that was omitted during...
-
If you uncover critically important information (the sort that could make or break your company) that is from a credible source and appears to be unbiased, well documented, current, and complete but...
-
Which of the following materials would not be maximally reabsorbed from the filtrate? a. Water b. Glucose c. Sodium ions d. Urea e. Amino acids
-
Your firm is considering the launch of a new product, the XJ5. The upfront development cost is $12 million, and you expect to earn a cash flow of $3.1 million per year for the next five years. Plot...
-
Why is construct validity often so difficult to establish?
-
The condensed income statement for the Peri and Paul partnership for 2014 is as follows. A cost behavior analysis indicates that 75% of the cost of goods sold are variable, 42% of the selling...
-
2021 2022 1. Units of work performed 80 2. Selling price $ 47,000 $ 45,200 Revenue effect of growth 3. Software implementation labour-hours 28,500 30,000 Cost effect of growth Haller Corporation is a...
-
The return on equity (ROE) of Child SA is 14 per cent and it has a payout ratio of 0.5. Current book value per share is 50 and the book value will grow as the firm reinvests earnings. Assume that the...
-
During the year, Triumph Incorporated has the following inventory transactions. Number of Date January 1 March 4 June 9 November 11 Transaction Beginning inventory Purchase Purchase Purchase Units...
-
What is a common feature found in all viruses? a. An envelope b. DNA c. Nucleic acid surrounded by a protein capsid d. All of the above are common features.
-
The purpose of site-directed mutagenesis and CRISPR-Cas technology is to a. determine if a protein binds to a DNA segment. b. determine the sequence of a segment of DNA. c. alter the sequence of a...
-
Certain drugs to combat human viral diseases affect spike glycoproteins in the viral envelope. Discuss how you think such drugs may prevent viral infection.
-
A mutation changes a codon that specifies tyrosine into a stop codon. This type of mutation is a a. missense mutation. b. nonsense mutation. c. frameshift mutation. d. neutral mutation.
-
A release factor is referred to as a molecular mimic because its structure is similar to that of a. a ribosome. b. an mRNA. c. a tRNA. d. an elongation factor.
-
CLC-Tyronco COSO Case Study Template The case study used this assignment is being used with permission from Internal Auditing Foundation (IIA). Directions: After reviewing "The Tyronco Foundation...
-
Evaluate the integral, if it exists. Jo y(y + 1) dy
-
Your supervisor has asked you to research the following situation concerning Owen and Lisa Cordoncillo. Owen and Lisa are brother and sister. In May 2012, Owen and Lisa exchange business pickup...
-
Brian and Kim have a 12-year-old child, Stan. For 2012, Brian and Kim have taxable income of $52,000, and Stan has nonqualifying dividend income of $4,500 and investment expenses of $250. No election...
-
Van makes an investment in a partnership in 2012. Van's capital contributions to the partnership consisted of $30,000 cash and a building with an adjusted basis of$70,000, subject to a nonrecourse...
-
What are some of the ways in which the arts of various cultures differ from each other?
-
If the majority in a community finds an artistic representation of their religion, race, or culture offensive, should it be censored? The statue of President Theodore Roosevelt flanked by an African...
-
Compare the ways that art expresses cultural themes using the examples of manga, anime, and cockfighting.

Study smarter with the SolutionInn App