

Liz Kraft, CFO at Dynatronics, Inc. was concerned about the company's future investment and financing programs....
Fantastic news! We've Found the answer you've been seeking!
Question:
Transcribed Image Text:
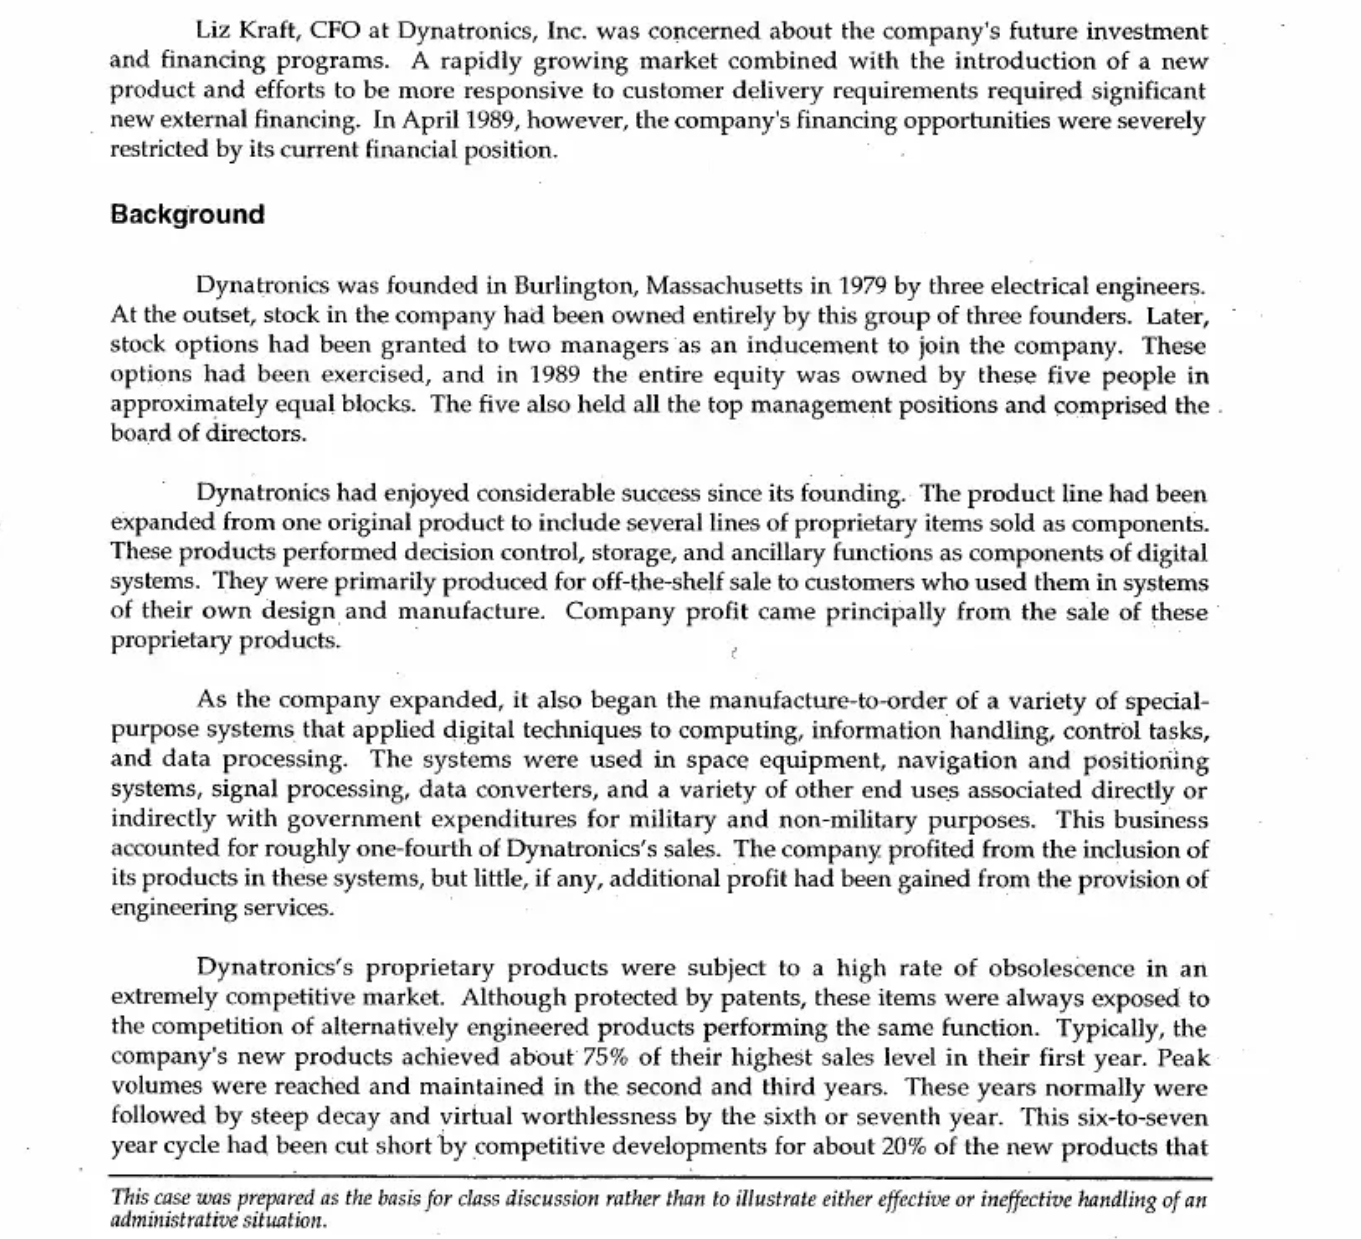
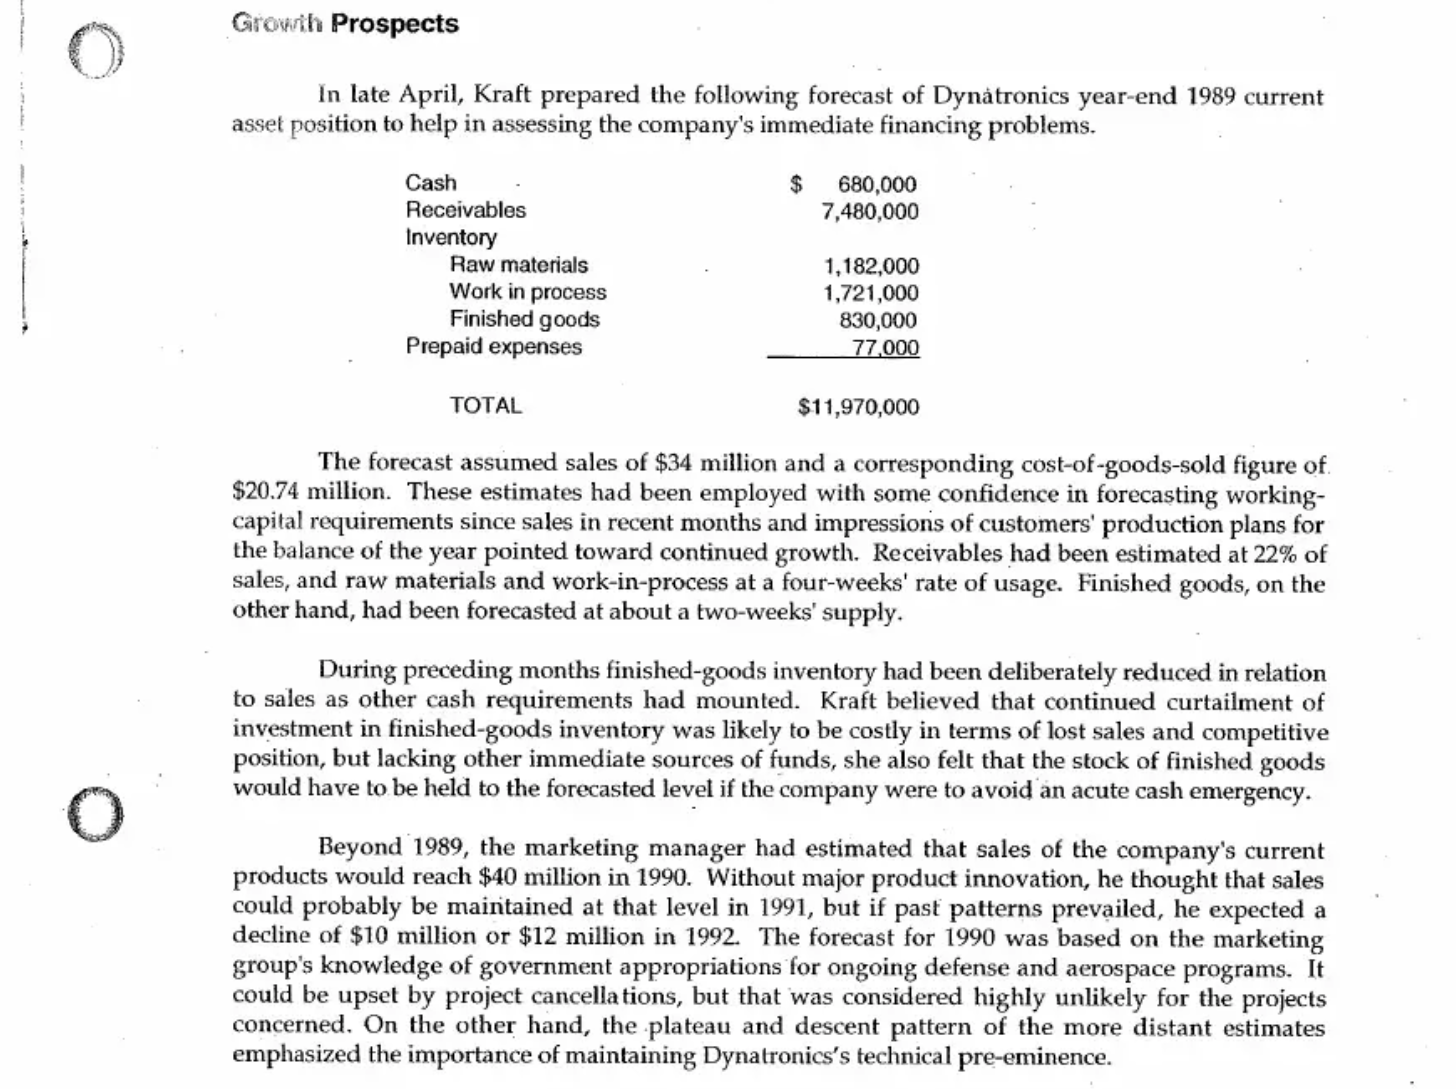
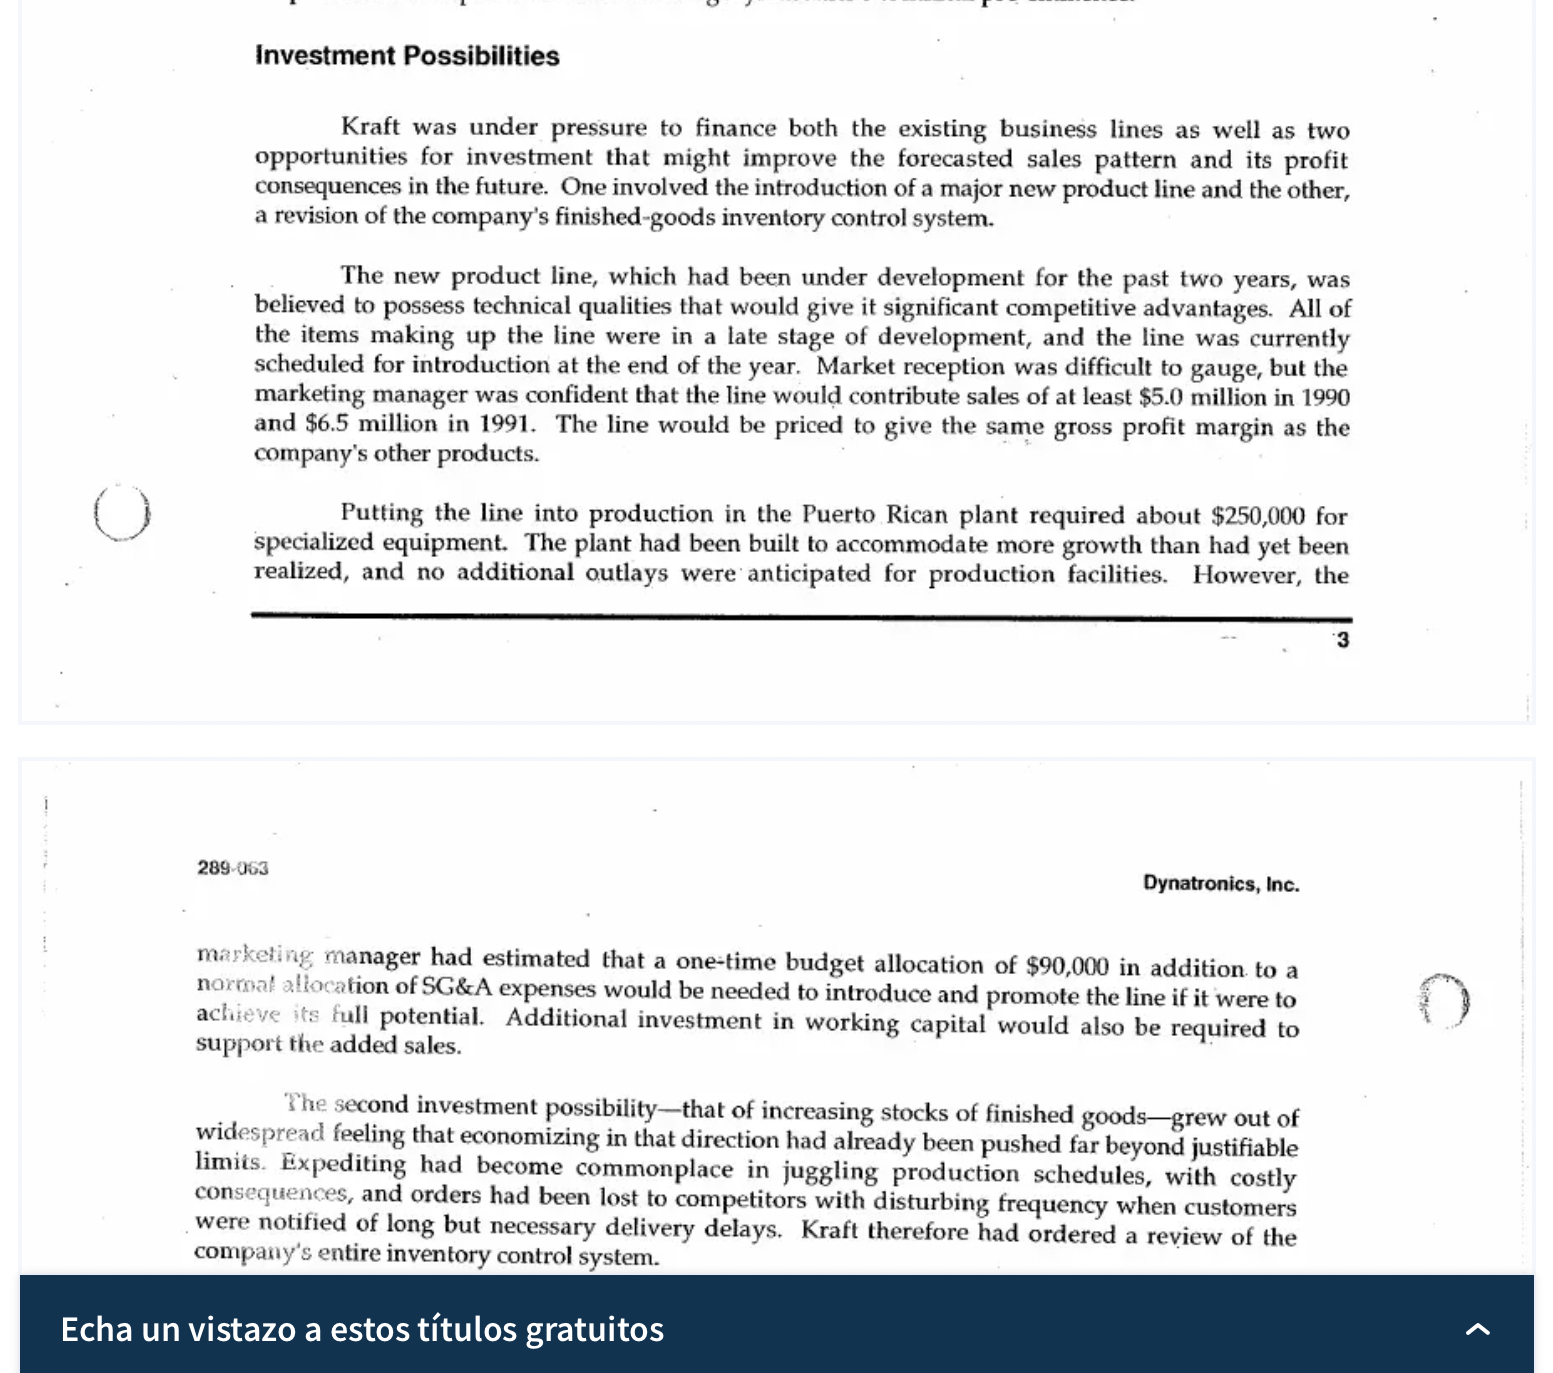
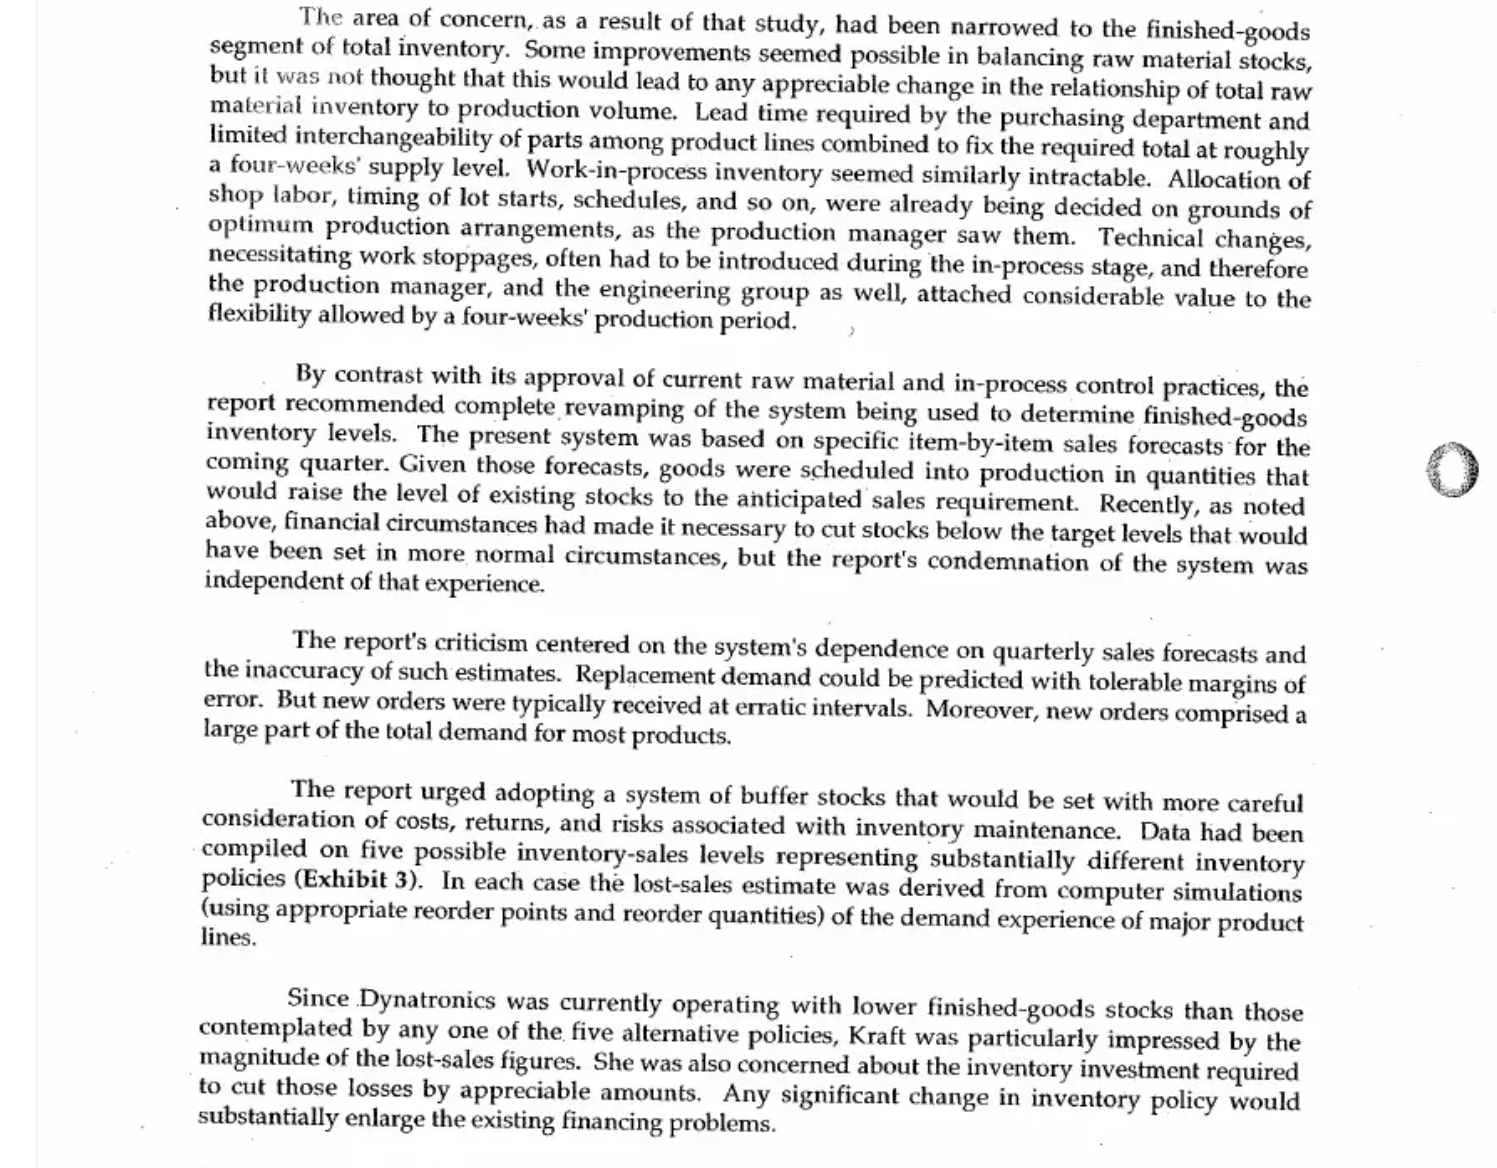
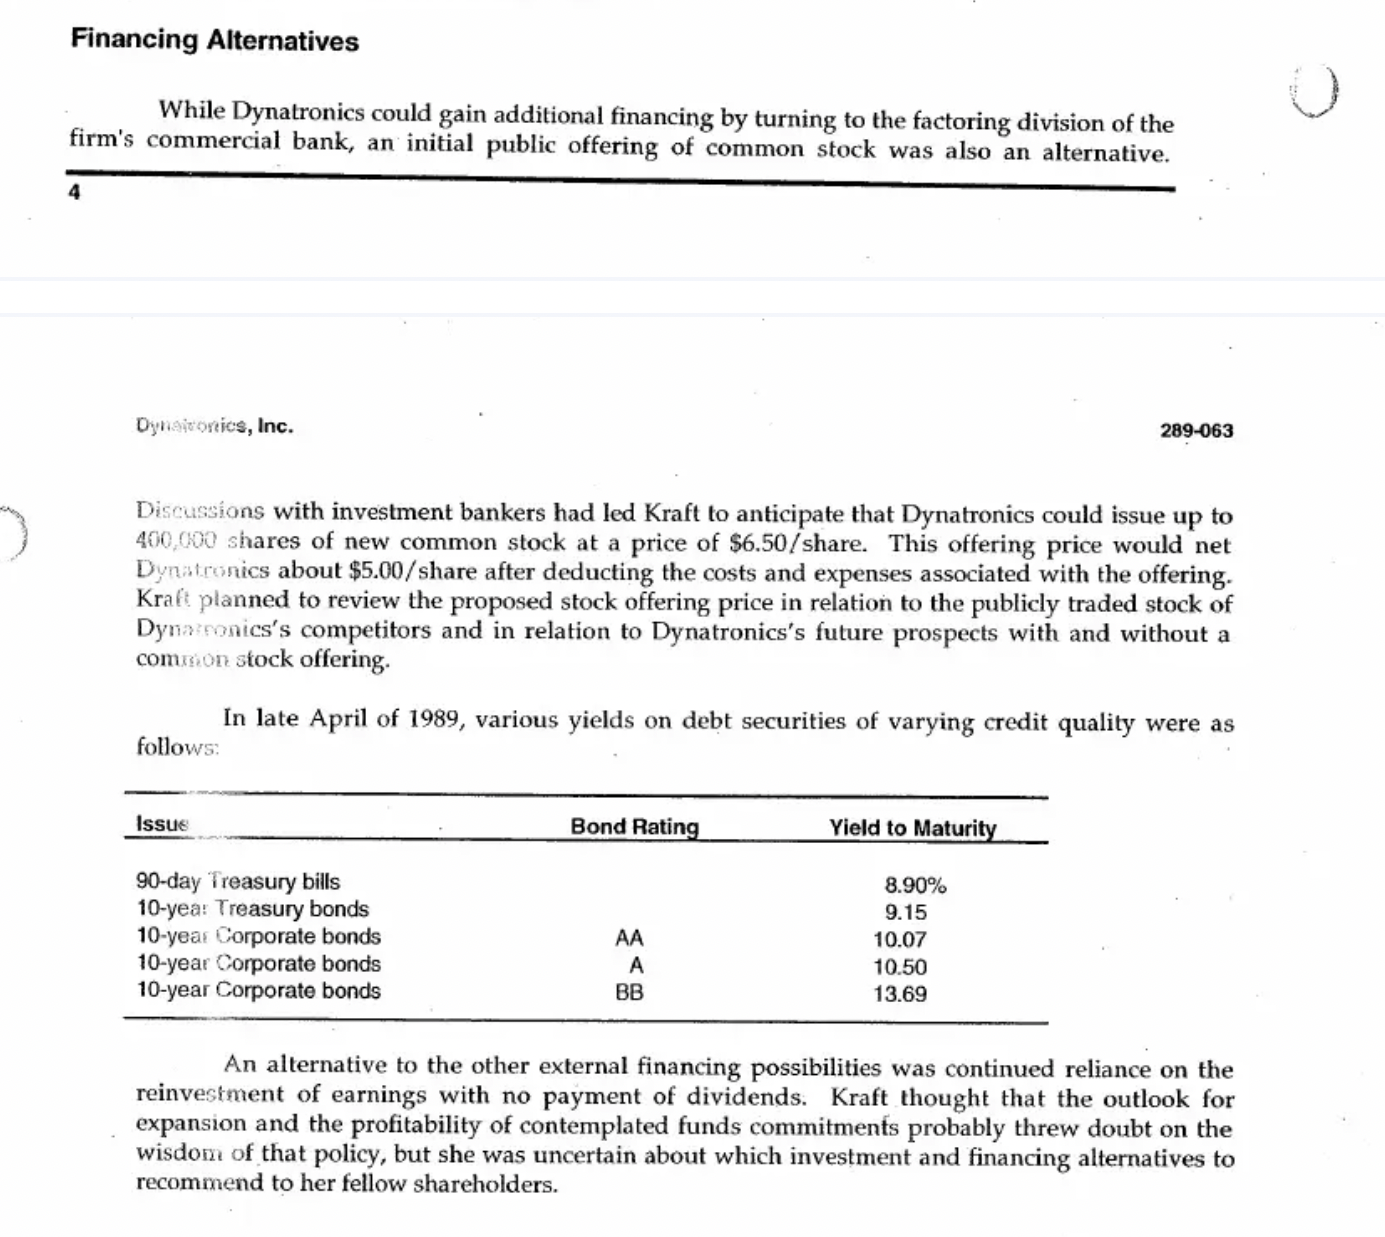
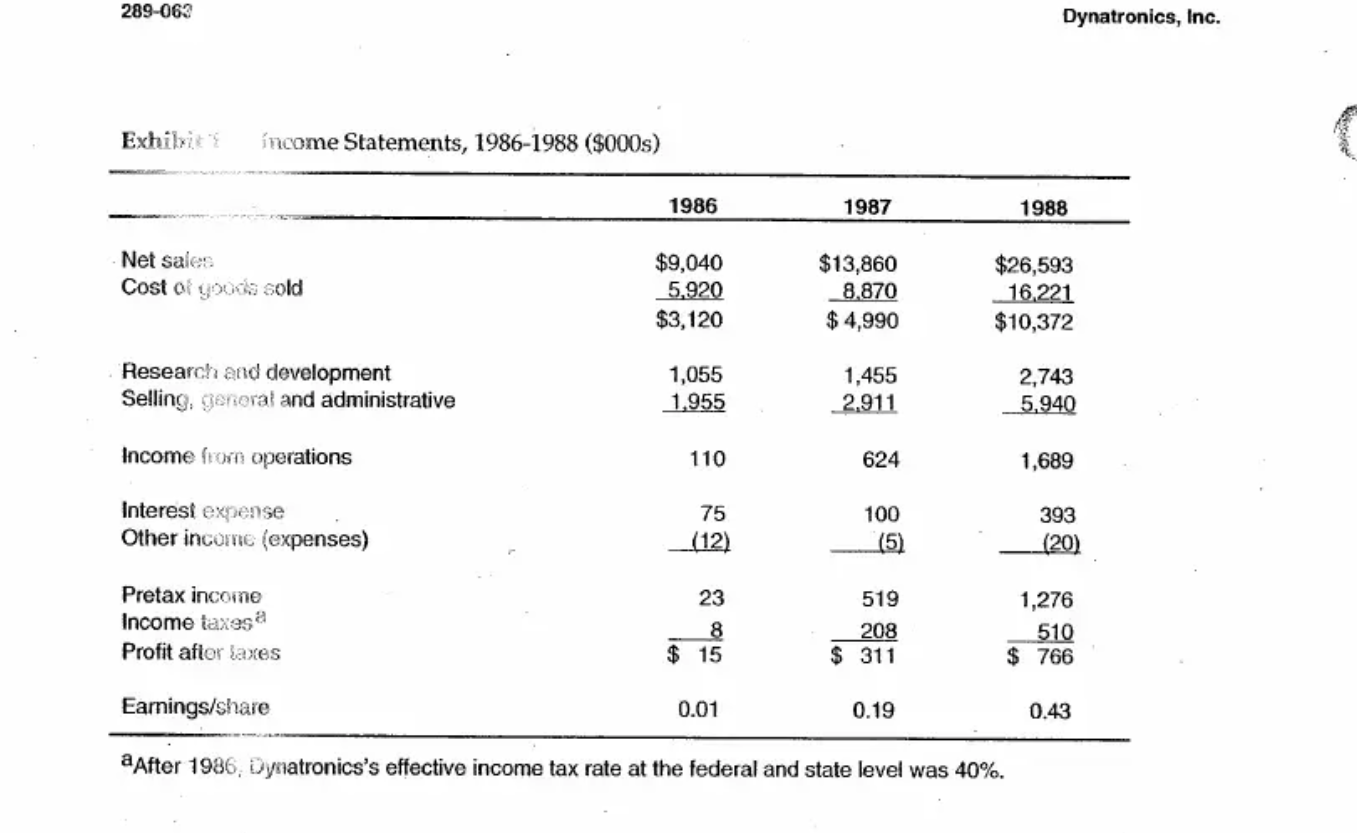
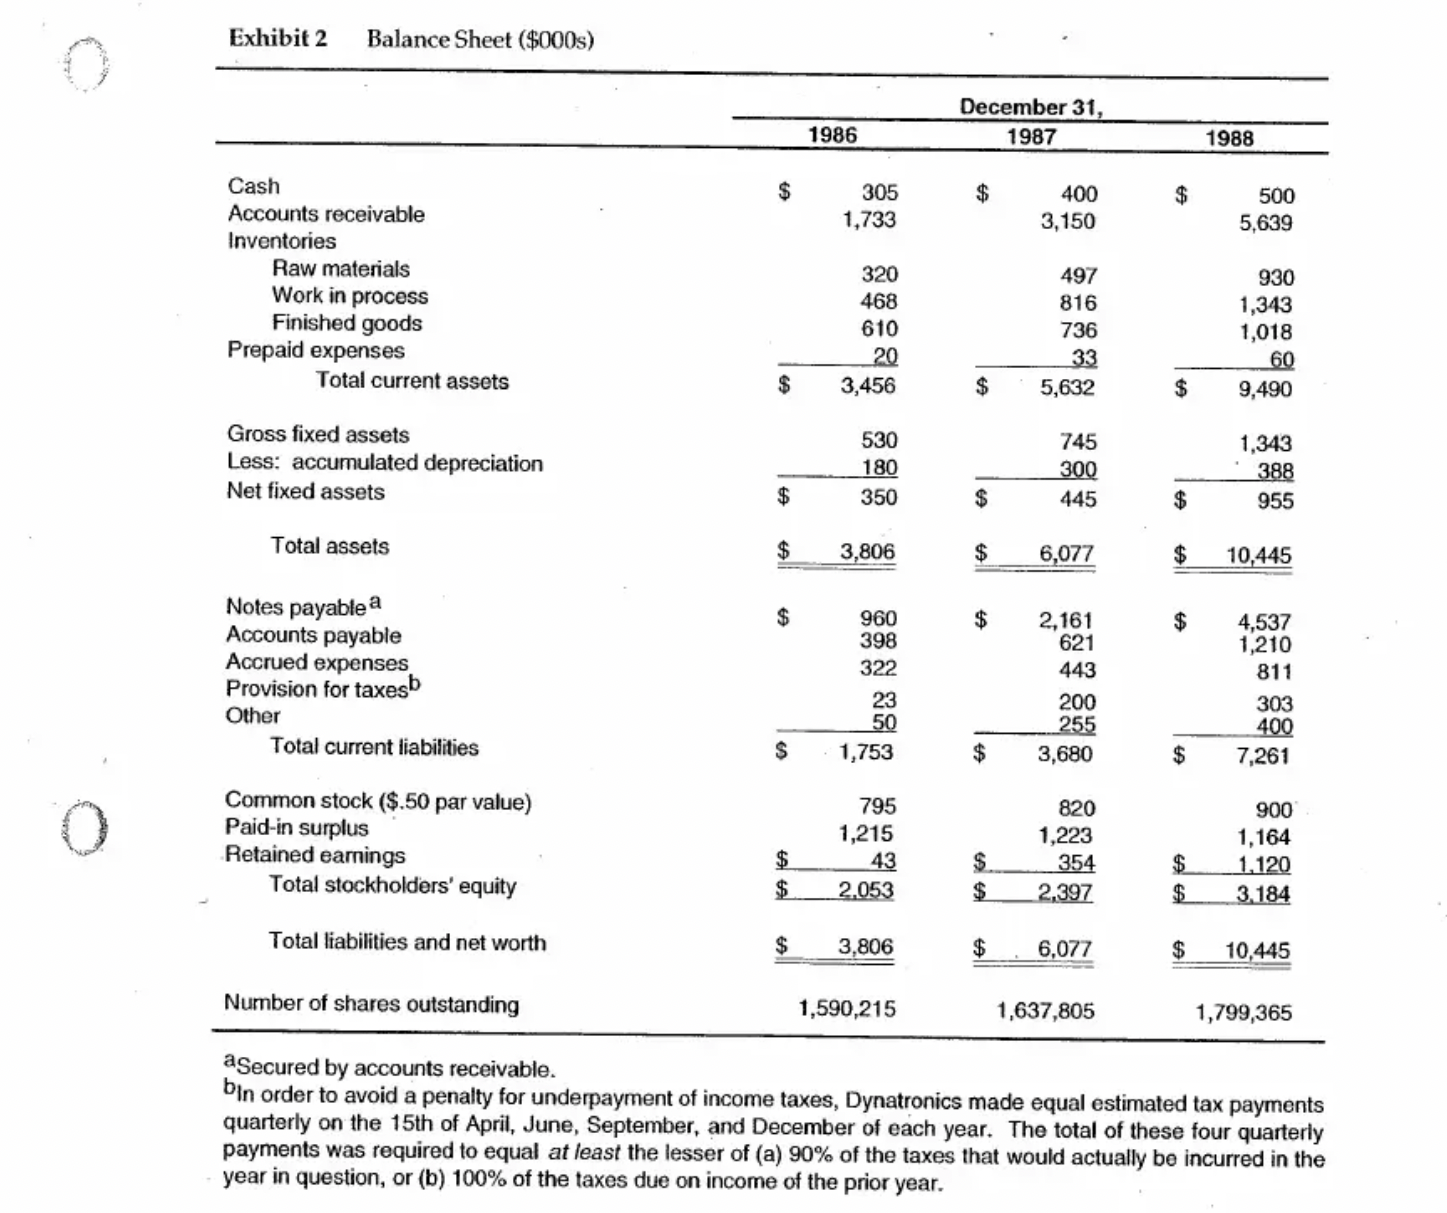
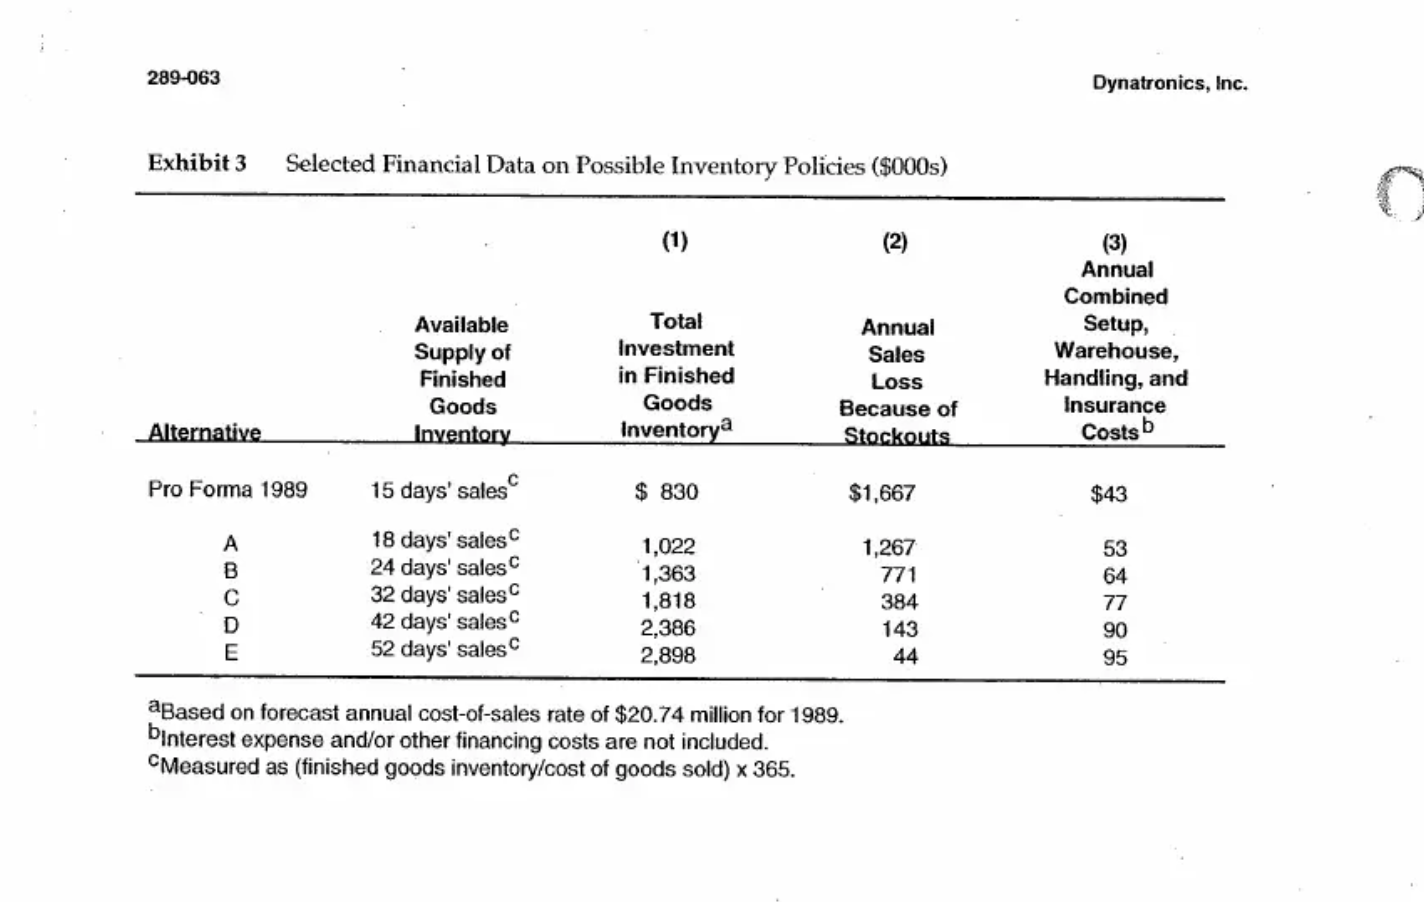
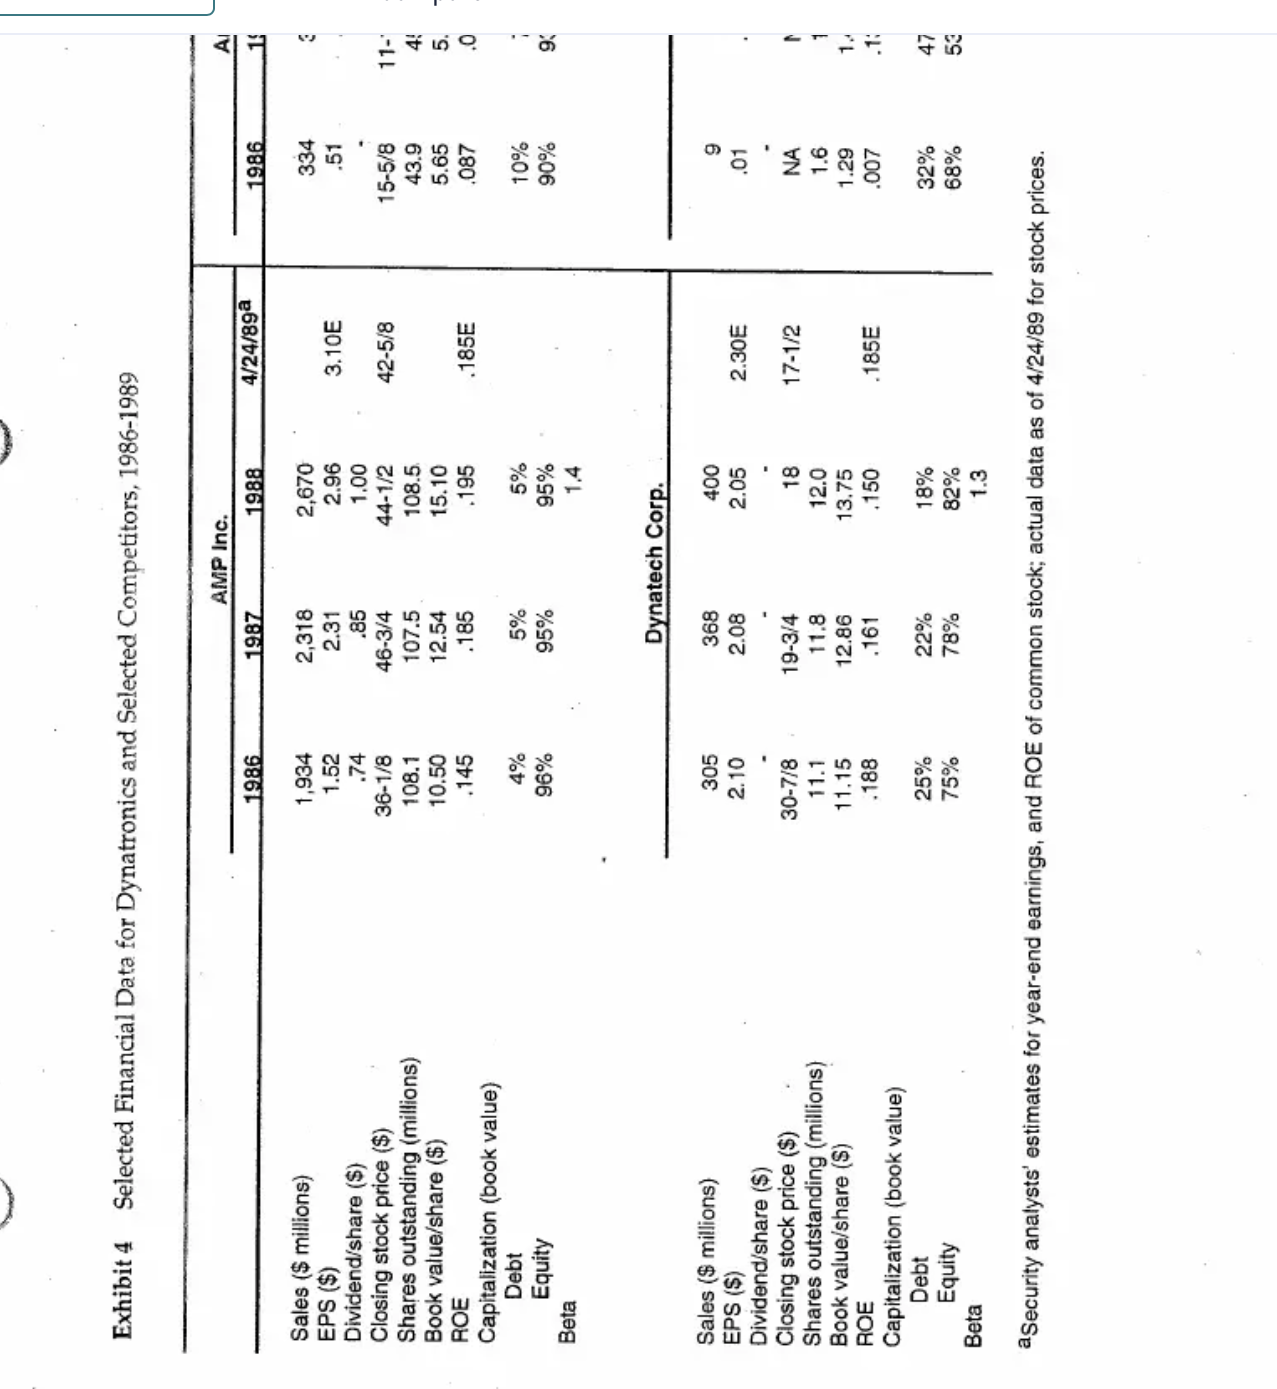
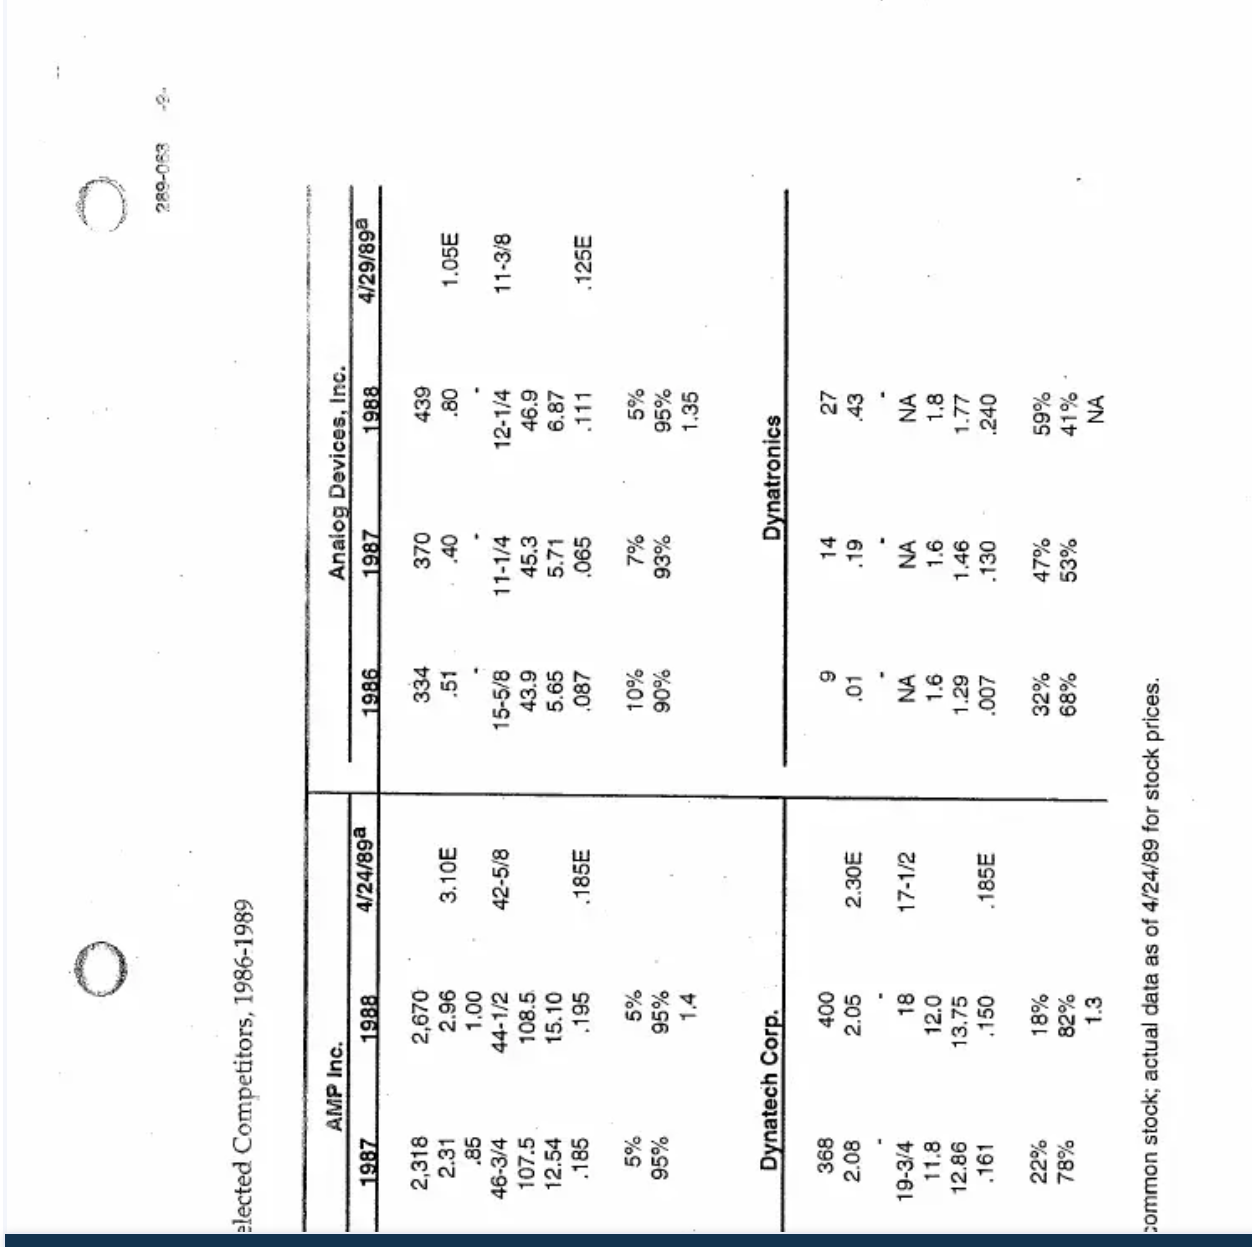
Liz Kraft, CFO at Dynatronics, Inc. was concerned about the company's future investment and financing programs. A rapidly growing market combined with the introduction of a new product and efforts to be more responsive to customer delivery requirements required significant new external financing. In April 1989, however, the company's financing opportunities were severely restricted by its current financial position. Background Dynatronics was founded in Burlington, Massachusetts in 1979 by three electrical engineers. At the outset, stock in the company had been owned entirely by this group of three founders. Later, stock options had been granted to two managers as an inducement to join the company. These options had been exercised, and in 1989 the entire equity was owned by these five people in approximately equal blocks. The five also held all the top management positions and comprised the board of directors. Dynatronics had enjoyed considerable success since its founding. The product line had been expanded from one original product to include several lines of proprietary items sold as components. These products performed decision control, storage, and ancillary functions as components of digital systems. They were primarily produced for off-the-shelf sale to customers who used them in systems of their own design and manufacture. Company profit came principally from the sale of these proprietary products. As the company expanded, it also began the manufacture-to-order of a variety of special- purpose systems that applied digital techniques to computing, information handling, control tasks, and data processing. The systems were used in space equipment, navigation and positioning systems, signal processing, data converters, and a variety of other end uses associated directly or indirectly with government expenditures for military and non-military purposes. This business accounted for roughly one-fourth of Dynatronics's sales. The company profited from the inclusion of its products in these systems, but little, if any, additional profit had been gained from the provision of engineering services. Dynatronics's proprietary products were subject to a high rate of obsolescence in an extremely competitive market. Although protected by patents, these items were always exposed to the competition of alternatively engineered products performing the same function. Typically, the company's new products achieved about 75% of their highest sales level in their first year. Peak volumes were reached and maintained in the second and third years. These years normally were followed by steep decay and virtual worthlessness by the sixth or seventh year. This six-to-seven year cycle had been cut short by competitive developments for about 20% of the new products that This case was prepared as the basis for class discussion rather than to illustrate either effective or ineffective handling of an administrative situation. the company had introduced during the past ten years, and on those occasions Dynatronics had been forced to absorb substantial inventory write-offs. The danger of being leapfrogged technically was met by aggressive spending expenditures on research and development to improve existing product lines and add new ones. Company officials had been successful in recruiting and holding a strong research group, and this group, supported by ample budgetary allocations, had created enviable market respect for the quality of the company's products. The five owner-managers were determined to maintain that reputation. Over the years continuing expansion had led to a number of changes in Dynatronics's internal organization. Sales outlets had been established in Silicon Valley, and late in 1987, a small plant had been constructed there for the design and production of systems for the aerospace industry. Earlier, production of proprietary products had been shifted from Burlington to a wholly owned subsidiary in Puerto Rico, largely because of the availability in that area of a low-wage labor force. Production operations at the subsidiary consisted almost entirely of assembling and packaging modules and allied components. Other managerial offices remained at the original site in Burlington. In the period after 1985, rapidly widening product acceptance had almost tripled the company's sales (Exhibit 1), and its investment in current assets had expanded accordingly (Exhibit 2). Short-term loans, secured by the pledge of receivables, had been obtained from Dynatronics's local bank to support this growing requirement. The bank had been willing to lend 85% of the face amount of the receivables, and this banking arrangement had proved generally satisfactory until early 1989. At that time an officer of the bank had made it clear that Dynatronics had reached the limit of the credit line that the bank was willing to extend in the absence of some improvement in the company's capital structure. New equity would qualify Dynatronics for a larger loan, but the loan limit would no longer be increased as accounts receivable grew if total liabilities/net worth exceeded 2.0. As sales had continued to increase in 1989, the company continued to produce earnings in approximately the same proportion to sales as in 1988, but the retention of these earnings had failed to alter the bank's stand on additional financing. When approached in April, the loan officer had been unwilling to extend additional credit. He did offer to introduce Kraft to the factoring division of the bank. This division serviced higher-risk customers with accounts-receivable financing. It generally set no limit on liabilities-to-net worth ratios, and would lend up to 90% of the outstanding accounts-receivable balances. This division of the bank would monitor Dynatronics's credit extension and accounts receivable collection activities much more closely than the bank's commercial loan department. Because of greater risk and the extra costs involved in closer monitoring of the loan, the interest rate charged by the bank would rise from prime plus 1/2% to prime plus 4% on the total loans outstanding to Dynatronics. The prime rate was currently 111/2%. Growth Prospects In late April, Kraft prepared the following forecast of Dynatronics year-end 1989 current asset position to help in assessing the company's immediate financing problems. Cash Receivables Inventory Raw materials Work in process Finished goods Prepaid expenses TOTAL $ 680,000 7,480,000 1,182,000 1,721,000 830,000 77,000 $11,970,000 The forecast assumed sales of $34 million and a corresponding cost-of-goods-sold figure of $20.74 million. These estimates had been employed with some confidence in forecasting working- capital requirements since sales in recent months and impressions of customers' production plans for the balance of the year pointed toward continued growth. Receivables had been estimated at 22% of sales, and raw materials and work-in-process at a four-weeks' rate of usage. Finished goods, on the other hand, had been forecasted at about a two-weeks' supply. During preceding months finished-goods inventory had been deliberately reduced in relation to sales as other cash requirements had mounted. Kraft believed that continued curtailment of investment in finished-goods inventory was likely to be costly in terms of lost sales and competitive position, but lacking other immediate sources of funds, she also felt that the stock of finished goods would have to be held to the forecasted level if the company were to avoid an acute cash emergency. Beyond 1989, the marketing manager had estimated that sales of the company's current products would reach $40 million in 1990. Without major product innovation, he thought that sales could probably be maintained at that level in 1991, but if past patterns prevailed, he expected a decline of $10 million or $12 million in 1992. The forecast for 1990 was based on the marketing group's knowledge of government appropriations for ongoing defense and aerospace programs. It could be upset by project cancellations, but that was considered highly unlikely for the projects concerned. On the other hand, the plateau and descent pattern of the more distant estimates emphasized the importance of maintaining Dynatronics's technical pre-eminence. Investment Possibilities Kraft was under pressure to finance both the existing business lines as well as two opportunities for investment that might improve the forecasted sales pattern and its profit consequences in the future. One involved the introduction of a major new product line and the other, a revision of the company's finished-goods inventory control system. The new product line, which had been under development for the past two years, was believed to possess technical qualities that would give it significant competitive advantages. All of the items making up the line were in a late stage of development, and the line was currently scheduled for introduction at the end of the year. Market reception was difficult to gauge, but the marketing manager was confident that the line would contribute sales of at least $5.0 million in 1990 and $6.5 million in 1991. The line would be priced to give the same gross profit margin as the company's other products. Putting the line into production in the Puerto Rican plant required about $250,000 for specialized equipment. The plant had been built to accommodate more growth than had yet been realized, and no additional outlays were anticipated for production facilities. However, the 289-063 Dynatronics, Inc. marketing manager had estimated that a one-time budget allocation of $90,000 in addition to a normal allocation of SG&A expenses would be needed to introduce and promote the line if it were to achieve its full potential. Additional investment in working capital would also be required to support the added sales. The second investment possibility-that of increasing stocks of finished goods-grew out of widespread feeling that economizing in that direction had already been pushed far beyond justifiable limits. Expediting had become commonplace in juggling production schedules, with costly consequences, and orders had been lost to competitors with disturbing frequency when customers were notified of long but necessary delivery delays. Kraft therefore had ordered a review of the company's entire inventory control system. Echa un vistazo a estos ttulos gratuitos 3 The area of concern, as a result of that study, had been narrowed to the finished-goods segment of total inventory. Some improvements seemed possible in balancing raw material stocks, but it was not thought that this would lead to any appreciable change in the relationship of total raw material inventory to production volume. Lead time required by the purchasing department and limited interchangeability of parts among product lines combined to fix the required total at roughly a four-weeks' supply level. Work-in-process inventory seemed similarly intractable. Allocation of shop labor, timing of lot starts, schedules, and so on, were already being decided on grounds of optimum production arrangements, as the production manager saw them. Technical changes, necessitating work stoppages, often had to be introduced during the in-process stage, and therefore the production manager, and the engineering group as well, attached considerable value to the flexibility allowed by a four-weeks' production period. By contrast with its approval of current raw material and in-process control practices, the report recommended complete revamping of the system being used to determine finished-goods inventory levels. The present system was based on specific item-by-item sales forecasts for the coming quarter. Given those forecasts, goods were scheduled into production in quantities that would raise the level of existing stocks to the anticipated sales requirement. Recently, as noted above, financial circumstances had made it necessary to cut stocks below the target levels that would have been set in more normal circumstances, but the report's condemnation of the system was independent of that experience. The report's criticism centered on the system's dependence on quarterly sales forecasts and the inaccuracy of such estimates. Replacement demand could be predicted with tolerable margins of error. But new orders were typically received at erratic intervals. Moreover, new orders comprised a large part of the total demand for most products. The report urged adopting a system of buffer stocks that would be set with more careful consideration of costs, returns, and risks associated with inventory maintenance. Data had been compiled on five possible inventory-sales levels representing substantially different inventory policies (Exhibit 3). In each case the lost-sales estimate was derived from computer simulations (using appropriate reorder points and reorder quantities) of the demand experience of major product lines. Since Dynatronics was currently operating with lower finished-goods stocks than those contemplated by any one of the five alternative policies, Kraft was particularly impressed by the magnitude of the lost-sales figures. She was also concerned about the inventory investment required to cut those losses by appreciable amounts. Any significant change in inventory policy would substantially enlarge the existing financing problems. Financing Alternatives While Dynatronics could gain additional financing by turning to the factoring division of the firm's commercial bank, an initial public offering of common stock was also an alternative. 4 Dynatronics, Inc. 289-063 Discussions with investment bankers had led Kraft to anticipate that Dynatronics could issue up to 400,000 shares of new common stock at a price of $6.50/share. This offering price would net Dynatronics about $5.00/share after deducting the costs and expenses associated with the offering. Kraft planned to review the proposed stock offering price in relation to the publicly traded stock of Dynatronics's competitors and in relation to Dynatronics's future prospects with and without a common stock offering. follows: In late April of 1989, various yields on debt securities of varying credit quality were as Issue 90-day Treasury bills 10-yea: Treasury bonds 10-year Corporate bonds 10-year Corporate bonds 10-year Corporate bonds Bond Rating Yield to Maturity 8.90% 9.15 10.07 10.50 13.69 AA A BB An alternative to the other external financing possibilities was continued reliance on the reinvestment of earnings with no payment of dividends. Kraft thought that the outlook for expansion and the profitability of contemplated funds commitments probably threw doubt on the wisdom of that policy, but she was uncertain about which investment and financing alternatives to recommend to her fellow shareholders. 289-063 Exhibit Income Statements, 1986-1988 ($000s) Dynatronics, Inc. 1986 1987 1988 Net sales Cost of goods sold $9,040 5,920 $13,860 8.870 $26,593 $3,120 $ 4,990 16,221 $10,372 Research and development 1,055 1,455 2,743 Selling, general and administrative 1,955 2,911 5,940 Income from operations 110 624 1,689 Interest expense 75 100 393 Other income (expenses) (12) (5) (20) Pretax income 23 23 519 1,276 Income taxes a 8 208 510 Profit after laxes Earnings/share aAfter 1986, Dynatronics's effective income tax rate at the federal and state level was 40%. $ 15 $ 311 $ 766 0.01 0.19 0.43 Exhibit 2 Balance Sheet ($000s) December 31, 1986 1987 1988 Cash Accounts receivable Inventories Raw materials Work in process Finished goods $ 305 $ 400 $ 500 1,733 3,150 5,639 320 497 930 468 816 1,343 610 736 1,018 Prepaid expenses 20 33 60 Total current assets 3,456 $ 5,632 $ 9,490 Gross fixed assets 530 745 1,343 Less: accumulated depreciation 180 300 388 Net fixed assets $ 350 $ 445 $ 955 Total assets $ 3,806 $ 6,077 EA $ 10,445 Notes payable a Accounts payable $ 960 $ 2,161 $ SA 4,537 398 621 1,210 Accrued expenses 322 443 811 Provision for taxesb 23 200 303 Other 50 255 400 Total current liabilities $ 1,753 $ 3,680 $ 7,261 0 Common stock ($.50 par value) 795 820 900 Paid-in surplus 1,215 1,223 1,164 Retained earnings $ 43 $ 354 $ 1,120 Total stockholders' equity $ 2,053 $ 2,397 $ 3.184 Total liabilities and net worth $ 3,806 $ 6,077 $ 10,445 Number of shares outstanding 1,590,215 1,637,805 1,799,365 aSecured by accounts receivable. bin order to avoid a penalty for underpayment of income taxes, Dynatronics made equal estimated tax payments quarterly on the 15th of April, June, September, and December of each year. The total of these four quarterly payments was required to equal at least the lesser of (a) 90% of the taxes that would actually be incurred in the year in question, or (b) 100% of the taxes due on income of the prior year. 289-063 Exhibit 3 Alternative Dynatronics, Inc. Selected Financial Data on Possible Inventory Policies ($000s) Available Supply of Finished Goods Inventory (1) Total Investment in Finished Goods Inventorya (2) Annual Sales Loss Because of Stockouts (3) Annual Combined Setup, Warehouse, Handling, and Insurance Costs b Pro Forma 1989 15 days' sales $ 830 $1,667 $43 ABCDE 18 days' salesc 1,022 1,267 53 24 days' sales 1,363 771 64 32 days' sales 1,818 384 77 42 days' sales c 2,386 143 90 52 days' sales 2,898 44 95 aBased on forecast annual cost-of-sales rate of $20.74 million for 1989. binterest expense and/or other financing costs are not included. CMeasured as (finished goods inventory/cost of goods sold) x 365. Exhibit 4 Selected Financial Data for Dynatronics and Selected Competitors, 1986-1989 AMP Inc. Al 1986 1987 1988 4/24/89a 1986 19 Sales ($ millions) 1,934 2,318 2,670 334 3 EPS ($) 1.52 2.31 2.96 3.10E .51 Dividend/share ($) .74 .85 1.00 Closing stock price ($) 36-1/8 46-3/4 44-1/2 42-5/8 15-5/8 11-1 Shares outstanding (millions) 108.1 107.5 108.5 43.9 Book value/share ($) 10.50 12.54 15.10 5.65 ROE .145 .185 .195 .185E .087 250 5. .0 Capitalization (book value) Debt 4% 5% 5% 10% Equity 96% 95% 95% 90% 93 Q.. Beta 1.4 Dynatech Corp. Sales ($ millions) EPS ($) 305 2.10 368 400 9 2.08 2.05 2.30E .01 Dividend/share ($) Closing stock price ($) 30-7/8 19-3/4 18 17-1/2 NA Shares outstanding (millions) 11.1 11.8 12.0 1.6 Book value/share ($) 11.15 12.86 13.75 1.29 1. ROE .188 .161 .150 .185E .007 .1: Capitalization (book value) Debt 25% 22% 18% 32% 47 75% Beta Equity aSecurity analysts' estimates for year-end earnings, and ROE of common stock; actual data as of 4/24/89 for stock prices. 78% 82% 68% 53 1485 1.3 elected Competitors, 1986-1989 289-063 AMP Inc. Analog Devices, Inc. 1987 1988 4/24/89a 1986 1987 1988 4/29/89a 2,318 2,670 334 370 439 2.31 2.96 3.10E .51 .40 .80 1.05E .85 1.00 46-3/4 44-1/2 42-5/8 15-5/8 11-1/4 12-1/4 11-3/8 107.5 108.5 43.9 45.3 46.9 12.54 15.10 5.65 5.71 6.87 .185 .195 .185E .087 .065 .111 .125E 5% 5% 10% 7% 5% 95% 95% 90% 93% 95% 1.4 1.35 Dynatech Corp. 368 400 9 14 2.08 2.05 2.30E .01 .19 Dynatronics 27 .43 . 19-3/4 18 17-1/2 NA NA - NA 11.8 12.0 1.6 1.6 1.8 12.86 13.75 1.29 1.46 1.77 .161 .150 .185E .007 .130 .240 22% 18% 32% 47% 59% 78% 82% 68% 53% 41% 1.3 NA common stock; actual data as of 4/24/89 for stock prices. -9- Liz Kraft, CFO at Dynatronics, Inc. was concerned about the company's future investment and financing programs. A rapidly growing market combined with the introduction of a new product and efforts to be more responsive to customer delivery requirements required significant new external financing. In April 1989, however, the company's financing opportunities were severely restricted by its current financial position. Background Dynatronics was founded in Burlington, Massachusetts in 1979 by three electrical engineers. At the outset, stock in the company had been owned entirely by this group of three founders. Later, stock options had been granted to two managers as an inducement to join the company. These options had been exercised, and in 1989 the entire equity was owned by these five people in approximately equal blocks. The five also held all the top management positions and comprised the board of directors. Dynatronics had enjoyed considerable success since its founding. The product line had been expanded from one original product to include several lines of proprietary items sold as components. These products performed decision control, storage, and ancillary functions as components of digital systems. They were primarily produced for off-the-shelf sale to customers who used them in systems of their own design and manufacture. Company profit came principally from the sale of these proprietary products. As the company expanded, it also began the manufacture-to-order of a variety of special- purpose systems that applied digital techniques to computing, information handling, control tasks, and data processing. The systems were used in space equipment, navigation and positioning systems, signal processing, data converters, and a variety of other end uses associated directly or indirectly with government expenditures for military and non-military purposes. This business accounted for roughly one-fourth of Dynatronics's sales. The company profited from the inclusion of its products in these systems, but little, if any, additional profit had been gained from the provision of engineering services. Dynatronics's proprietary products were subject to a high rate of obsolescence in an extremely competitive market. Although protected by patents, these items were always exposed to the competition of alternatively engineered products performing the same function. Typically, the company's new products achieved about 75% of their highest sales level in their first year. Peak volumes were reached and maintained in the second and third years. These years normally were followed by steep decay and virtual worthlessness by the sixth or seventh year. This six-to-seven year cycle had been cut short by competitive developments for about 20% of the new products that This case was prepared as the basis for class discussion rather than to illustrate either effective or ineffective handling of an administrative situation. the company had introduced during the past ten years, and on those occasions Dynatronics had been forced to absorb substantial inventory write-offs. The danger of being leapfrogged technically was met by aggressive spending expenditures on research and development to improve existing product lines and add new ones. Company officials had been successful in recruiting and holding a strong research group, and this group, supported by ample budgetary allocations, had created enviable market respect for the quality of the company's products. The five owner-managers were determined to maintain that reputation. Over the years continuing expansion had led to a number of changes in Dynatronics's internal organization. Sales outlets had been established in Silicon Valley, and late in 1987, a small plant had been constructed there for the design and production of systems for the aerospace industry. Earlier, production of proprietary products had been shifted from Burlington to a wholly owned subsidiary in Puerto Rico, largely because of the availability in that area of a low-wage labor force. Production operations at the subsidiary consisted almost entirely of assembling and packaging modules and allied components. Other managerial offices remained at the original site in Burlington. In the period after 1985, rapidly widening product acceptance had almost tripled the company's sales (Exhibit 1), and its investment in current assets had expanded accordingly (Exhibit 2). Short-term loans, secured by the pledge of receivables, had been obtained from Dynatronics's local bank to support this growing requirement. The bank had been willing to lend 85% of the face amount of the receivables, and this banking arrangement had proved generally satisfactory until early 1989. At that time an officer of the bank had made it clear that Dynatronics had reached the limit of the credit line that the bank was willing to extend in the absence of some improvement in the company's capital structure. New equity would qualify Dynatronics for a larger loan, but the loan limit would no longer be increased as accounts receivable grew if total liabilities/net worth exceeded 2.0. As sales had continued to increase in 1989, the company continued to produce earnings in approximately the same proportion to sales as in 1988, but the retention of these earnings had failed to alter the bank's stand on additional financing. When approached in April, the loan officer had been unwilling to extend additional credit. He did offer to introduce Kraft to the factoring division of the bank. This division serviced higher-risk customers with accounts-receivable financing. It generally set no limit on liabilities-to-net worth ratios, and would lend up to 90% of the outstanding accounts-receivable balances. This division of the bank would monitor Dynatronics's credit extension and accounts receivable collection activities much more closely than the bank's commercial loan department. Because of greater risk and the extra costs involved in closer monitoring of the loan, the interest rate charged by the bank would rise from prime plus 1/2% to prime plus 4% on the total loans outstanding to Dynatronics. The prime rate was currently 111/2%. Growth Prospects In late April, Kraft prepared the following forecast of Dynatronics year-end 1989 current asset position to help in assessing the company's immediate financing problems. Cash Receivables Inventory Raw materials Work in process Finished goods Prepaid expenses TOTAL $ 680,000 7,480,000 1,182,000 1,721,000 830,000 77,000 $11,970,000 The forecast assumed sales of $34 million and a corresponding cost-of-goods-sold figure of $20.74 million. These estimates had been employed with some confidence in forecasting working- capital requirements since sales in recent months and impressions of customers' production plans for the balance of the year pointed toward continued growth. Receivables had been estimated at 22% of sales, and raw materials and work-in-process at a four-weeks' rate of usage. Finished goods, on the other hand, had been forecasted at about a two-weeks' supply. During preceding months finished-goods inventory had been deliberately reduced in relation to sales as other cash requirements had mounted. Kraft believed that continued curtailment of investment in finished-goods inventory was likely to be costly in terms of lost sales and competitive position, but lacking other immediate sources of funds, she also felt that the stock of finished goods would have to be held to the forecasted level if the company were to avoid an acute cash emergency. Beyond 1989, the marketing manager had estimated that sales of the company's current products would reach $40 million in 1990. Without major product innovation, he thought that sales could probably be maintained at that level in 1991, but if past patterns prevailed, he expected a decline of $10 million or $12 million in 1992. The forecast for 1990 was based on the marketing group's knowledge of government appropriations for ongoing defense and aerospace programs. It could be upset by project cancellations, but that was considered highly unlikely for the projects concerned. On the other hand, the plateau and descent pattern of the more distant estimates emphasized the importance of maintaining Dynatronics's technical pre-eminence. Investment Possibilities Kraft was under pressure to finance both the existing business lines as well as two opportunities for investment that might improve the forecasted sales pattern and its profit consequences in the future. One involved the introduction of a major new product line and the other, a revision of the company's finished-goods inventory control system. The new product line, which had been under development for the past two years, was believed to possess technical qualities that would give it significant competitive advantages. All of the items making up the line were in a late stage of development, and the line was currently scheduled for introduction at the end of the year. Market reception was difficult to gauge, but the marketing manager was confident that the line would contribute sales of at least $5.0 million in 1990 and $6.5 million in 1991. The line would be priced to give the same gross profit margin as the company's other products. Putting the line into production in the Puerto Rican plant required about $250,000 for specialized equipment. The plant had been built to accommodate more growth than had yet been realized, and no additional outlays were anticipated for production facilities. However, the 289-063 Dynatronics, Inc. marketing manager had estimated that a one-time budget allocation of $90,000 in addition to a normal allocation of SG&A expenses would be needed to introduce and promote the line if it were to achieve its full potential. Additional investment in working capital would also be required to support the added sales. The second investment possibility-that of increasing stocks of finished goods-grew out of widespread feeling that economizing in that direction had already been pushed far beyond justifiable limits. Expediting had become commonplace in juggling production schedules, with costly consequences, and orders had been lost to competitors with disturbing frequency when customers were notified of long but necessary delivery delays. Kraft therefore had ordered a review of the company's entire inventory control system. Echa un vistazo a estos ttulos gratuitos 3 The area of concern, as a result of that study, had been narrowed to the finished-goods segment of total inventory. Some improvements seemed possible in balancing raw material stocks, but it was not thought that this would lead to any appreciable change in the relationship of total raw material inventory to production volume. Lead time required by the purchasing department and limited interchangeability of parts among product lines combined to fix the required total at roughly a four-weeks' supply level. Work-in-process inventory seemed similarly intractable. Allocation of shop labor, timing of lot starts, schedules, and so on, were already being decided on grounds of optimum production arrangements, as the production manager saw them. Technical changes, necessitating work stoppages, often had to be introduced during the in-process stage, and therefore the production manager, and the engineering group as well, attached considerable value to the flexibility allowed by a four-weeks' production period. By contrast with its approval of current raw material and in-process control practices, the report recommended complete revamping of the system being used to determine finished-goods inventory levels. The present system was based on specific item-by-item sales forecasts for the coming quarter. Given those forecasts, goods were scheduled into production in quantities that would raise the level of existing stocks to the anticipated sales requirement. Recently, as noted above, financial circumstances had made it necessary to cut stocks below the target levels that would have been set in more normal circumstances, but the report's condemnation of the system was independent of that experience. The report's criticism centered on the system's dependence on quarterly sales forecasts and the inaccuracy of such estimates. Replacement demand could be predicted with tolerable margins of error. But new orders were typically received at erratic intervals. Moreover, new orders comprised a large part of the total demand for most products. The report urged adopting a system of buffer stocks that would be set with more careful consideration of costs, returns, and risks associated with inventory maintenance. Data had been compiled on five possible inventory-sales levels representing substantially different inventory policies (Exhibit 3). In each case the lost-sales estimate was derived from computer simulations (using appropriate reorder points and reorder quantities) of the demand experience of major product lines. Since Dynatronics was currently operating with lower finished-goods stocks than those contemplated by any one of the five alternative policies, Kraft was particularly impressed by the magnitude of the lost-sales figures. She was also concerned about the inventory investment required to cut those losses by appreciable amounts. Any significant change in inventory policy would substantially enlarge the existing financing problems. Financing Alternatives While Dynatronics could gain additional financing by turning to the factoring division of the firm's commercial bank, an initial public offering of common stock was also an alternative. 4 Dynatronics, Inc. 289-063 Discussions with investment bankers had led Kraft to anticipate that Dynatronics could issue up to 400,000 shares of new common stock at a price of $6.50/share. This offering price would net Dynatronics about $5.00/share after deducting the costs and expenses associated with the offering. Kraft planned to review the proposed stock offering price in relation to the publicly traded stock of Dynatronics's competitors and in relation to Dynatronics's future prospects with and without a common stock offering. follows: In late April of 1989, various yields on debt securities of varying credit quality were as Issue 90-day Treasury bills 10-yea: Treasury bonds 10-year Corporate bonds 10-year Corporate bonds 10-year Corporate bonds Bond Rating Yield to Maturity 8.90% 9.15 10.07 10.50 13.69 AA A BB An alternative to the other external financing possibilities was continued reliance on the reinvestment of earnings with no payment of dividends. Kraft thought that the outlook for expansion and the profitability of contemplated funds commitments probably threw doubt on the wisdom of that policy, but she was uncertain about which investment and financing alternatives to recommend to her fellow shareholders. 289-063 Exhibit Income Statements, 1986-1988 ($000s) Dynatronics, Inc. 1986 1987 1988 Net sales Cost of goods sold $9,040 5,920 $13,860 8.870 $26,593 $3,120 $ 4,990 16,221 $10,372 Research and development 1,055 1,455 2,743 Selling, general and administrative 1,955 2,911 5,940 Income from operations 110 624 1,689 Interest expense 75 100 393 Other income (expenses) (12) (5) (20) Pretax income 23 23 519 1,276 Income taxes a 8 208 510 Profit after laxes Earnings/share aAfter 1986, Dynatronics's effective income tax rate at the federal and state level was 40%. $ 15 $ 311 $ 766 0.01 0.19 0.43 Exhibit 2 Balance Sheet ($000s) December 31, 1986 1987 1988 Cash Accounts receivable Inventories Raw materials Work in process Finished goods $ 305 $ 400 $ 500 1,733 3,150 5,639 320 497 930 468 816 1,343 610 736 1,018 Prepaid expenses 20 33 60 Total current assets 3,456 $ 5,632 $ 9,490 Gross fixed assets 530 745 1,343 Less: accumulated depreciation 180 300 388 Net fixed assets $ 350 $ 445 $ 955 Total assets $ 3,806 $ 6,077 EA $ 10,445 Notes payable a Accounts payable $ 960 $ 2,161 $ SA 4,537 398 621 1,210 Accrued expenses 322 443 811 Provision for taxesb 23 200 303 Other 50 255 400 Total current liabilities $ 1,753 $ 3,680 $ 7,261 0 Common stock ($.50 par value) 795 820 900 Paid-in surplus 1,215 1,223 1,164 Retained earnings $ 43 $ 354 $ 1,120 Total stockholders' equity $ 2,053 $ 2,397 $ 3.184 Total liabilities and net worth $ 3,806 $ 6,077 $ 10,445 Number of shares outstanding 1,590,215 1,637,805 1,799,365 aSecured by accounts receivable. bin order to avoid a penalty for underpayment of income taxes, Dynatronics made equal estimated tax payments quarterly on the 15th of April, June, September, and December of each year. The total of these four quarterly payments was required to equal at least the lesser of (a) 90% of the taxes that would actually be incurred in the year in question, or (b) 100% of the taxes due on income of the prior year. 289-063 Exhibit 3 Alternative Dynatronics, Inc. Selected Financial Data on Possible Inventory Policies ($000s) Available Supply of Finished Goods Inventory (1) Total Investment in Finished Goods Inventorya (2) Annual Sales Loss Because of Stockouts (3) Annual Combined Setup, Warehouse, Handling, and Insurance Costs b Pro Forma 1989 15 days' sales $ 830 $1,667 $43 ABCDE 18 days' salesc 1,022 1,267 53 24 days' sales 1,363 771 64 32 days' sales 1,818 384 77 42 days' sales c 2,386 143 90 52 days' sales 2,898 44 95 aBased on forecast annual cost-of-sales rate of $20.74 million for 1989. binterest expense and/or other financing costs are not included. CMeasured as (finished goods inventory/cost of goods sold) x 365. Exhibit 4 Selected Financial Data for Dynatronics and Selected Competitors, 1986-1989 AMP Inc. Al 1986 1987 1988 4/24/89a 1986 19 Sales ($ millions) 1,934 2,318 2,670 334 3 EPS ($) 1.52 2.31 2.96 3.10E .51 Dividend/share ($) .74 .85 1.00 Closing stock price ($) 36-1/8 46-3/4 44-1/2 42-5/8 15-5/8 11-1 Shares outstanding (millions) 108.1 107.5 108.5 43.9 Book value/share ($) 10.50 12.54 15.10 5.65 ROE .145 .185 .195 .185E .087 250 5. .0 Capitalization (book value) Debt 4% 5% 5% 10% Equity 96% 95% 95% 90% 93 Q.. Beta 1.4 Dynatech Corp. Sales ($ millions) EPS ($) 305 2.10 368 400 9 2.08 2.05 2.30E .01 Dividend/share ($) Closing stock price ($) 30-7/8 19-3/4 18 17-1/2 NA Shares outstanding (millions) 11.1 11.8 12.0 1.6 Book value/share ($) 11.15 12.86 13.75 1.29 1. ROE .188 .161 .150 .185E .007 .1: Capitalization (book value) Debt 25% 22% 18% 32% 47 75% Beta Equity aSecurity analysts' estimates for year-end earnings, and ROE of common stock; actual data as of 4/24/89 for stock prices. 78% 82% 68% 53 1485 1.3 elected Competitors, 1986-1989 289-063 AMP Inc. Analog Devices, Inc. 1987 1988 4/24/89a 1986 1987 1988 4/29/89a 2,318 2,670 334 370 439 2.31 2.96 3.10E .51 .40 .80 1.05E .85 1.00 46-3/4 44-1/2 42-5/8 15-5/8 11-1/4 12-1/4 11-3/8 107.5 108.5 43.9 45.3 46.9 12.54 15.10 5.65 5.71 6.87 .185 .195 .185E .087 .065 .111 .125E 5% 5% 10% 7% 5% 95% 95% 90% 93% 95% 1.4 1.35 Dynatech Corp. 368 400 9 14 2.08 2.05 2.30E .01 .19 Dynatronics 27 .43 . 19-3/4 18 17-1/2 NA NA - NA 11.8 12.0 1.6 1.6 1.8 12.86 13.75 1.29 1.46 1.77 .161 .150 .185E .007 .130 .240 22% 18% 32% 47% 59% 78% 82% 68% 53% 41% 1.3 NA common stock; actual data as of 4/24/89 for stock prices. -9-
Expert Answer:

Posted Date:
Students also viewed these finance questions
-
2. The data below" lists the date and amount of coverage (in km^2) of an invasive species of water hyacinth in the Valsequillo Reservoir, in Mexico, between May 1991 and January 2019. Amount (km^2)...
-
The Crazy Eddie fraud may appear smaller and gentler than the massive billion-dollar frauds exposed in recent times, such as Bernie Madoffs Ponzi scheme, frauds in the subprime mortgage market, the...
-
Managing Scope Changes Case Study Scope changes on a project can occur regardless of how well the project is planned or executed. Scope changes can be the result of something that was omitted during...
-
The atomic mass of 14c is 14.003242 u. Show that the decay of 14C is energetically possible, and calculate the energy released in the decay.
-
How does the stage of a product's life cycle affect price? Give some examples.
-
The International Monetary Fund (IMF) makes loans of currency reserves to countries which are running out of reserves. a. How would a loan of currency reserves help a country maintain a fixed...
-
Explain the grandparent-parent-child backup technique. Is it used for sequential files or direct access techniques? Explain.
-
Using OLAP Query 1 shown in Figure 9.11 (based on data from Figure 9.7) as a starting point, give an example that illustrates a pivot operation.
-
Kamla Harris is an audit senior at Trump & Biden, a large international audit firm. He has been asked by the audit partner to evaluate the following audit risks of a major international client. For...
-
PROBLEM 3 (Based on 14.5) Assume that you are the CFO at Porter Memorial Hospital. The CEO has asked you to analyze two proposed capital investments - project X and project Y. Each project requires a...
-
4. (10 points) Write a method body for the Natural Number instance method whose contract is given below. Note that this is a restores-mode parameter. For full credit, you must use only one return...
-
Create a Flowchart base on this :Dg = 1 5 0 ; Vd = 5 0 ; ke = 0 . 4 ; ka = 1 . 6 ; % % % answer for part a ) t = 0 ; count = 1 ; % values for Cp array index while ( t < 1 0 ) Cp ( count ) = ( ( Dg *...
-
Sheridan Inc. has the following transactions during August of the current year. Indicate (a) the effect on the accounting equation and (b) the debit-credit analysis: (For Column A, List the entries...
-
Pressure Pumps Corporation, a manufacturer of industrial pumps, reports the following results for the year ended January 31, 20Y2 Retained earnings, February 1, 20Y1 Net income Cash dividends...
-
Clopack Company manufactures one product that goes through one processing department called Mixing. All raw materials are introduced at the start of work in the Mixing Department. The company uses...
-
Are there additional empirical materials that would help to flesh out emerging analysis please do fast and give correct answer i will rate
-
U.S. households have become smaller over the years. The following table from the 2010 GSS contains information on the number of people currently aged 18 years or older living in a respondent's...
-
How do teams work?
-
Task characteristics, reward systems, and team size are all ____________ that can make a difference in group effectiveness. (a) group processes (b) group dynamics (c) group inputs (d) human resource...
-
When a new team member is anxious about questions such as Will I be able to influence what takes place? the underlying issue is one of ____________. (a) relationships (b) goals (c) processes (d)...

Study smarter with the SolutionInn App