

Looking at the chart showing the number of institutions and their assets, deposits, equity, and income and
Fantastic news! We've Found the answer you've been seeking!
Question:
Looking at the chart showing the number of institutions and their assets, deposits, equity, and income and profitability data from 2007-2018 comment on the significant changes in each category for each institution.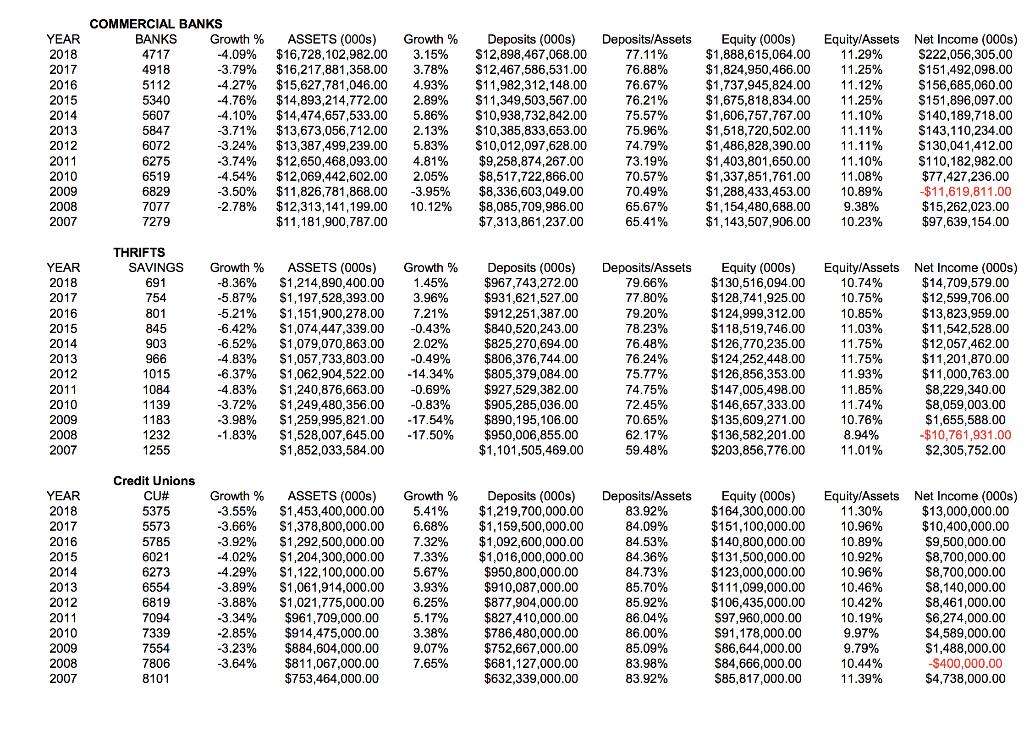
Transcribed Image Text:
YEAR 2018 2017 2016 2015 2014 2013 2012 2011 2010 2009 2008 2007 YEAR 2018 2017 2016 2015 2014 2013 2012 2011 2010 2009 2008 2007 YEAR 2018 2017 2016 2015 2014 2013 2012 2011 2010 2009 2008 2007 COMMERCIAL BANKS BANKS 4717 4918 5112 5340 5607 5847 6072 6275 6519 6829 7077 7279 THRIFTS SAVINGS 691 754 801 845 903 966 1015 1084 1139 1183 1232 1255 Credit Unions CU# 5375 5573 5785 6021 6273 6554 6819 7094 7339 7554 7806 8101 Growth % ASSETS (000s) Growth % -4.09% $16,728,102,982.00 3.15% -3.79% $16,217,881,358.00 3.78% $12,467,586,531.00 -4.27% $15,627,781,046.00 4.93% $11,982,312,148.00 -4.76% $14,893,214,772.00 2.89% $11,349,503,567.00 -4.10% $14,474,657,533.00 5.86% $10,938,732,842.00 -3.71% $13,673,056,712.00 2.13% $10,385,833,653.00 -3.24% $13,387,499,239.00 5.83% $10,012,097,628.00 -3.74% $12,650,468,093.00 4.81% $9,258,874,267.00 -4.54% $12,069,442,602.00 2.05% $8,517,722,866.00 $8,336,603,049.00 $8,085,709,986.00 $7,313,861,237.00 -3.50% -2.78% $11,826,781,868.00 -3.95% $12,313,141,199.00 10.12% $11,181,900,787.00 Growth % ASSETS (000s) Growth % -8.36% $1,214,890,400.00 1.45% -5.87% $1,197,528,393.00 3.96% -5.21% $1,151,900,278.00 7.21% -6.42% $1,074,447,339.00 -0.43% -6.52% $1,079,070,863.00 2.02% -4.83% $1,057,733,803.00 -0.49% -6.37% $1,062,904,522.00 -14.34% -4.83% $1,240,876,663.00 -0.69% -3.72% $1,249,480,356.00 -0.83% -3.98% $1,259,995,821.00 -17.54% -1.83% $1,528,007,645.00 -17.50% $1,852,033,584.00 Growth % -3.55% -3.66% ASSETS (000s) Growth % $1,453,400,000.00 5.41% $1,378,800,000.00 6.68% -3.92% $1,292,500,000.00 7.32% -4.02% $1,204,300,000.00 7.33% -4.29% $1,122,100,000.00 5.67% -3.89% $1,061,914,000.00 3.93% -3.88% $1,021,775,000.00 6.25% -3.34% $961,709,000.00 5.17% $914,475,000.00 3.38% $884,604,000.00 9.07% $811,067,000.00 7.65% $753,464,000.00 Deposits (000s) Deposits/Assets $12,898,467,068.00 77.11% 76.88% 76.67% 76.21% 75.57% 75.96% 74.79% 73.19% 70.57% 70.49% 65.67% 65.41% -2.85% -3.23% -3.64% Deposits (000s) $967,743,272.00 $931,621,527.00 $912,251,387.00 $840,520,243.00 $825,270,694.00 $806,376,744.00 $805,379,084.00 $927,529,382.00 $905,285,036.00 $890,195,106.00 $950,006,855.00 $1,101,505,469.00 Deposits/Assets 79.66% 77.80% 79.20% 78.23% 76.48% 76.24% 75.77% 74.75% 72.45% 70.65% 62.17% 59.48% Deposits (000s) Deposits/Assets $1,219,700,000.00 $1,159,500,000.00 $1,092,600,000.00 $1,016,000,000.00 $950,800,000.00 $910,087,000.00 $877,904,000.00 $827,410,000.00 $786,480,000.00 $752,667,000.00 $681,127,000.00 $632,339,000.00 83.92% 84.09% 84.53% 84.36% 84.73% 85.70% 85.92% 86.04% 86.00% 85.09% 83.98% 83.92% Equity (000s) Equity/Assets $1,888,615,064.00 11.29% $1,824,950,466.00 11.25% $1,737,945,824.00 11.12% $1,675,818,834.00 11.25% $1,606,757,767.00 11.10% $1,518,720,502.00 11.11% $1,486,828,390.00 11.11% $1,403,801,650.00 11.10% $1,337,851,761.00 11.08% $1,288,433,453.00 10.89% $1,154,480,688.00 9.38% $1,143,507,906.00 10.23% Net Income (000s) $222,056,305.00 $151,492,098.00 10.75% 10.85% 11.03% 11.75% 11.75% 11.93% 11.85% 11.74% 10.76% 8.94% 11.01% $156,685,060.00 $151,896,097.00 $140,189,718.00 $143,110,234.00 $130,041,412.00 $110,182,982.00 $77,427,236.00 -$11,619,811.00 $15,262,023.00 $97,639,154.00 10.74% $14.709,579.00 Equity (000s) Equity/Assets Net Income (000s) $130,516,094.00 $128,741,925.00 $124,999,312.00 $118,519,746.00 $126,770,235.00 $124,252,448.00 $126,856,353.00 $147,005,498.00 $146,657,333.00 $135,609,271.00 $136,582,201.00 $12,599,706.00 $13,823,959.00 $11,542,528.00 $12,057,462.00 $11,201,870.00 $11,000,763.00 $8,229,340.00 $8,059,003.00 $1,655,588.00 -$10,761,931.00 $203,856,776.00 $2,305,752.00 Equity (000s) Equity/Assets Net Income (000s) $164,300,000.00 11.30% $13,000,000.00 $10,400,000.00 $151,100,000.00 10.96% $140,800,000.00 10.89% $131,500,000.00 10.92% $123,000,000.00 10.96% $111,099,000.00 10.46% $106,435,000.00 10.42% $97,960,000.00 10.19% $91,178,000.00 9.97% $86,644,000.00 9.79% $84,666,000.00 10.44% $85,817,000.00 11.39% $9,500,000.00 $8,700,000.00 $8,700,000.00 $8,140,000.00 $8,461,000.00 $6,274,000.00 $4,589,000.00 $1,488,000.00 -$400,000.00 $4,738,000.00 YEAR 2018 2017 2016 2015 2014 2013 2012 2011 2010 2009 2008 2007 YEAR 2018 2017 2016 2015 2014 2013 2012 2011 2010 2009 2008 2007 YEAR 2018 2017 2016 2015 2014 2013 2012 2011 2010 2009 2008 2007 COMMERCIAL BANKS BANKS 4717 4918 5112 5340 5607 5847 6072 6275 6519 6829 7077 7279 THRIFTS SAVINGS 691 754 801 845 903 966 1015 1084 1139 1183 1232 1255 Credit Unions CU# 5375 5573 5785 6021 6273 6554 6819 7094 7339 7554 7806 8101 Growth % ASSETS (000s) Growth % -4.09% $16,728,102,982.00 3.15% -3.79% $16,217,881,358.00 3.78% $12,467,586,531.00 -4.27% $15,627,781,046.00 4.93% $11,982,312,148.00 -4.76% $14,893,214,772.00 2.89% $11,349,503,567.00 -4.10% $14,474,657,533.00 5.86% $10,938,732,842.00 -3.71% $13,673,056,712.00 2.13% $10,385,833,653.00 -3.24% $13,387,499,239.00 5.83% $10,012,097,628.00 -3.74% $12,650,468,093.00 4.81% $9,258,874,267.00 -4.54% $12,069,442,602.00 2.05% $8,517,722,866.00 $8,336,603,049.00 $8,085,709,986.00 $7,313,861,237.00 -3.50% -2.78% $11,826,781,868.00 -3.95% $12,313,141,199.00 10.12% $11,181,900,787.00 Growth % ASSETS (000s) Growth % -8.36% $1,214,890,400.00 1.45% -5.87% $1,197,528,393.00 3.96% -5.21% $1,151,900,278.00 7.21% -6.42% $1,074,447,339.00 -0.43% -6.52% $1,079,070,863.00 2.02% -4.83% $1,057,733,803.00 -0.49% -6.37% $1,062,904,522.00 -14.34% -4.83% $1,240,876,663.00 -0.69% -3.72% $1,249,480,356.00 -0.83% -3.98% $1,259,995,821.00 -17.54% -1.83% $1,528,007,645.00 -17.50% $1,852,033,584.00 Growth % -3.55% -3.66% ASSETS (000s) Growth % $1,453,400,000.00 5.41% $1,378,800,000.00 6.68% -3.92% $1,292,500,000.00 7.32% -4.02% $1,204,300,000.00 7.33% -4.29% $1,122,100,000.00 5.67% -3.89% $1,061,914,000.00 3.93% -3.88% $1,021,775,000.00 6.25% -3.34% $961,709,000.00 5.17% $914,475,000.00 3.38% $884,604,000.00 9.07% $811,067,000.00 7.65% $753,464,000.00 Deposits (000s) Deposits/Assets $12,898,467,068.00 77.11% 76.88% 76.67% 76.21% 75.57% 75.96% 74.79% 73.19% 70.57% 70.49% 65.67% 65.41% -2.85% -3.23% -3.64% Deposits (000s) $967,743,272.00 $931,621,527.00 $912,251,387.00 $840,520,243.00 $825,270,694.00 $806,376,744.00 $805,379,084.00 $927,529,382.00 $905,285,036.00 $890,195,106.00 $950,006,855.00 $1,101,505,469.00 Deposits/Assets 79.66% 77.80% 79.20% 78.23% 76.48% 76.24% 75.77% 74.75% 72.45% 70.65% 62.17% 59.48% Deposits (000s) Deposits/Assets $1,219,700,000.00 $1,159,500,000.00 $1,092,600,000.00 $1,016,000,000.00 $950,800,000.00 $910,087,000.00 $877,904,000.00 $827,410,000.00 $786,480,000.00 $752,667,000.00 $681,127,000.00 $632,339,000.00 83.92% 84.09% 84.53% 84.36% 84.73% 85.70% 85.92% 86.04% 86.00% 85.09% 83.98% 83.92% Equity (000s) Equity/Assets $1,888,615,064.00 11.29% $1,824,950,466.00 11.25% $1,737,945,824.00 11.12% $1,675,818,834.00 11.25% $1,606,757,767.00 11.10% $1,518,720,502.00 11.11% $1,486,828,390.00 11.11% $1,403,801,650.00 11.10% $1,337,851,761.00 11.08% $1,288,433,453.00 10.89% $1,154,480,688.00 9.38% $1,143,507,906.00 10.23% Net Income (000s) $222,056,305.00 $151,492,098.00 10.75% 10.85% 11.03% 11.75% 11.75% 11.93% 11.85% 11.74% 10.76% 8.94% 11.01% $156,685,060.00 $151,896,097.00 $140,189,718.00 $143,110,234.00 $130,041,412.00 $110,182,982.00 $77,427,236.00 -$11,619,811.00 $15,262,023.00 $97,639,154.00 10.74% $14.709,579.00 Equity (000s) Equity/Assets Net Income (000s) $130,516,094.00 $128,741,925.00 $124,999,312.00 $118,519,746.00 $126,770,235.00 $124,252,448.00 $126,856,353.00 $147,005,498.00 $146,657,333.00 $135,609,271.00 $136,582,201.00 $12,599,706.00 $13,823,959.00 $11,542,528.00 $12,057,462.00 $11,201,870.00 $11,000,763.00 $8,229,340.00 $8,059,003.00 $1,655,588.00 -$10,761,931.00 $203,856,776.00 $2,305,752.00 Equity (000s) Equity/Assets Net Income (000s) $164,300,000.00 11.30% $13,000,000.00 $10,400,000.00 $151,100,000.00 10.96% $140,800,000.00 10.89% $131,500,000.00 10.92% $123,000,000.00 10.96% $111,099,000.00 10.46% $106,435,000.00 10.42% $97,960,000.00 10.19% $91,178,000.00 9.97% $86,644,000.00 9.79% $84,666,000.00 10.44% $85,817,000.00 11.39% $9,500,000.00 $8,700,000.00 $8,700,000.00 $8,140,000.00 $8,461,000.00 $6,274,000.00 $4,589,000.00 $1,488,000.00 -$400,000.00 $4,738,000.00
Expert Answer:

Related Book For 
Niebels Methods, Standards and Work Design
ISBN: 978-0073376318
13th edition
Authors: Andris Freivalds, Benjamin Niebel
Posted Date:
Students also viewed these finance questions
-
Using the from-to chart showing the number of units handled from one area to another per hour and the desired size of each area (in square feet), develop an optimal layout using Muther's SLP. Note...
-
Produce a chart showing the number of moves required to solve the Towers of Hanoi puzzle using the following numbers of disks: 2, 3, 4, 5, 6, 7, 8, 9, 10, 15, 20, and 25.
-
Which of the following statements are true? Free cash flow is the cash flow Check all that apply: free to be used for capital expenditure and change in net operating working capital. free to be paid...
-
Write a brief paper on the following topic: "Why have gasoline prices risen so high in the recent years?" Write down the reasons and divide into supply and demand effects on the market. Describe the...
-
What is communality? What is the implication of low communality for a few of the variables?
-
Moist air at 90 F, 14.7 psia, and 80% relative humidity is removed from the top of a large room at a rate of 500 ft 3 /min. The air is then cooled in an air conditioner at constant pressure to 60 F...
-
Your grades from last semester are in the table. The grading system assigns points as follows: A = 4, B = 3, C = 2, D = 1, F = 0. Determine your grade point average (weighted mean). Final Grade...
-
Since its 100% acquisition of Dreger Corporation stock on December 31, 2012, Jayco Corporation has maintained its investment under the equity method. However, due to Dregers earning potential, the...
-
During a class discussion, Jamie said that she changes the form of notetaking she uses depending on the complexity of the material she is reading. The teacher praised her methods for adjusting the...
-
Tankmaster Manufacturing Company is a large manufacturer of domestic oil tanks. Since it came into existence in 1980, the company has enjoyed steady growth in both sales and profits. Davina...
-
Compute the following ratios for the current year: (Round your answers to 2 dcimal places.) Receivable turnover ratio Inventory turnover ratio Current ratio Cash ratio Times interest earned ratio...
-
Monochromatic light passes through a small round hole \(1.36 \mu \mathrm{m}\) in radius. The light then strikes a detector \(120 \mathrm{~mm}\) away from the hole and is absorbed by the detector...
-
In a double-slit interference pattern, it is the amplitudes of the light waves from each slit that add, not the light intensities. Usually, in the analysis of interference patterns, the radiation...
-
A young adult with good vision is reading a document placed at her near point. She is using ordinary reading light of wavelength \(500 \mathrm{~nm}\), and the diameter of her pupil is \(3.0...
-
On a screen \(2.5 \mathrm{~m}\) from a slit \(0.0500 \mathrm{~mm}\) wide, you measure a separation distance of \(31 \mathrm{~mm}\) between adjacent \(n=1\) and \(n=2\) dark fringes of a laser...
-
The board of directors of Comsa Farms Berhad, a company that is engaged in the production and sale of agricultural products, based in Tawau, Malaysia, has decided to pay cash dividends totaling RM5.6...
-
Consider a lottery L consisting of getting 0 with probability 1/3 and getting 9 with probability 2/3. Hence, L = (0, 1/3; 9, 2/3). It is clear from this that the expected payout from this lottery is...
-
A 2500-lbm car moving at 15 mi/h is accelerated at a constant rate of 15 ft/s 2 up to a speed of 50 mi/h. Calculate force and total time required?
-
Complete the time study by filling in the circles. Then, calculate a standard time for an 8 hr job. Assume a 10% allowance
-
Develop a formula for the relationship between time and area from the following data: Study No. Time Area 28.6 79.4 3 11 182.0 4 15 318.0 21 589.0
-
Which factors enter into large variances in operator performance?
-
Model your car by using analogy approach and stable approach. Which one do you like more and why?
-
Model your dream house by using analogy approach and stable approach. Which one do you like more and why?
-
Try to find 23 scenarios where this pattern can be applicable.

Study smarter with the SolutionInn App