

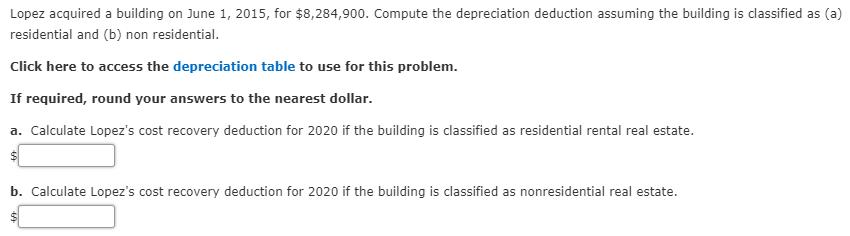
Lopez acquired a building on June 1, 2015, for $8,284,900. Compute the depreciation deduction assuming the...
Fantastic news! We've Found the answer you've been seeking!
Question:
Transcribed Image Text:
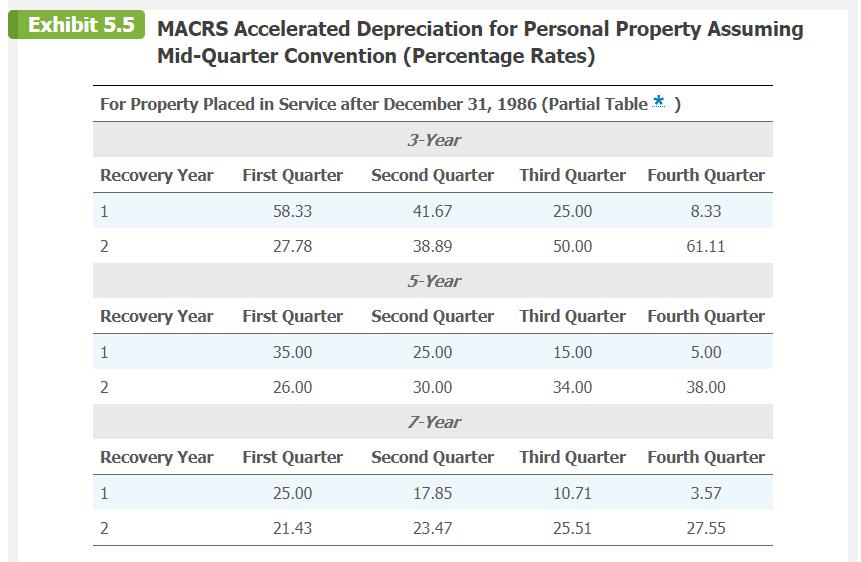
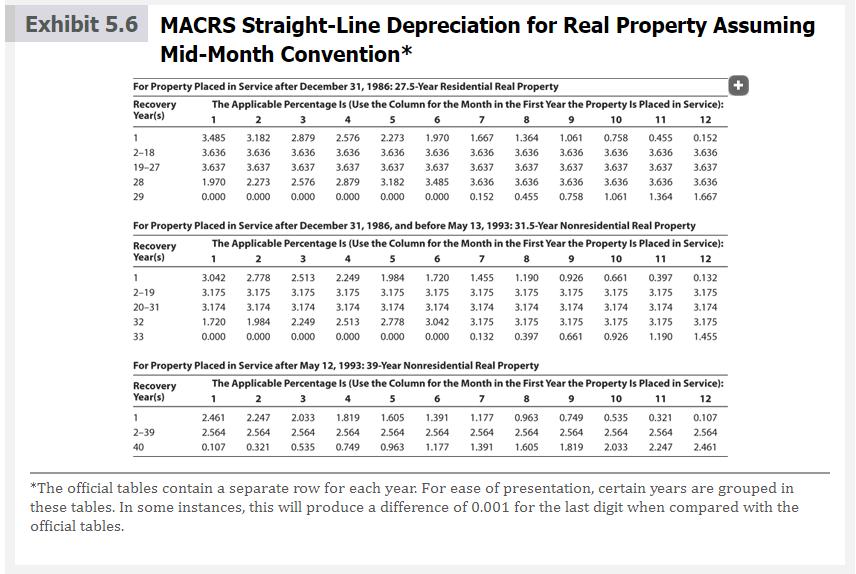
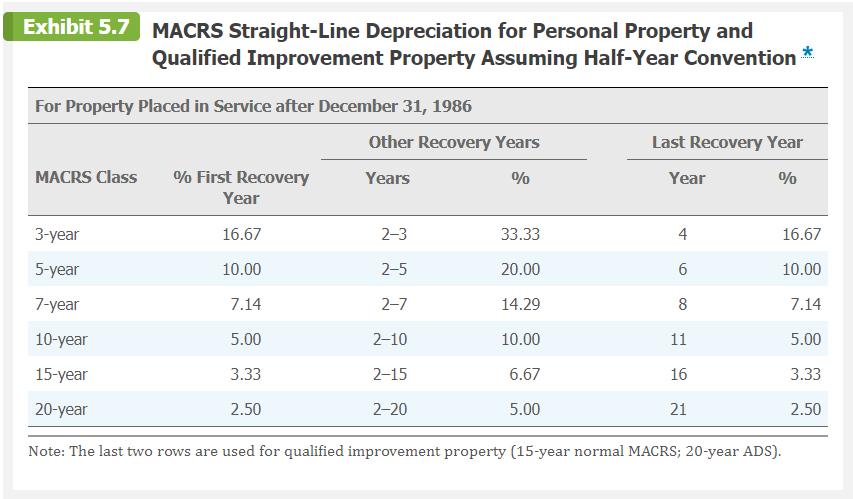
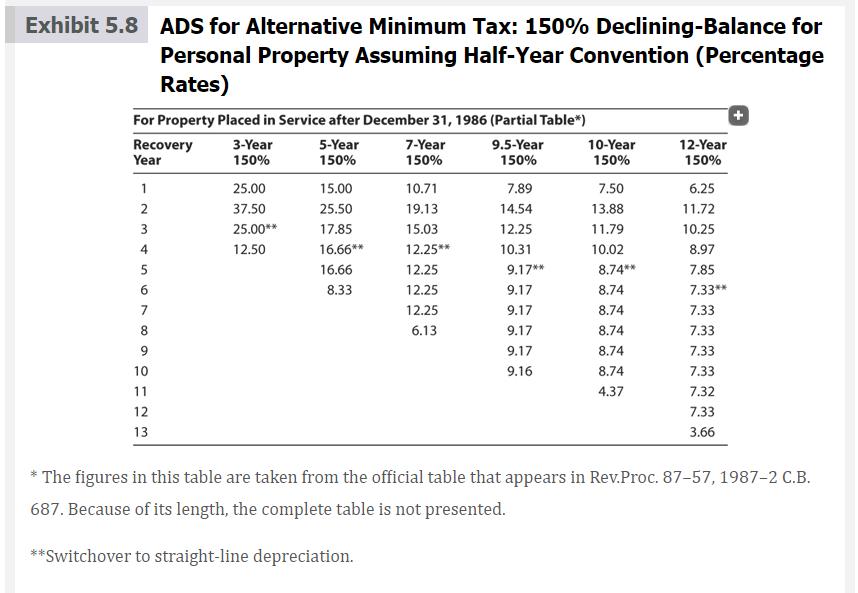
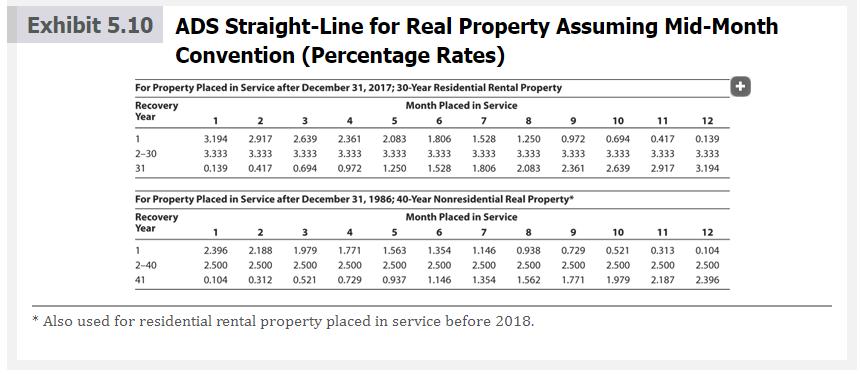
Lopez acquired a building on June 1, 2015, for $8,284,900. Compute the depreciation deduction assuming the building is classified as (a) residential and (b) non residential. Click here to access the depreciation table to use for this problem. If required, round your answers to the nearest dollar. a. Calculate Lopez's cost recovery deduction for 2020 if the building is classified as residential rental real estate. $ b. Calculate Lopez's cost recovery deduction for 2020 if the building is classified as nonresidential real estate. Exhibit 5.5 For Property Placed in Service after December 31, 1986 (Partial Table * ) 3-Year Recovery Year First Quarter Second Quarter Third Quarter Fourth Quarter 58.33 27.78 1 2 MACRS Accelerated Depreciation for Personal Property Assuming Mid-Quarter Convention (Percentage Rates) Recovery Year 1 2 Recovery Year 1 2 First Quarter 35.00 26.00 First Quarter 25.00 21.43 41.67 38.89 5-Year Second Quarter 25.00 30.00 7-Year Second Quarter 17.85 23.47 25.00 50.00 Third Quarter 15.00 34.00 Third Quarter 10.71 25.51 8.33 61.11 Fourth Quarter 5.00 38.00 Fourth Quarter 3.57 27.55 Exhibit 5.6 MACRS Straight-Line Depreciation for Real Property Assuming Mid-Month Convention* For Property Placed in Service after December 31, 1986: 27.5-Year Residential Real Property Recovery Year(s) 1 2-18 19-27 28 29 Recovery Year(s) 1 2-19 20-31 32 33 6 8 10 11 12 For Property Placed in Service after December 31, 1986, and before May 13, 1993: 31.5-Year Nonresidential Real Property The Applicable Percentage Is (Use the Column for the Month in the First Year the Property Is Placed in Service): 1 2 3 4 7 3.042 2.778 2.513 2.249 3.175 3.175 3.175 3.175 3.174 3.174 3.174 3.174 1.720 0.000 5 9 1.984 1.720 1.455 1.190 0.926 3.175 3.175 3.175 3.175 3.175 3.174 3.174 3.174 3.174 3.174 2.778 3.042 3.175 3.175 3.175 0.000 0.000 0.132 0.397 1.984 2.249 2.513 0.000 0.000 0.000 0.661 The Applicable Percentage Is (Use the Column for the Month in the First Year the Property Is Placed in Service): 1 2 3 4 5 6 8 9 10 11 12 7 3.182 2.879 2.576 2.273 1.970 1.667 1.364 3.636 3.636 3.636 3.636 3.636 3.636 3.636 3.637 3.637 3.637 3.637 3.637 3.637 3.637 2.273 2.576 2.879 3.182 3.485 3.636 3.636 3.636 0.000 0.000 0.000 0.000 0.000 0.152 0.455 0.758 1.061 0.758 3.636 3.636 3.637 3.637 3.637 Recovery Year(s) 3.485 3.636 3.637 1.970 0.000 For Property Placed in Service after May 12, 1993: 39-Year Nonresidential Real Property 1 2-39 40 0.152 3.636 3.637 3.636 3.636 3.636 1.061 1.364 1.667 0.455 3.636 2.461 2.564 0.107 0.661 3.175 3.174 3.174 3.175 3.175 0.926 1.190 0.397 3.175 0.963 0.749 0.535 2.564 2.564 2.564 1.605 1.819 5 8 9 10 11 12 The Applicable Percentage Is (Use the Column for the Month in the First Year the Property Is Placed in Service): 1 2 3 4 6 7 2.247 2.033 1.819 1.605 1.391 1.177 2.564 2.564 2.564 2.564 2.564 2.564 0.321 0.535 0.749 0.963 1.177 1.391 0.321 2.564 2.033 2.247 0.132 3.175 3.174 3.175 1.455 0.107 2.564 2.461 + *The official tables contain a separate row for each year. For ease of presentation, certain years are grouped in these tables. In some instances, this will produce a difference of 0.001 for the last digit when compared with the official tables. Exhibit 5.7 MACRS Straight-Line Depreciation for Personal Property and Qualified Improvement Property Assuming Half-Year Convention * For Property Placed in Service after December 31, 1986 MACRS Class % First Recovery Year 16.67 10.00 7.14 5.00 3.33 2.50 Other Recovery Years Years % 2-3 2-5 2-7 2-10 2-15 3-year 5-year 7-year 10-year 15-year 20-year Note: The last two rows are used for qualified improvement property (15-year normal MACRS; 20-year ADS). 33.33 2-20 20.00 14.29 10.00 Last Recovery Year Year % 6.67 5.00 4 6 8 11 16 21 16.67 10.00 7.14 5.00 3.33 2.50 Exhibit 5.8 ADS for Alternative Minimum Tax: 150% Declining-Balance for Personal Property Assuming Half-Year Convention (Percentage Rates) For Property Placed in Service after December 31, 1986 (Partial Table*) 5-Year 9.5-Year 150% 150% Recovery Year 1 2 495 AWN 3 4 6 8 9 10 11 12 13 3-Year 150% 25.00 37.50 25.00** 12.50 15.00 25.50 17.85 16.66** 16.66 8.33 7-Year 150% 10.71 19.13 15.03 12.25** 12.25 12.25 12.25 6.13 7.89 14.54 12.25 10.31 9.17** 9.17 9.17 9.17 9.17 9.16 10-Year 150% 7.50 13.88 11.79 10.02 8.74** 8.74 8.74 8.74 8.74 8.74 4.37 12-Year 150% 6.25 11.72 10.25 8.97 7.85 7.33*** 7.33 7.33 7.33 7.33 7.32 7.33 3.66 * The figures in this table are taken from the official table that appears in Rev.Proc. 87-57, 1987-2 C.B. 687. Because of its length, the complete table is not presented. **Switchover to straight-line depreciation. Exhibit 5.10 ADS Straight-Line for Real Property Assuming Mid-Month Convention (Percentage Rates) For Property Placed in Service after December 31, 2017; 30-Year Residential Rental Property Month Placed in Service 6 7 1.806 1.528 3.333 3.333 1.528 1.806 2.083 Recovery Year 1 2-30 31 Recovery Year 1 3 4 2 3.194 2.917 3.333 3.333 0.139 0.417 0.694 0.972 1.250 5 2.639 2.361 2.083 3.333 3.333 3.333 For Property Placed in Service after December 31, 1986; 40-Year Nonresidential Real Property* 1 5 2 3 2.396 2.188 1.979 2.500 2.500 2.500 4 1.771 1.563 2.500 2.500 Month Placed in Service 7 1.146 2.500 6 1.354 2.500 0.104 0.312 0.521 0.729 0.937 1.146 1.354 1.562 1 2-40 41 8 9 1.250 0.972 3.333 3.333 3.333 2.361 2.639 9 8 0.938 2.500 2.500 0.729 1.771 10 11 12 0.694 0.417 0.139 3.333 2.917 3.333 3.194 * Also used for residential rental property placed in service before 2018. 10 0,521 2.500 1.979 12 11 0.313 0.104 2.500 2.500 2.187 2.396 + Lopez acquired a building on June 1, 2015, for $8,284,900. Compute the depreciation deduction assuming the building is classified as (a) residential and (b) non residential. Click here to access the depreciation table to use for this problem. If required, round your answers to the nearest dollar. a. Calculate Lopez's cost recovery deduction for 2020 if the building is classified as residential rental real estate. $ b. Calculate Lopez's cost recovery deduction for 2020 if the building is classified as nonresidential real estate. Exhibit 5.5 For Property Placed in Service after December 31, 1986 (Partial Table * ) 3-Year Recovery Year First Quarter Second Quarter Third Quarter Fourth Quarter 58.33 27.78 1 2 MACRS Accelerated Depreciation for Personal Property Assuming Mid-Quarter Convention (Percentage Rates) Recovery Year 1 2 Recovery Year 1 2 First Quarter 35.00 26.00 First Quarter 25.00 21.43 41.67 38.89 5-Year Second Quarter 25.00 30.00 7-Year Second Quarter 17.85 23.47 25.00 50.00 Third Quarter 15.00 34.00 Third Quarter 10.71 25.51 8.33 61.11 Fourth Quarter 5.00 38.00 Fourth Quarter 3.57 27.55 Exhibit 5.6 MACRS Straight-Line Depreciation for Real Property Assuming Mid-Month Convention* For Property Placed in Service after December 31, 1986: 27.5-Year Residential Real Property Recovery Year(s) 1 2-18 19-27 28 29 Recovery Year(s) 1 2-19 20-31 32 33 6 8 10 11 12 For Property Placed in Service after December 31, 1986, and before May 13, 1993: 31.5-Year Nonresidential Real Property The Applicable Percentage Is (Use the Column for the Month in the First Year the Property Is Placed in Service): 1 2 3 4 7 3.042 2.778 2.513 2.249 3.175 3.175 3.175 3.175 3.174 3.174 3.174 3.174 1.720 0.000 5 9 1.984 1.720 1.455 1.190 0.926 3.175 3.175 3.175 3.175 3.175 3.174 3.174 3.174 3.174 3.174 2.778 3.042 3.175 3.175 3.175 0.000 0.000 0.132 0.397 1.984 2.249 2.513 0.000 0.000 0.000 0.661 The Applicable Percentage Is (Use the Column for the Month in the First Year the Property Is Placed in Service): 1 2 3 4 5 6 8 9 10 11 12 7 3.182 2.879 2.576 2.273 1.970 1.667 1.364 3.636 3.636 3.636 3.636 3.636 3.636 3.636 3.637 3.637 3.637 3.637 3.637 3.637 3.637 2.273 2.576 2.879 3.182 3.485 3.636 3.636 3.636 0.000 0.000 0.000 0.000 0.000 0.152 0.455 0.758 1.061 0.758 3.636 3.636 3.637 3.637 3.637 Recovery Year(s) 3.485 3.636 3.637 1.970 0.000 For Property Placed in Service after May 12, 1993: 39-Year Nonresidential Real Property 1 2-39 40 0.152 3.636 3.637 3.636 3.636 3.636 1.061 1.364 1.667 0.455 3.636 2.461 2.564 0.107 0.661 3.175 3.174 3.174 3.175 3.175 0.926 1.190 0.397 3.175 0.963 0.749 0.535 2.564 2.564 2.564 1.605 1.819 5 8 9 10 11 12 The Applicable Percentage Is (Use the Column for the Month in the First Year the Property Is Placed in Service): 1 2 3 4 6 7 2.247 2.033 1.819 1.605 1.391 1.177 2.564 2.564 2.564 2.564 2.564 2.564 0.321 0.535 0.749 0.963 1.177 1.391 0.321 2.564 2.033 2.247 0.132 3.175 3.174 3.175 1.455 0.107 2.564 2.461 + *The official tables contain a separate row for each year. For ease of presentation, certain years are grouped in these tables. In some instances, this will produce a difference of 0.001 for the last digit when compared with the official tables. Exhibit 5.7 MACRS Straight-Line Depreciation for Personal Property and Qualified Improvement Property Assuming Half-Year Convention * For Property Placed in Service after December 31, 1986 MACRS Class % First Recovery Year 16.67 10.00 7.14 5.00 3.33 2.50 Other Recovery Years Years % 2-3 2-5 2-7 2-10 2-15 3-year 5-year 7-year 10-year 15-year 20-year Note: The last two rows are used for qualified improvement property (15-year normal MACRS; 20-year ADS). 33.33 2-20 20.00 14.29 10.00 Last Recovery Year Year % 6.67 5.00 4 6 8 11 16 21 16.67 10.00 7.14 5.00 3.33 2.50 Exhibit 5.8 ADS for Alternative Minimum Tax: 150% Declining-Balance for Personal Property Assuming Half-Year Convention (Percentage Rates) For Property Placed in Service after December 31, 1986 (Partial Table*) 5-Year 9.5-Year 150% 150% Recovery Year 1 2 495 AWN 3 4 6 8 9 10 11 12 13 3-Year 150% 25.00 37.50 25.00** 12.50 15.00 25.50 17.85 16.66** 16.66 8.33 7-Year 150% 10.71 19.13 15.03 12.25** 12.25 12.25 12.25 6.13 7.89 14.54 12.25 10.31 9.17** 9.17 9.17 9.17 9.17 9.16 10-Year 150% 7.50 13.88 11.79 10.02 8.74** 8.74 8.74 8.74 8.74 8.74 4.37 12-Year 150% 6.25 11.72 10.25 8.97 7.85 7.33*** 7.33 7.33 7.33 7.33 7.32 7.33 3.66 * The figures in this table are taken from the official table that appears in Rev.Proc. 87-57, 1987-2 C.B. 687. Because of its length, the complete table is not presented. **Switchover to straight-line depreciation. Exhibit 5.10 ADS Straight-Line for Real Property Assuming Mid-Month Convention (Percentage Rates) For Property Placed in Service after December 31, 2017; 30-Year Residential Rental Property Month Placed in Service 6 7 1.806 1.528 3.333 3.333 1.528 1.806 2.083 Recovery Year 1 2-30 31 Recovery Year 1 3 4 2 3.194 2.917 3.333 3.333 0.139 0.417 0.694 0.972 1.250 5 2.639 2.361 2.083 3.333 3.333 3.333 For Property Placed in Service after December 31, 1986; 40-Year Nonresidential Real Property* 1 5 2 3 2.396 2.188 1.979 2.500 2.500 2.500 4 1.771 1.563 2.500 2.500 Month Placed in Service 7 1.146 2.500 6 1.354 2.500 0.104 0.312 0.521 0.729 0.937 1.146 1.354 1.562 1 2-40 41 8 9 1.250 0.972 3.333 3.333 3.333 2.361 2.639 9 8 0.938 2.500 2.500 0.729 1.771 10 11 12 0.694 0.417 0.139 3.333 2.917 3.333 3.194 * Also used for residential rental property placed in service before 2018. 10 0,521 2.500 1.979 12 11 0.313 0.104 2.500 2.500 2.187 2.396 +
Expert Answer:
Answer rating: 100% (QA)
Solution Requirement Answer a b 30123896 21242484 Calculatio... View the full answer

Related Book For 
South Western Federal Taxation 2017 Essentials Of Taxation Individuals And Business Entities
ISBN: 9780357109144
20th Edition
Authors: William A. Raabe, David M. Maloney, James C. Young, Annette Nellen
Posted Date:
Students also viewed these accounting questions
-
The following additional information is available for the Dr. Ivan and Irene Incisor family from Chapters 1-5. Ivan's grandfather died and left a portfolio of municipal bonds. In 2012, they pay Ivan...
-
The following additional information is available for the Dr. Ivan and Irene Incisor family from Chapters 1-6. On December 12, Irene purchased the building where her store is located. She paid...
-
Hamlet acquires a 7-year class asset on November 23, 2021, for $382,200 (the only asset acquired during the year). Hamlet does not elect immediate expensing under 179. He does not claim any...
-
Draw the BST that results when you insert the keys E A S Y QUE S T I O N in that order into an initially empty tree. What is the height of the resulting BST?
-
Dolphin Company manufactures two- person sailboats with a variable cost of $ 1,000. The sailboats sell for $ 1,750 each. Budgeted fixed manufacturing overhead for the most recent year was $...
-
It is desired to reduce the pyridine concentration of \(5000 \mathrm{~kg} / \mathrm{h}\) of an aqueous solution from \(50 \mathrm{wt} \%\) to \(5 \mathrm{wt} \%\) in a single batch extraction with...
-
Following are selected questions from an internal control questionnaire about a companys fixed asset records, additions, disposals, retirements, and depreciation functions. A yes response would...
-
Cranergy Products is a cranberry cooperative that operates two divisions, a harvesting division and a processing division. Currently, all of harvestings output is converted into cranberry juice by...
-
Top managers of Movies are Best are alarmed by their operating losses. They are considering dropping the DVD product line. Company accountants have prepared the following analysis to help make this...
-
San Francisco led the movement to ban plastic shopping bags and is now proposing to ensure people have access to safe high-quality tap water and ban bottled water. A supporter of the ban says The...
-
Teal Mountain Inc. is using a discounted cash flow model. Scenario 1: Cash flows are fairly certain Scenario 2: Cash flows are uncertain $ 160/year for 5 years 75% probability that cash flows will be...
-
Distinguish the roles played by liner shipping companies and terminal operators in LSCM.
-
What are the different types of bushes? Discuss its applications in engineering.
-
Products being returned back to the producer when they are defective is considered inbound logistics. a) True b) False
-
What is fourth-party logistics (4PL) and how has the concept evolved in recent years?
-
Explain the different types of ball bearings used in the industry.
-
Partners of a partnership: O are entitled to income of the partnership, which must be reported on their individual federal income tax returns. are not permitted to deduct partnership losses on their...
-
The Adjusted Trial Balance columns of a 10-column work sheet for Webber Co. follow. Complete the work sheet by extending the account balances into the appropriate financial statement columns and by...
-
Find Kathryn Bernal, 120 T.C. 102 (2003), and answer the following questions. a. What was the docket number? b. When was the dispute filed? c. Who is the respondent? d. Who was the attorney for the...
-
Paul and Sonja, who are married, had itemized deductions of $8,200 and $400, respectively, during 2016. Paul suggests that they file separately-he will itemize his deductions from AGI, and she will...
-
For tax year 2016, determine the number of personal and dependency exemptions in each of the following independent situations: a. Leo and Amanda (ages 48 and 46, respectively) are husband and wife...
-
Let \(X\) be a continuous random variable having probability density function \[f(x)= \begin{cases}2 e^{-2 x} & \text { for } x>0 \\ 0 & \text { elsewhere }\end{cases}\] (a) Find the moment...
-
Let \(X\) and \(Y\) be independent normal random variables with \[\begin{array}{lll}E(X)=4 & \text { and } & \sigma_{X}^{2}=25 \\E(Y)=3 & \text { and } & \sigma_{Y}^{2}=16\end{array}\] (a) Use moment...
-
Let \(X\) have the geometric distribution \[f(x)=p(1-p)^{x-1} \quad \text { for } x=1,2, \ldots\] (a) Obtain the moment generating function for \[t

Study smarter with the SolutionInn App