

In the last quarter of the 19th century new technologies (electricity, oil, cars), called Second Industrial...
Fantastic news! We've Found the answer you've been seeking!
Question:
Transcribed Image Text:
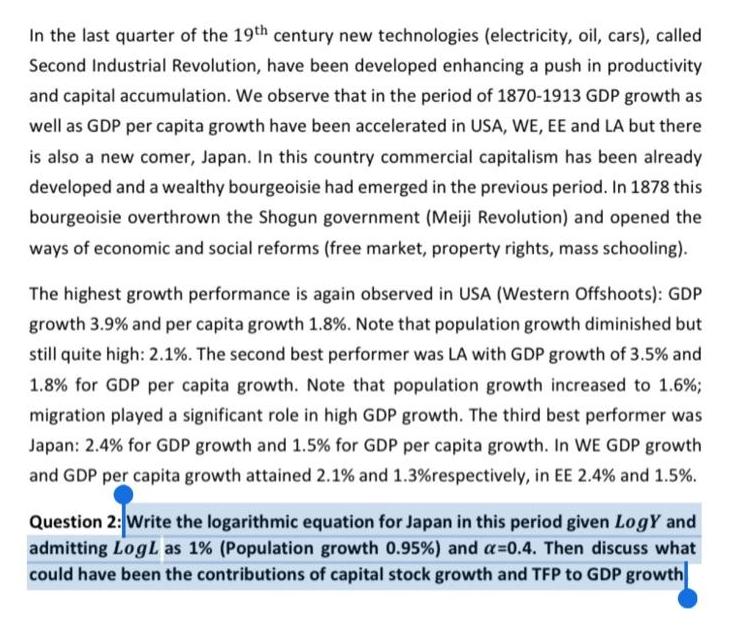
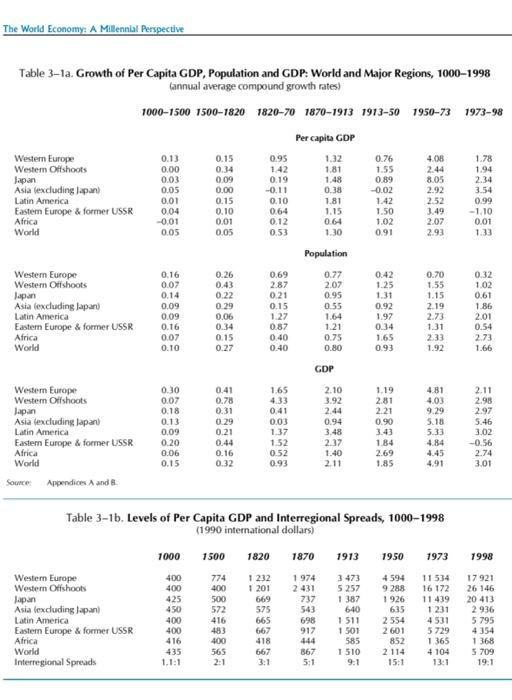
In the last quarter of the 19th century new technologies (electricity, oil, cars), called Second Industrial Revolution, have been developed enhancing a push in productivity and capital accumulation. We observe that in the period of 1870-1913 GDP growth as well as GDP per capita growth have been accelerated in USA, WE, EE and LA but there is also a new comer, Japan. In this country commercial capitalism has been already developed and a wealthy bourgeoisie had emerged in the previous period. In 1878 this bourgeoisie overthrown the Shogun government (Meiji Revolution) and opened the ways of economic and social reforms (free market, property rights, mass schooling). The highest growth performance is again observed in USA (Western Offshoots): GDP growth 3.9% and per capita growth 1.8%. Note that population growth diminished but still quite high: 2.1%. The second best performer was LA with GDP growth of 3.5% and 1.8% for GDP per capita growth. Note that population growth increased to 1.6%; migration played a significant role in high GDP growth. The third best performer was Japan: 2.4% for GDP growth and 1.5% for GDP per capita growth. In WE GDP growth and GDP per capita growth attained 2.1% and 1.3 % respectively, in EE 2.4% and 1.5%. Question 2: Write the logarithmic equation for Japan in this period given Logy and admitting LogL as 1% (Population growth 0.95%) and a=0.4. Then discuss what could have been the contributions of capital stock growth and TFP to GDP growth The World Economy: A Millennial Perspective Table 3-1a. Growth of Per Capita GDP, Population and GDP: World and Major Regions, 1000-1998 (annual average compound growth rates) 1000-1500 1500-1820 1820-70 1870-1913 1913-50 1950-73 1973-98 Western Europe Western Offshoots Japan Asia (excluding Japan) Latin America Eastern Europe & former USSR Africa World Western Europe Western Offshoots Japan Asia (excluding Japan) Latin America Eastern Europe & former USSR Africa World Western Europe Western Offshoots Japan Asia (excluding Japan) Latin America Eastern Europe & former USSR Africa World Source: Appendices A and B Western Europe Western Offshoots Japan Asia (excluding Japan) Latin America 0.13 0.00 0.03 0.05 0.01 Eastern Europe & former USSR Africa World Interregional Spreads 0.04 -0.01 0.05 0.16 0.07 0.14 0.09 0.09 0.16 0.07 0.10 0.30 0.07 0.18 0.13 0.09 0.20 0.06 0.15 1000 400 400 425 450 400 0.15 0.34 0.09 0.00 0.15 0.10 0.01 0.05 400 416 435 1.1:1 0.26 0.43 0.22 0.29 0.06 0.34 0.15 0.27 0.41 0.78 0.31 0.29 0.21 0.44 0.16 0.32 0.95 1.42 0.19 -0.11 774 400 500 572 416 483 400 565 2:1 0.10 0.64 1500 1820 0.12 0.53 0.69 2.87 0.21 0.15 1.27 0.87 0.40 0.40 1.65 4.33 0.41 0.03 1.37 1.52 0.52 0.93 1 232 1 201 669 575 665 Per capita GDP 667 418 667 Population 0.77 2.07 1870 GDP 1974 2431 1.32 1,81 1.48 0.38 1.81 1.15 0.64 1.30 737 543 698 917 444 0.95 0.55 1.64 1.21 0.75 0.80 867 5:1 2.10 3.92 2.44 Table 3-1b. Levels of Per Capita GDP and Interregional Spreads, 1000-1998 (1990 international dollars) 0.94 3.48 2.37 1.40 2.11 1 387 640 1 511 1501 0.76 1.55 0.89 585 -0.02 1.42 1 510 9:1 1.50 1.02 0.91 0.42 1.25 1.31 0.92 1.97 0.34 1.65 0.93 1913 1950 3:473 5 257 1.19 2.81 2.21 0.90 3.43 1.84 2.69 1.85 4.08 2.44 8.05 2.92 2.52 3.49 2.07 2.93 2114 15:1 0.70 1.55 1.15 2.19 2.73 1.31 2.33 1.92 4.81 4.03 9.29 5.18 5.33 4.84 4.45 4.91 1973 11-534 16 172 11 439 1231 4 594 9288 1926 635 2554 4531 2601 5729 852 1.365 4104 13:1 1.78 1.94 2.34 3.54 0.99 -1.10 0.01 1.33 0.32 1.02 0.61 1.86 2.01 0.54 2.73 1.66 2.11 2.98 2.97 5.46 3.02 -0.56 2.74 3.01 1998 17921 26 146 20 413 2.936 5 795 4354 1368 5.709 19:1 In the last quarter of the 19th century new technologies (electricity, oil, cars), called Second Industrial Revolution, have been developed enhancing a push in productivity and capital accumulation. We observe that in the period of 1870-1913 GDP growth as well as GDP per capita growth have been accelerated in USA, WE, EE and LA but there is also a new comer, Japan. In this country commercial capitalism has been already developed and a wealthy bourgeoisie had emerged in the previous period. In 1878 this bourgeoisie overthrown the Shogun government (Meiji Revolution) and opened the ways of economic and social reforms (free market, property rights, mass schooling). The highest growth performance is again observed in USA (Western Offshoots): GDP growth 3.9% and per capita growth 1.8%. Note that population growth diminished but still quite high: 2.1%. The second best performer was LA with GDP growth of 3.5% and 1.8% for GDP per capita growth. Note that population growth increased to 1.6%; migration played a significant role in high GDP growth. The third best performer was Japan: 2.4% for GDP growth and 1.5% for GDP per capita growth. In WE GDP growth and GDP per capita growth attained 2.1% and 1.3 % respectively, in EE 2.4% and 1.5%. Question 2: Write the logarithmic equation for Japan in this period given Logy and admitting LogL as 1% (Population growth 0.95%) and a=0.4. Then discuss what could have been the contributions of capital stock growth and TFP to GDP growth The World Economy: A Millennial Perspective Table 3-1a. Growth of Per Capita GDP, Population and GDP: World and Major Regions, 1000-1998 (annual average compound growth rates) 1000-1500 1500-1820 1820-70 1870-1913 1913-50 1950-73 1973-98 Western Europe Western Offshoots Japan Asia (excluding Japan) Latin America Eastern Europe & former USSR Africa World Western Europe Western Offshoots Japan Asia (excluding Japan) Latin America Eastern Europe & former USSR Africa World Western Europe Western Offshoots Japan Asia (excluding Japan) Latin America Eastern Europe & former USSR Africa World Source: Appendices A and B Western Europe Western Offshoots Japan Asia (excluding Japan) Latin America 0.13 0.00 0.03 0.05 0.01 Eastern Europe & former USSR Africa World Interregional Spreads 0.04 -0.01 0.05 0.16 0.07 0.14 0.09 0.09 0.16 0.07 0.10 0.30 0.07 0.18 0.13 0.09 0.20 0.06 0.15 1000 400 400 425 450 400 0.15 0.34 0.09 0.00 0.15 0.10 0.01 0.05 400 416 435 1.1:1 0.26 0.43 0.22 0.29 0.06 0.34 0.15 0.27 0.41 0.78 0.31 0.29 0.21 0.44 0.16 0.32 0.95 1.42 0.19 -0.11 774 400 500 572 416 483 400 565 2:1 0.10 0.64 1500 1820 0.12 0.53 0.69 2.87 0.21 0.15 1.27 0.87 0.40 0.40 1.65 4.33 0.41 0.03 1.37 1.52 0.52 0.93 1 232 1 201 669 575 665 Per capita GDP 667 418 667 Population 0.77 2.07 1870 GDP 1974 2431 1.32 1,81 1.48 0.38 1.81 1.15 0.64 1.30 737 543 698 917 444 0.95 0.55 1.64 1.21 0.75 0.80 867 5:1 2.10 3.92 2.44 Table 3-1b. Levels of Per Capita GDP and Interregional Spreads, 1000-1998 (1990 international dollars) 0.94 3.48 2.37 1.40 2.11 1 387 640 1 511 1501 0.76 1.55 0.89 585 -0.02 1.42 1 510 9:1 1.50 1.02 0.91 0.42 1.25 1.31 0.92 1.97 0.34 1.65 0.93 1913 1950 3:473 5 257 1.19 2.81 2.21 0.90 3.43 1.84 2.69 1.85 4.08 2.44 8.05 2.92 2.52 3.49 2.07 2.93 2114 15:1 0.70 1.55 1.15 2.19 2.73 1.31 2.33 1.92 4.81 4.03 9.29 5.18 5.33 4.84 4.45 4.91 1973 11-534 16 172 11 439 1231 4 594 9288 1926 635 2554 4531 2601 5729 852 1.365 4104 13:1 1.78 1.94 2.34 3.54 0.99 -1.10 0.01 1.33 0.32 1.02 0.61 1.86 2.01 0.54 2.73 1.66 2.11 2.98 2.97 5.46 3.02 -0.56 2.74 3.01 1998 17921 26 146 20 413 2.936 5 795 4354 1368 5.709 19:1
Expert Answer:
Answer rating: 100% (QA)
The logarithmic equation for Japan in this period given LogY is LogY LogK aLogA 1aLogL LogTFP where ... View the full answer

Related Book For 

Advanced Accounting
ISBN: 978-0078025402
11th edition
Authors: Joe Ben Hoyle, Thomas Schaefer, Timothy Doupnik
Posted Date:
Students also viewed these accounting questions
-
A machine is purchased at the beginning of 2013 for $38,400. Its estimated life is eight years. Freight costs on the machine are $3,000. Installation costs are $1,600. The machine is estimated to...
-
Evaluate (n-1)! for n = 8. (n-1)! = for n = 8. (Simplify your answer.) s
-
Ramshare Company acquired equipment at the beginning of 2013 at a cost of $100,000. The equipment has a five-year life with no expected salvage value and is depreciated on a straight line basis. At...
-
You are the manager of a local coffee shop. There are two types of customers in your market, coffee addicts, and casual drinkers. Because coffee addicts buy large amounts of coffee, they are more...
-
How does perfect competition compare to oligopoly with respect to price, profit in the long run, average total cost, and output?
-
What are nominal, real and personal accounts? Give four examples of each of them.
-
The following MINITAB output presents a multiple regression equation y = b0 + b1x1 + b2x2 + b3x3 + b4x4. It is desired to drop one of the explanatory variables. Which of the following is the most...
-
In this exercise, you will complete the Property Tax application that you created in Exercise 3 in Chapter 2. a. Use Windows to copy the Tax Solution folder from the VB2017\Chap02 folder to the...
-
Wardell Company purchased a mini computer on January 1, 2022, at a cost of $32,350. The computer has been depreciated using the straight-line method over an estimated five-year useful life with an...
-
Compute P(E=Good) Compute P(S=Yes, H=Yes) Compute P(N=No, S=Yes, H=No, E=Good) (1) (2) (3) (4) (5) Compute P(E=Good|N=Yes) Compute P(E=Bad|S=No) P(N=Yes) P(N=No) 0.8 0.2 P(S=Yes) P(S=No) Party Last...
-
Review the balance sheet and accounts data provided in the 'Materials', 'Part 2'. Analyse the financial performance of the company and its ability to createe and capture value. ...
-
Your department has a reoccurring problem with receiving materials on time and the reasons are various. The only way to identify what is causing this problem is to examine the shipping paperwork each...
-
Titleist Inc produces two types of golf balls for the retail consumer. They want to know which golf ball produces the greatest profit and they want to maintain at least $1.50 of profit per golf ball,...
-
Identify and evaluate the components of a comprehensive total rewards and motivation system? Illustrate with specific examples.
-
What type of approach is most commonly used for procedures on the digestive organs? Explain why that approach is used.
-
Discuss the cultural differences between China and the United States. What would be the biggest adjustments I might need to make if working there as an expatriate? What are the most...
-
Let S = {s 1 , s 2 , s 3 , s 4 , s 5 , s 6 } be the sample space associated with an experiment having the probability distribution shown in the accompanying table. If A = {s 1 , s 2 } and B = {s 1 ,...
-
A company pledges their receivables so they may Multiple Choice Charge a factoring fee. Increase sales. Recognize a sale. Collect a pledge fee. Borrow money. Failure by a promissory notes' maker to...
-
Bracy Company acquired a new piece of construction equipment on January 1, 2013, at a cost of $100,000. The equipment was expected to have a useful life of 10 years and a residual value of $20,000...
-
The Coca-Cola Company is organized geographically and defines reportable operating segments as regions of the world. The following information was extracted from Note 19 Operating Segments in the...
-
What is the net impact on Werner's net income for the quarter ended June 30, 2013, as a result of this forward contract hedge of a firm commitment? a. $ -0-. b. $59,000 increase in net income. c....
-
Electronic devices contain electric circuits etched into wafers made of silicon. These silicon wafers are sealed with an ultrathin layer of silicon dioxide, in a process known as oxidation. This can...
-
Fill in the blank: If large values of one variable are associated with small values of another, then the two variables have a _______________________ association.
-
For each of the following scatterplots, state the type of association that is exhibited: Choices: positive linear, negative linear, positive nonlinear, negative nonlinear, weak linear. b. d. e.

Study smarter with the SolutionInn App