

Measures of Risk (2.1) Consider the following two random variables: X has a (continuous) uni- form...
Fantastic news! We've Found the answer you've been seeking!
Question:
Transcribed Image Text:
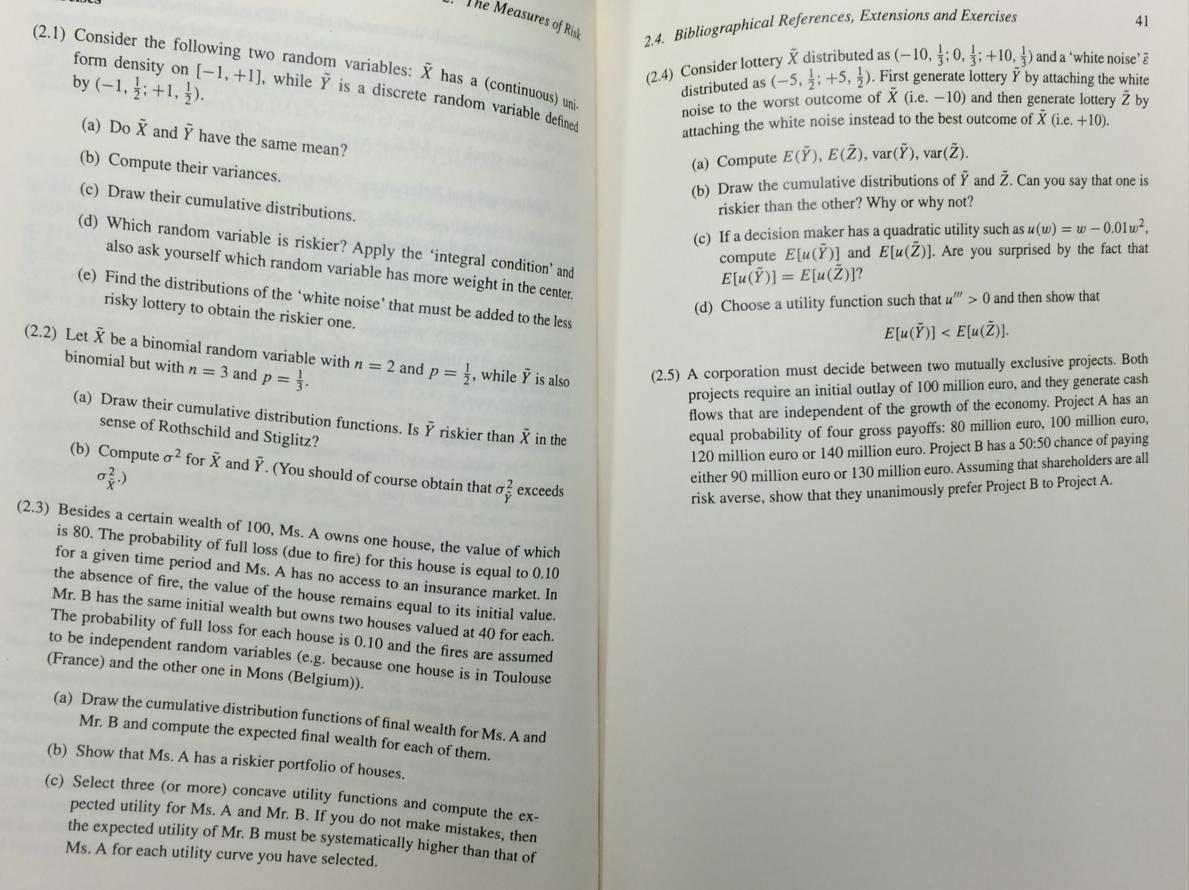
Measures of Risk (2.1) Consider the following two random variables: X has a (continuous) uni- form density on [-1, +1], while Y is a discrete random variable defined by (-1,1; +1,1). (a) Do X and Y have the same mean? (b) Compute their variances. (c) Draw their cumulative distributions. (d) Which random variable is riskier? Apply the 'integral condition' and also ask yourself which random variable has more weight in the center. (e) Find the distributions of the 'white noise' that must be added to the less risky lottery to obtain the riskier one. (2.2) Let X be a binomial random variable with n = 2 and p = 1, while Y is also binomial but with n = 3 and p = 1. (a) Draw their cumulative distribution functions. Is Y riskier than X in the sense of Rothschild and Stiglitz? (b) Compute o² for X and Y. (You should of course obtain that o exceeds (2.3) Besides a certain wealth of 100, Ms. A owns one house, the value of which is 80. The probability of full loss (due to fire) for this house is equal to 0.10 for a given time period and Ms. A has no access to an insurance market. In the absence of fire, the value of the house remains equal to Mr. B has the same initial wealth but owns two houses valued at 40 for each. The probability of full loss for each house is 0.10 and the fires are assumed initial value. to be independent random variables (e.g. because one house is in Toulouse (France) and the other one in Mons (Belgium)). (a) Draw the cumulative distribution functions of final wealth for Ms. A and Mr. B and compute the expected final wealth for each of them. (b) Show that Ms. A has a riskier portfolio of houses. (c) Select three (or more) concave utility functions and compute the ex- pected utility for Ms. A and Mr. B. If you do not make mistakes, then the expected utility of Mr. B must be systematically higher than that of Ms. A for each utility curve you have selected. 2.4. Bibliographical References, Extensions and Exercises (2.4) Consider lottery X distributed as (-10, 0, +10,) and a 'white noise' è distributed as (-5, +5,3). First generate lottery Y by attaching the white noise to the worst outcome of X (i.e. -10) and then generate lottery 2 by attaching the white noise instead to the best outcome of X (i.e. +10). (a) Compute E(Y), E (Ž), var(Ž), var(Ž). (b) Draw the cumulative distributions of Y and Ž. Can you say that one is riskier than the other? Why or why not? 41 (c) If a decision maker has a quadratic utility such as u(w) = w-0.01w², compute E[u(Y)] and E[u(2)]. Are you surprised by the fact that E[u(Y)] = E[u(Ž)]? (d) Choose a utility function such that u"> 0 and then show that E[u(Y)] < E[u(Ž)]. (2.5) A corporation must decide between two mutually exclusive projects. Both projects require an initial outlay of 100 million euro, and they generate cash flows that are independent of the growth of the economy. Project A has an equal probability of four gross payoffs: 80 million euro, 100 million euro, 120 million euro or 140 million euro. Project B has a 50:50 chance of paying either 90 million euro or 130 million euro. Assuming that shareholders are all risk averse, show that they unanimously prefer Project B to Project A. Measures of Risk (2.1) Consider the following two random variables: X has a (continuous) uni- form density on [-1, +1], while Y is a discrete random variable defined by (-1,1; +1,1). (a) Do X and Y have the same mean? (b) Compute their variances. (c) Draw their cumulative distributions. (d) Which random variable is riskier? Apply the 'integral condition' and also ask yourself which random variable has more weight in the center. (e) Find the distributions of the 'white noise' that must be added to the less risky lottery to obtain the riskier one. (2.2) Let X be a binomial random variable with n = 2 and p = 1, while Y is also binomial but with n = 3 and p = 1. (a) Draw their cumulative distribution functions. Is Y riskier than X in the sense of Rothschild and Stiglitz? (b) Compute o² for X and Y. (You should of course obtain that o exceeds (2.3) Besides a certain wealth of 100, Ms. A owns one house, the value of which is 80. The probability of full loss (due to fire) for this house is equal to 0.10 for a given time period and Ms. A has no access to an insurance market. In the absence of fire, the value of the house remains equal to Mr. B has the same initial wealth but owns two houses valued at 40 for each. The probability of full loss for each house is 0.10 and the fires are assumed initial value. to be independent random variables (e.g. because one house is in Toulouse (France) and the other one in Mons (Belgium)). (a) Draw the cumulative distribution functions of final wealth for Ms. A and Mr. B and compute the expected final wealth for each of them. (b) Show that Ms. A has a riskier portfolio of houses. (c) Select three (or more) concave utility functions and compute the ex- pected utility for Ms. A and Mr. B. If you do not make mistakes, then the expected utility of Mr. B must be systematically higher than that of Ms. A for each utility curve you have selected. 2.4. Bibliographical References, Extensions and Exercises (2.4) Consider lottery X distributed as (-10, 0, +10,) and a 'white noise' è distributed as (-5, +5,3). First generate lottery Y by attaching the white noise to the worst outcome of X (i.e. -10) and then generate lottery 2 by attaching the white noise instead to the best outcome of X (i.e. +10). (a) Compute E(Y), E (Ž), var(Ž), var(Ž). (b) Draw the cumulative distributions of Y and Ž. Can you say that one is riskier than the other? Why or why not? 41 (c) If a decision maker has a quadratic utility such as u(w) = w-0.01w², compute E[u(Y)] and E[u(2)]. Are you surprised by the fact that E[u(Y)] = E[u(Ž)]? (d) Choose a utility function such that u"> 0 and then show that E[u(Y)] < E[u(Ž)]. (2.5) A corporation must decide between two mutually exclusive projects. Both projects require an initial outlay of 100 million euro, and they generate cash flows that are independent of the growth of the economy. Project A has an equal probability of four gross payoffs: 80 million euro, 100 million euro, 120 million euro or 140 million euro. Project B has a 50:50 chance of paying either 90 million euro or 130 million euro. Assuming that shareholders are all risk averse, show that they unanimously prefer Project B to Project A.
Expert Answer:
Answer rating: 100% (QA)
Answer a If A Uab then EA a b VarA 112ba In the given question a1 b1 Thu... View the full answer

Related Book For 
John E Freunds Mathematical Statistics With Applications
ISBN: 9780134995373
8th Edition
Authors: Irwin Miller, Marylees Miller
Posted Date:
Students also viewed these mathematics questions
-
Planning is one of the most important management functions in any business. A front office managers first step in planning should involve determine the departments goals. Planning also includes...
-
Consider two random variables X and Y whose joint probability density is given by Find the probability density of U = Y X by using Theorem 7.1 as modified on page 216. for x > 0,y > 0,x+y+2 f(x,y) =...
-
Consider two random variables X and Y with joint density fX,Y (x,y) = x/8 + y/8, for 0 < x < 2, 0 < y < 2 and fX,Y (x,y) = 0 otherwise. a. Are X and V independent? b. Find P(X > 1) and P(Y > 1). c....
-
1. Locate a current financial news article using a source such as the following: a. www.reuters.com; b. www.yahoo.com/finance; c. http://www.msn.com/en-us/money d. www.bloomberg.com 2. Use the...
-
Suppose Lufthansa buys $400 million worth of Boeing jets in 2010 and is financed by the U.S. Eximbank with a five year loan that has no principal or interest payments due until 2011. What is the net...
-
If you own 11,000 shares of stock of Nike and it pays a dividend of $0.29 per share, then what is the total dividend you will receive?
-
Contrast testing by (a) parallel simulation, (b) test data, and (c) integrated test facility.
-
Factory labor data for Dieker Company is given in BE20-2. During January, time tickets show that the factory labor of $6,000 was used as follows: Job 1 $2,200, Job 2 $1,600, Job 3 $1,400 and general...
-
After watching the video, please think about your own life. What way have you been classically conditioned? Think of any fears or other immediate emotional reactions you have had. Were they related...
-
W Complete the depreciation worksheet below. (Only number entries for all but Date Placed in Service) Prior Depreciation Years Description of Property Portable Building Espresso Machine 1 Espresso...
-
Prior to writing your program, use PowerPoint to draw a UML diagram of the class. An address has a house number, a street, an optional apartment number, a city, a state and a postal code. Define the...
-
Cash flow After deducting interest, tax and dividend payments, 467 million of operating cash flow was available to fund our capital investment programme, demonstrating BAAs continued strong...
-
The Financial Reporting Review Panel today announced that its review activity in 2010/11 will focus on the following sectors: Commercial property. Advertising. Recruitment. Media. Information...
-
The following technical terms appear for the first time in this chapter. Check that you know the meaning of each. (If you cant find them again in the text, there is a glossary at the end of the...
-
Employees as assets of a service business The following extracts are taken from the annual reports of two companies that rely heavily on a skilled workforce. Although the workforce is not recognized...
-
Shareholders funds as at 21 March 2009 were 4,376 million (2008: 4,935 million), a reduction of 559 million, primarily as a result of the deterioration of the pension surplus into a deficit, which...
-
Budgeted meals (a) Revenue ($3.80g) Expenses: Raw materials ($1.909) Wages and salaries ($6,100 $0.20g) Utilities ($1,800 + $0.05g) Facility rent ($3,900) Insurance ($2,700) Miscellaneous ($300 +...
-
Explain the Hawthorne effect.
-
A food processor wants to know whether the probability is really 0.60 that a customer will prefer a new kind of packaging to the old kind. If, in a random sample, 7 of 18 customers prefer the new...
-
If X has the distribution function Find (a) P(2 < X 6); (b) P(X = 4); (c) The probability distribution of X. 0 for x <1 for l x-4 for 6 10 1 for x10
-
If 1 and 2 are independent unbiased estimators of a given parameter and var(1) = 3 var(2), find the constants a1 and a2 such that a11 + a22 is an unbiased estimator with minimum variance for such a...
-
Use the code given earlier for R to make this plot. The command would be plot(percentage)
-
Why would you not feel comfortable computing a Pearson correlation on the data in Exercise 9.10? Exercise 9.10 Down syndrome is another problem that psychologists deal with. It has been proposed that...
-
In Exercise 9.1 the percentage of mothers over 40 does not appear to be important, and yet it is a risk factor in other societies. Why do you think that this might be? Exercise 9.1 In Sub-Saharan...

Study smarter with the SolutionInn App