

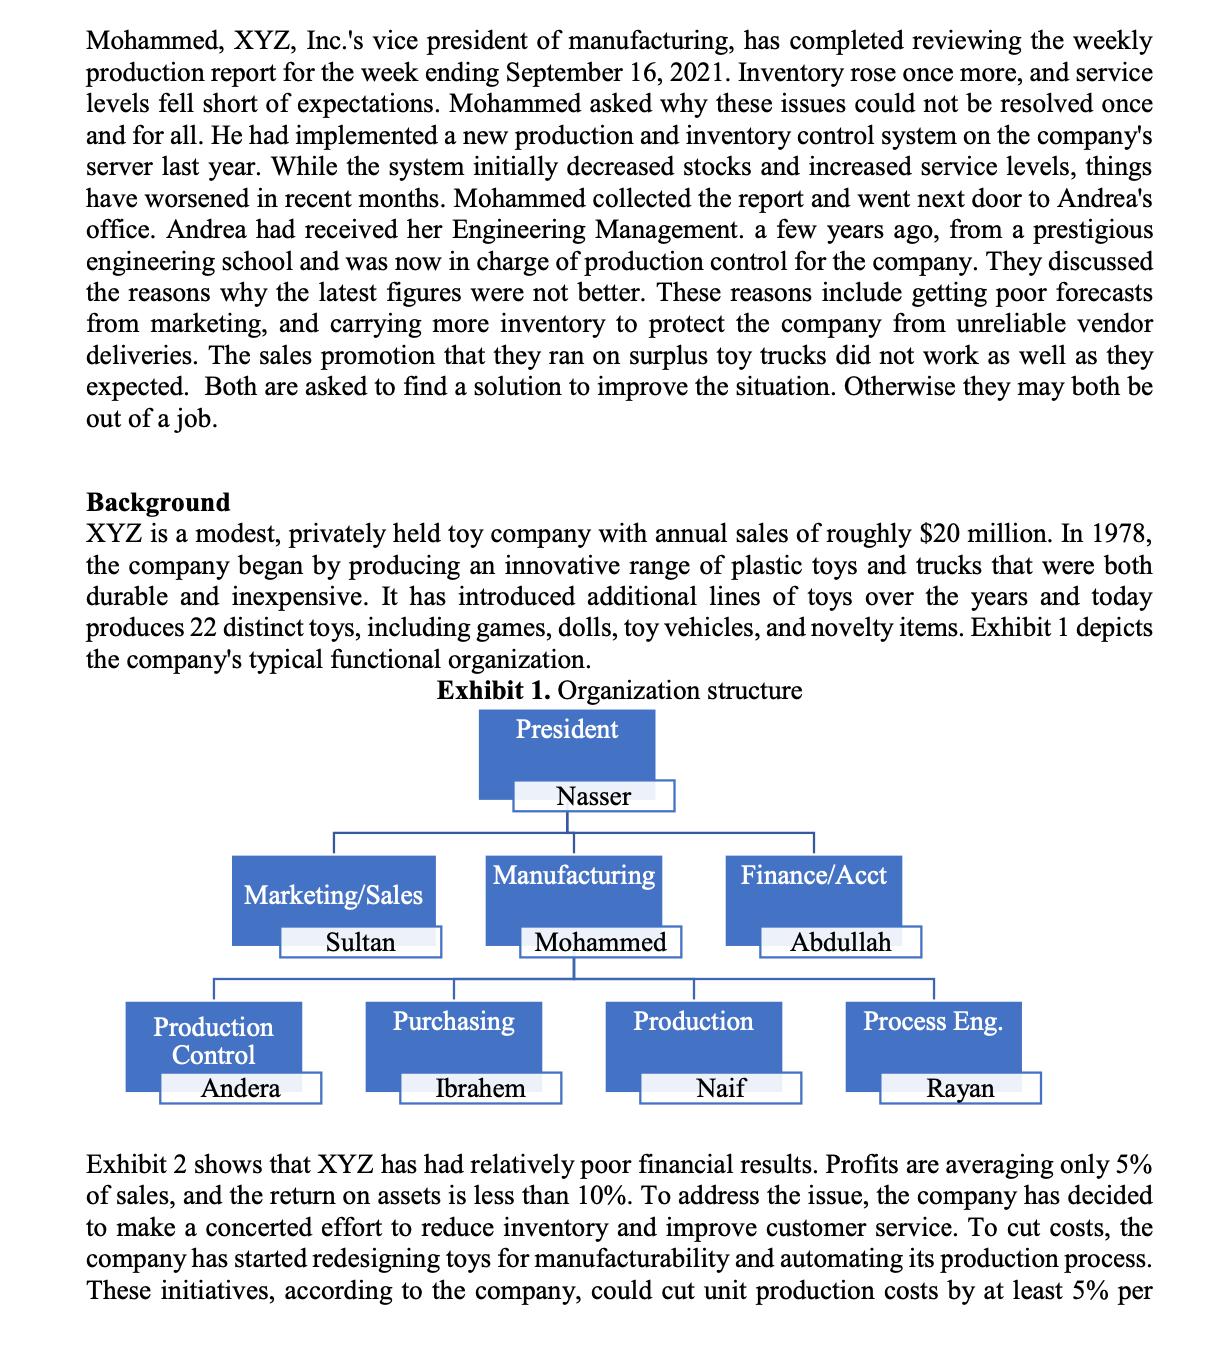
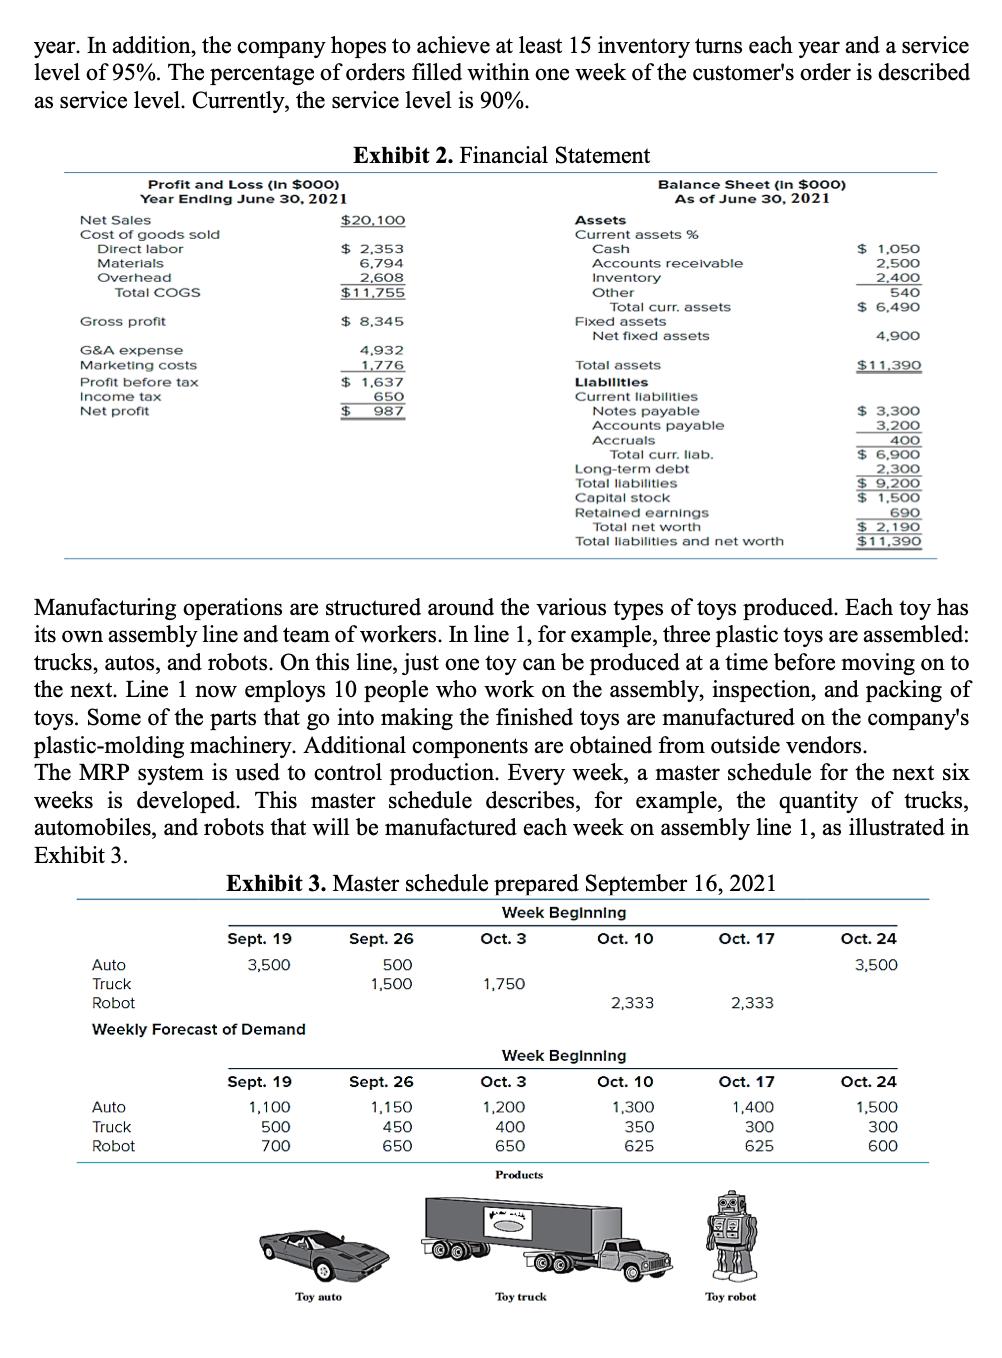
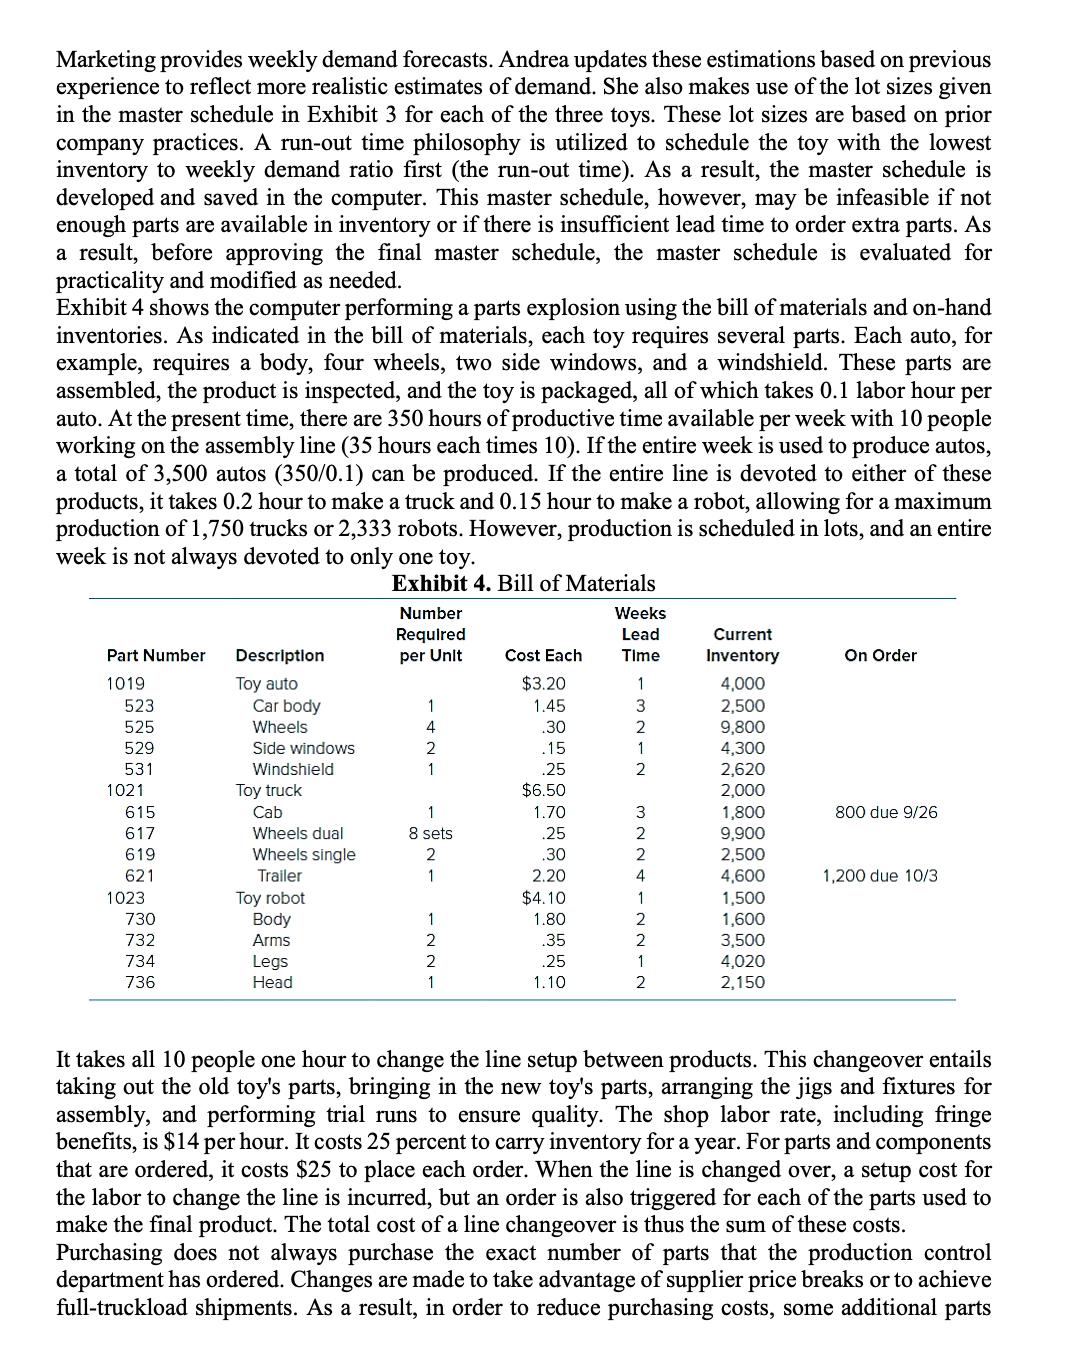
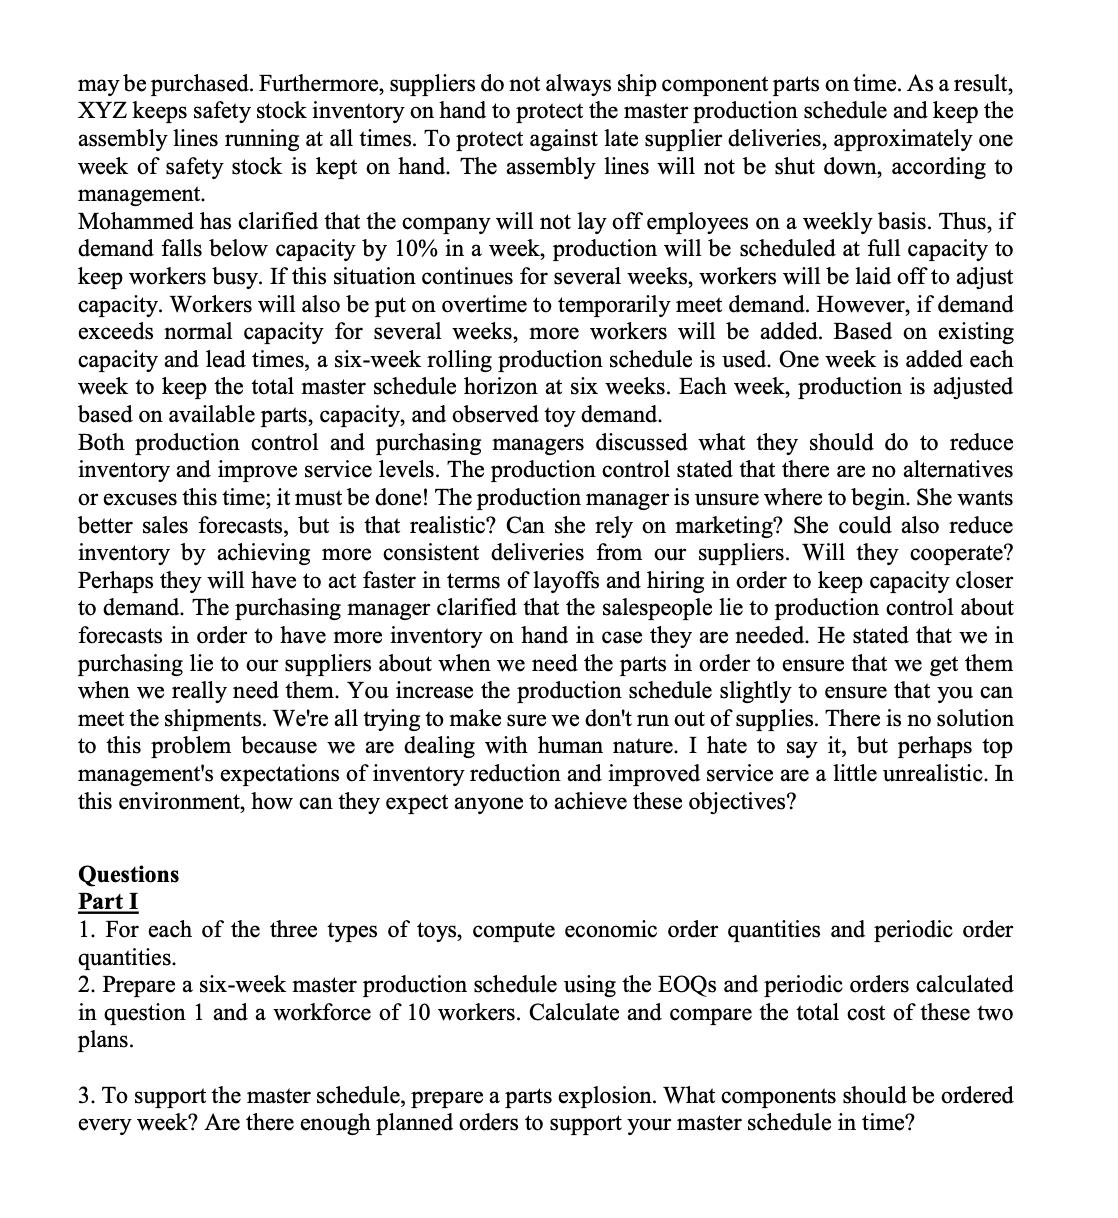
Mohammed, XYZ, Inc.'s vice president of manufacturing, has completed reviewing the weekly production report for the...
Fantastic news! We've Found the answer you've been seeking!
Question:
Transcribed Image Text:
Mohammed, XYZ, Inc.'s vice president of manufacturing, has completed reviewing the weekly production report for the week ending September 16, 2021. Inventory rose once more, and service levels fell short of expectations. Mohammed asked why these issues could not be resolved once and for all. He had implemented a new production and inventory control system on the company's server last year. While the system initially decreased stocks and increased service levels, things have worsened in recent months. Mohammed collected the report and went next door to Andrea's office. Andrea had received her Engineering Management. a few years ago, from a prestigious engineering school and was now in charge of production control for the company. They discussed the reasons why the latest figures were not better. These reasons include getting poor forecasts from marketing, and carrying more inventory to protect the company from unreliable vendor deliveries. The sales promotion that they ran on surplus toy trucks did not work as well as they expected. Both are asked to find a solution to improve the situation. Otherwise they may both be out of a job. Background XYZ is a modest, privately held toy company with annual sales of roughly $20 million. In 1978, the company began by producing an innovative range of plastic toys and trucks that were both durable and inexpensive. It has introduced additional lines of toys over the years and today produces 22 distinct toys, including games, dolls, toy vehicles, and novelty items. Exhibit 1 depicts the company's typical functional organization. Exhibit 1. Organization structure President Marketing/Sales Sultan Production Control Andera Manufacturing Purchasing Nasser Ibrahem Mohammed Finance/Acct Production Naif Abdullah Process Eng. Rayan Exhibit 2 shows that XYZ has had relatively poor financial results. Profits are averaging only 5% of sales, and the return on assets is less than 10%. To address the issue, the company has decided to make a concerted effort to reduce inventory and improve customer service. To cut costs, the company has started redesigning toys for manufacturability and automating its production process. These initiatives, according to the company, could cut unit production costs by at least 5% per year. In addition, the company hopes to achieve at least 15 inventory turns each year and a service level of 95%. The percentage of orders filled within one week of the customer's order is described as service level. Currently, the service level is 90%. Exhibit 2. Financial Statement Profit and Loss (In $000) Year Ending June 30, 2021 Net Sales Cost of goods sold Direct labor Materials Overhead Total COGS Gross profit G&A expense Marketing costs Profit before tax Income tax Net profit Auto Truck Robot Sept. 19 3,500 Auto Truck Robot Weekly Forecast of Demand $20,100 $2,353 6,794 2,608 $11,755 $8,345 4,932 1,776 $1,637 Sept. 19 1,100 500 700 650 $ 987 Toy auto Sept. 26 500 1,500 Sept. 26 1,150 450 650 Oct. 3 1,750 Exhibit 3. Master schedule prepared September 16, 2021 Week Beginning Oct. 3 1,200 400 650 Assets Current assets %. Cash Manufacturing operations are structured around the various types of toys produced. Each toy has its own assembly line and team of workers. In line 1, for example, three plastic toys are assembled: trucks, autos, and robots. On this line, just one toy can be produced at a time before moving on to the next. Line 1 now employs 10 people who work on the assembly, inspection, and packing of toys. Some of the parts that go into making the finished toys are manufactured on the company's plastic-molding machinery. Additional components are obtained from outside vendors. The MRP system is used to control production. Every week, a master schedule for the next six weeks is developed. This master schedule describes, for example, the quantity of trucks, automobiles, and robots that will be manufactured each week on assembly line 1, as illustrated in Exhibit 3. Products Accounts receivable Inventory Other Toy truck Total curr, assets. Fixed assets Balance Sheet (in $000) As of June 30, 2021 Net fixed assets. Total assets Llabilities Current liabilities Notes payable Accounts payable. Accruals Total curr. llab. Long-term debt Total liabilities Capital stock Retained earnings Total net worth Total liabilities and net worth Week Beginning Oct. 10 2,333 Oct. 10 1,300 350 625 D Oct. 17 2,333 Oct. 17 1,400 300 625 $1,050 2,500 2,400 540 $6,490 Toy robot 4,900 $11,390 $3,300 3,200 400 $6,900 2,300 $ 9,200 $1,500 690 $2,190 $11,390 Oct. 24 3,500 Oct. 24 1,500 300 600 Marketing provides weekly demand forecasts. Andrea updates these estimations based on previous experience to reflect more realistic estimates of demand. She also makes use of the lot sizes given in the master schedule in Exhibit 3 for each of the three toys. These lot sizes are based on prior company practices. A run-out time philosophy is utilized to schedule the toy with the lowest inventory to weekly demand ratio first (the run-out time). As a result, the master schedule is developed and saved in the computer. This master schedule, however, may be infeasible if not enough parts are available in inventory or if there is insufficient lead time to order extra parts. As a result, before approving the final master schedule, the master schedule is evaluated for practicality and modified as needed. Exhibit 4 shows the computer performing a parts explosion using the bill of materials and on-hand inventories. As indicated in the bill of materials, each toy requires several parts. Each auto, for example, requires a body, four wheels, two side windows, and a windshield. These parts are assembled, the product is inspected, and the toy is packaged, all of which takes 0.1 labor hour per auto. At the present time, there are 350 hours of productive time available per week with 10 people working on the assembly line (35 hours each times 10). If the entire week is used to produce autos, a total of 3,500 autos (350/0.1) can be produced. If the entire line is devoted to either of these products, it takes 0.2 hour to make a truck and 0.15 hour to make a robot, allowing for a maximum production of 1,750 trucks or 2,333 robots. However, production is scheduled in lots, and an entire week is not always devoted to only one toy. Exhibit 4. Bill of Materials Part Number 1019 523 525 529 531 1021 615 617 619 621 1023 730 732 734 736 Description Toy auto Car body Wheels Side windows Windshield Toy truck Cab Wheels dual Wheels single Trailer Toy robot Body Arms Legs Head Number Required per Unit 1 4 2 1 1 8 sets 2 1 1 2 2 1 Cost Each $3.20 1.45 .30 .15 .25 $6.50 1.70 .25 .30 2.20 $4.10 1.80 .35 .25 1.10 Weeks Lead Time 1 3 2 1 2 3 2 2 4 1 2 2 1 2 Current Inventory 4,000 2,500 9,800 4,300 2,620 2,000 1,800 9,900 2,500 4,600 1,500 1,600 3,500 4,020 2,150 On Order 800 due 9/26 1,200 due 10/3 It takes all 10 people one hour to change the line setup between products. This changeover entails taking out the old toy's parts, bringing in the new toy's parts, arranging the jigs and fixtures for assembly, and performing trial runs to ensure quality. The shop labor rate, including fringe benefits, is $14 per hour. It costs 25 percent to carry inventory for a year. For parts and components that are ordered, it costs $25 to place each order. When the line is changed over, a setup cost for the labor to change the line is incurred, but an order is also triggered for each of the parts used to make the final product. The total cost of a line changeover is thus the sum of these costs. Purchasing does not always purchase the exact number of parts that the production control department has ordered. Changes are made to take advantage of supplier price breaks or to achieve full-truckload shipments. As a result, in order to reduce purchasing costs, some additional parts may be purchased. Furthermore, suppliers do not always ship component parts on time. As a result, XYZ keeps safety stock inventory on hand to protect the master production schedule and keep the assembly lines running at all times. To protect against late supplier deliveries, approximately one week of safety stock is kept on hand. The assembly lines will not be shut down, according to management. Mohammed has clarified that the company will not lay off employees on a weekly basis. Thus, if demand falls below capacity by 10% in a week, production will be scheduled at full capacity to keep workers busy. If this situation continues for several weeks, workers will be laid off to adjust capacity. Workers will also be put on overtime to temporarily meet demand. However, if demand exceeds normal capacity for several weeks, more workers will be added. Based on existing capacity and lead times, a six-week rolling production schedule is used. One week is added each week to keep the total master schedule horizon at six weeks. Each week, production is adjusted based on available parts, capacity, and observed toy demand. Both production control and purchasing managers discussed what they should do to reduce inventory and improve service levels. The production control stated that there are no alternatives or excuses this time; it must be done! The production manager is unsure where to begin. She wants better sales forecasts, but is that realistic? Can she rely on marketing? She could also reduce inventory by achieving more consistent deliveries from our suppliers. Will they cooperate? Perhaps they will have to act faster in terms of layoffs and hiring in order to keep capacity closer to demand. The purchasing manager clarified that the salespeople lie to production control about forecasts in order to have more inventory on hand in case they are needed. He stated that we in purchasing lie to our suppliers about when we need the parts in order to ensure that we get them when we really need them. You increase the production schedule slightly to ensure that you can meet the shipments. We're all trying to make sure we don't run out of supplies. There is no solution to this problem because we are dealing with human nature. I hate to say it, but perhaps top management's expectations of inventory reduction and improved service are a little unrealistic. In this environment, how can they expect anyone to achieve these objectives? Questions Part I 1. For each of the three types of toys, compute economic order quantities and periodic order quantities. 2. Prepare a six-week master production schedule using the EOQs and periodic orders calculated in question 1 and a workforce of 10 workers. Calculate and compare the total cost of these two plans. 3. To support the master schedule, prepare a parts explosion. What components should be ordered every week? Are there enough planned orders to support your master schedule in time? Mohammed, XYZ, Inc.'s vice president of manufacturing, has completed reviewing the weekly production report for the week ending September 16, 2021. Inventory rose once more, and service levels fell short of expectations. Mohammed asked why these issues could not be resolved once and for all. He had implemented a new production and inventory control system on the company's server last year. While the system initially decreased stocks and increased service levels, things have worsened in recent months. Mohammed collected the report and went next door to Andrea's office. Andrea had received her Engineering Management. a few years ago, from a prestigious engineering school and was now in charge of production control for the company. They discussed the reasons why the latest figures were not better. These reasons include getting poor forecasts from marketing, and carrying more inventory to protect the company from unreliable vendor deliveries. The sales promotion that they ran on surplus toy trucks did not work as well as they expected. Both are asked to find a solution to improve the situation. Otherwise they may both be out of a job. Background XYZ is a modest, privately held toy company with annual sales of roughly $20 million. In 1978, the company began by producing an innovative range of plastic toys and trucks that were both durable and inexpensive. It has introduced additional lines of toys over the years and today produces 22 distinct toys, including games, dolls, toy vehicles, and novelty items. Exhibit 1 depicts the company's typical functional organization. Exhibit 1. Organization structure President Marketing/Sales Sultan Production Control Andera Manufacturing Purchasing Nasser Ibrahem Mohammed Finance/Acct Production Naif Abdullah Process Eng. Rayan Exhibit 2 shows that XYZ has had relatively poor financial results. Profits are averaging only 5% of sales, and the return on assets is less than 10%. To address the issue, the company has decided to make a concerted effort to reduce inventory and improve customer service. To cut costs, the company has started redesigning toys for manufacturability and automating its production process. These initiatives, according to the company, could cut unit production costs by at least 5% per year. In addition, the company hopes to achieve at least 15 inventory turns each year and a service level of 95%. The percentage of orders filled within one week of the customer's order is described as service level. Currently, the service level is 90%. Exhibit 2. Financial Statement Profit and Loss (In $000) Year Ending June 30, 2021 Net Sales Cost of goods sold Direct labor Materials Overhead Total COGS Gross profit G&A expense Marketing costs Profit before tax Income tax Net profit Auto Truck Robot Sept. 19 3,500 Auto Truck Robot Weekly Forecast of Demand $20,100 $2,353 6,794 2,608 $11,755 $8,345 4,932 1,776 $1,637 Sept. 19 1,100 500 700 650 $ 987 Toy auto Sept. 26 500 1,500 Sept. 26 1,150 450 650 Oct. 3 1,750 Exhibit 3. Master schedule prepared September 16, 2021 Week Beginning Oct. 3 1,200 400 650 Assets Current assets %. Cash Manufacturing operations are structured around the various types of toys produced. Each toy has its own assembly line and team of workers. In line 1, for example, three plastic toys are assembled: trucks, autos, and robots. On this line, just one toy can be produced at a time before moving on to the next. Line 1 now employs 10 people who work on the assembly, inspection, and packing of toys. Some of the parts that go into making the finished toys are manufactured on the company's plastic-molding machinery. Additional components are obtained from outside vendors. The MRP system is used to control production. Every week, a master schedule for the next six weeks is developed. This master schedule describes, for example, the quantity of trucks, automobiles, and robots that will be manufactured each week on assembly line 1, as illustrated in Exhibit 3. Products Accounts receivable Inventory Other Toy truck Total curr, assets. Fixed assets Balance Sheet (in $000) As of June 30, 2021 Net fixed assets. Total assets Llabilities Current liabilities Notes payable Accounts payable. Accruals Total curr. llab. Long-term debt Total liabilities Capital stock Retained earnings Total net worth Total liabilities and net worth Week Beginning Oct. 10 2,333 Oct. 10 1,300 350 625 D Oct. 17 2,333 Oct. 17 1,400 300 625 $1,050 2,500 2,400 540 $6,490 Toy robot 4,900 $11,390 $3,300 3,200 400 $6,900 2,300 $ 9,200 $1,500 690 $2,190 $11,390 Oct. 24 3,500 Oct. 24 1,500 300 600 Marketing provides weekly demand forecasts. Andrea updates these estimations based on previous experience to reflect more realistic estimates of demand. She also makes use of the lot sizes given in the master schedule in Exhibit 3 for each of the three toys. These lot sizes are based on prior company practices. A run-out time philosophy is utilized to schedule the toy with the lowest inventory to weekly demand ratio first (the run-out time). As a result, the master schedule is developed and saved in the computer. This master schedule, however, may be infeasible if not enough parts are available in inventory or if there is insufficient lead time to order extra parts. As a result, before approving the final master schedule, the master schedule is evaluated for practicality and modified as needed. Exhibit 4 shows the computer performing a parts explosion using the bill of materials and on-hand inventories. As indicated in the bill of materials, each toy requires several parts. Each auto, for example, requires a body, four wheels, two side windows, and a windshield. These parts are assembled, the product is inspected, and the toy is packaged, all of which takes 0.1 labor hour per auto. At the present time, there are 350 hours of productive time available per week with 10 people working on the assembly line (35 hours each times 10). If the entire week is used to produce autos, a total of 3,500 autos (350/0.1) can be produced. If the entire line is devoted to either of these products, it takes 0.2 hour to make a truck and 0.15 hour to make a robot, allowing for a maximum production of 1,750 trucks or 2,333 robots. However, production is scheduled in lots, and an entire week is not always devoted to only one toy. Exhibit 4. Bill of Materials Part Number 1019 523 525 529 531 1021 615 617 619 621 1023 730 732 734 736 Description Toy auto Car body Wheels Side windows Windshield Toy truck Cab Wheels dual Wheels single Trailer Toy robot Body Arms Legs Head Number Required per Unit 1 4 2 1 1 8 sets 2 1 1 2 2 1 Cost Each $3.20 1.45 .30 .15 .25 $6.50 1.70 .25 .30 2.20 $4.10 1.80 .35 .25 1.10 Weeks Lead Time 1 3 2 1 2 3 2 2 4 1 2 2 1 2 Current Inventory 4,000 2,500 9,800 4,300 2,620 2,000 1,800 9,900 2,500 4,600 1,500 1,600 3,500 4,020 2,150 On Order 800 due 9/26 1,200 due 10/3 It takes all 10 people one hour to change the line setup between products. This changeover entails taking out the old toy's parts, bringing in the new toy's parts, arranging the jigs and fixtures for assembly, and performing trial runs to ensure quality. The shop labor rate, including fringe benefits, is $14 per hour. It costs 25 percent to carry inventory for a year. For parts and components that are ordered, it costs $25 to place each order. When the line is changed over, a setup cost for the labor to change the line is incurred, but an order is also triggered for each of the parts used to make the final product. The total cost of a line changeover is thus the sum of these costs. Purchasing does not always purchase the exact number of parts that the production control department has ordered. Changes are made to take advantage of supplier price breaks or to achieve full-truckload shipments. As a result, in order to reduce purchasing costs, some additional parts may be purchased. Furthermore, suppliers do not always ship component parts on time. As a result, XYZ keeps safety stock inventory on hand to protect the master production schedule and keep the assembly lines running at all times. To protect against late supplier deliveries, approximately one week of safety stock is kept on hand. The assembly lines will not be shut down, according to management. Mohammed has clarified that the company will not lay off employees on a weekly basis. Thus, if demand falls below capacity by 10% in a week, production will be scheduled at full capacity to keep workers busy. If this situation continues for several weeks, workers will be laid off to adjust capacity. Workers will also be put on overtime to temporarily meet demand. However, if demand exceeds normal capacity for several weeks, more workers will be added. Based on existing capacity and lead times, a six-week rolling production schedule is used. One week is added each week to keep the total master schedule horizon at six weeks. Each week, production is adjusted based on available parts, capacity, and observed toy demand. Both production control and purchasing managers discussed what they should do to reduce inventory and improve service levels. The production control stated that there are no alternatives or excuses this time; it must be done! The production manager is unsure where to begin. She wants better sales forecasts, but is that realistic? Can she rely on marketing? She could also reduce inventory by achieving more consistent deliveries from our suppliers. Will they cooperate? Perhaps they will have to act faster in terms of layoffs and hiring in order to keep capacity closer to demand. The purchasing manager clarified that the salespeople lie to production control about forecasts in order to have more inventory on hand in case they are needed. He stated that we in purchasing lie to our suppliers about when we need the parts in order to ensure that we get them when we really need them. You increase the production schedule slightly to ensure that you can meet the shipments. We're all trying to make sure we don't run out of supplies. There is no solution to this problem because we are dealing with human nature. I hate to say it, but perhaps top management's expectations of inventory reduction and improved service are a little unrealistic. In this environment, how can they expect anyone to achieve these objectives? Questions Part I 1. For each of the three types of toys, compute economic order quantities and periodic order quantities. 2. Prepare a six-week master production schedule using the EOQs and periodic orders calculated in question 1 and a workforce of 10 workers. Calculate and compare the total cost of these two plans. 3. To support the master schedule, prepare a parts explosion. What components should be ordered every week? Are there enough planned orders to support your master schedule in time?
Expert Answer:
Answer rating: 100% (QA)
Based on the information provided in the case and images lets work on the questions one by one Part I Question 1 Compute economic order quantities EOQs and periodic order quantities The Economic Order ... View the full answer

Related Book For 

Management Accounting
ISBN: 978-0132570848
6th Canadian edition
Authors: Charles T. Horngren, Gary L. Sundem, William O. Stratton, Phillip Beaulieu
Posted Date:
Students also viewed these general management questions
-
The Crazy Eddie fraud may appear smaller and gentler than the massive billion-dollar frauds exposed in recent times, such as Bernie Madoffs Ponzi scheme, frauds in the subprime mortgage market, the...
-
Planning is one of the most important management functions in any business. A front office managers first step in planning should involve determine the departments goals. Planning also includes...
-
Managing Scope Changes Case Study Scope changes on a project can occur regardless of how well the project is planned or executed. Scope changes can be the result of something that was omitted during...
-
The fraud examiner's report should have what characteristics? a. Accuracy and clarity b. Relevant and material information c. Should not contain opinions or prejudices of fraud examiner. d. All of...
-
In the locked position shown, the toggle clamp exerts at A a vertical 270-lb force on the wooden block, and handle CF rests against the stop at G. Determine the force P required to release the clamp....
-
Give the purposes of each of the following procedures that may be included in internal control, and explain how each procedure contributes to strong internal control: a. Forecasting of expenditures...
-
Triple-bottom-line reporting, based on the notion of ecologically sustainable development, aims to report on financial, social and ecological positions and impacts. Is ecological accounting and...
-
A telemarketing firm has studied the effects of two factors on the response to its television advertisements. The first factor is the time of day at which the ad is run, while the second is the...
-
Income statement Prior year Current year Revenues 782.6 900.0 Cost of sales Selling costs Depreciation (27.0) (31.3) Operating profit 90.4 85.7 Interest Earnings before taxes 85.4 78.2 Taxes (31.1)...
-
A manufacturer of prefabricated homes has decided to subcontract four components of the homes. Several companies are interested in receiving this business, but none can handle more than one...
-
1. You measure an angle to be 0 = 33.10.4. What is sin 0sino? (Hint: Convert to radians first.)
-
Find the equation of the line through (-1,-2) which is perpendicular to the line y = 9. Give your answer in the form y = mx + b. Provide your answer below:
-
Giving a test to a group of students, the grades and gender are summarized below A B C Total Male Female 10 3 15 28 8 20 19 47 Total 18 23 34 75 If one student is chosen at random, Find the...
-
4. Find the basis of R2 in which coordinates of the vector v = [2,-5] are (3, 1). 5. Find the basis of R3 in which coordinates of the vector v = [1,6,-4] are (1, 2, 4).
-
(Barke) Consider an M/M/1, M/M/e or M/M/ quese with arrival rate. In the steady state, the deportarea from the system forma Poisson process with rate X, independently of a (so long as X)....
-
K A universal set U consists of 16 elements. If sets A, B, and C are proper subsets of U and n(U) 16, n(An B) = n(An C) = n(BNC) = 6, n(AnBn C) = 2, and n(A UBU C) = 14, determine each of the...
-
At the beginning of 2024, Ellingham Academy reported a balance in common stock of $167,000 and a balance in retained earnings of $67,000. During the year, the company issued additional shares of...
-
Outline a general process applicable to most control situations. Using this, explain how you would develop a system to control home delivery staff at a local pizza shop.
-
Earthtones Paint Company uses a process-cost system. Materials are added at the beginning of a particular process, and conversion costs are incurred uniformly. Work-in-process at the beginning of the...
-
Eastern Townships University uses job cost records for various research projects. A major reason for such records is to justify requests for reimbursement of costs on projects sponsored by the...
-
Why is it especially difficult to allocate joint costs and byproduct costs?
-
Is the color of a smartphone nominal or ordinal?
-
A pollster wants to estimate the proportion of voters in a certain town who are Democrats. He goes to a large shopping mall and approaches people to ask whether they are Democrats. Is this a simple...
-
Provide an example of a qualitative variable and an example of a quantitative variable.

Study smarter with the SolutionInn App