

Your team of consultants has been hired by the city of Laramie to help them design...
Fantastic news! We've Found the answer you've been seeking!
Question:
Transcribed Image Text:
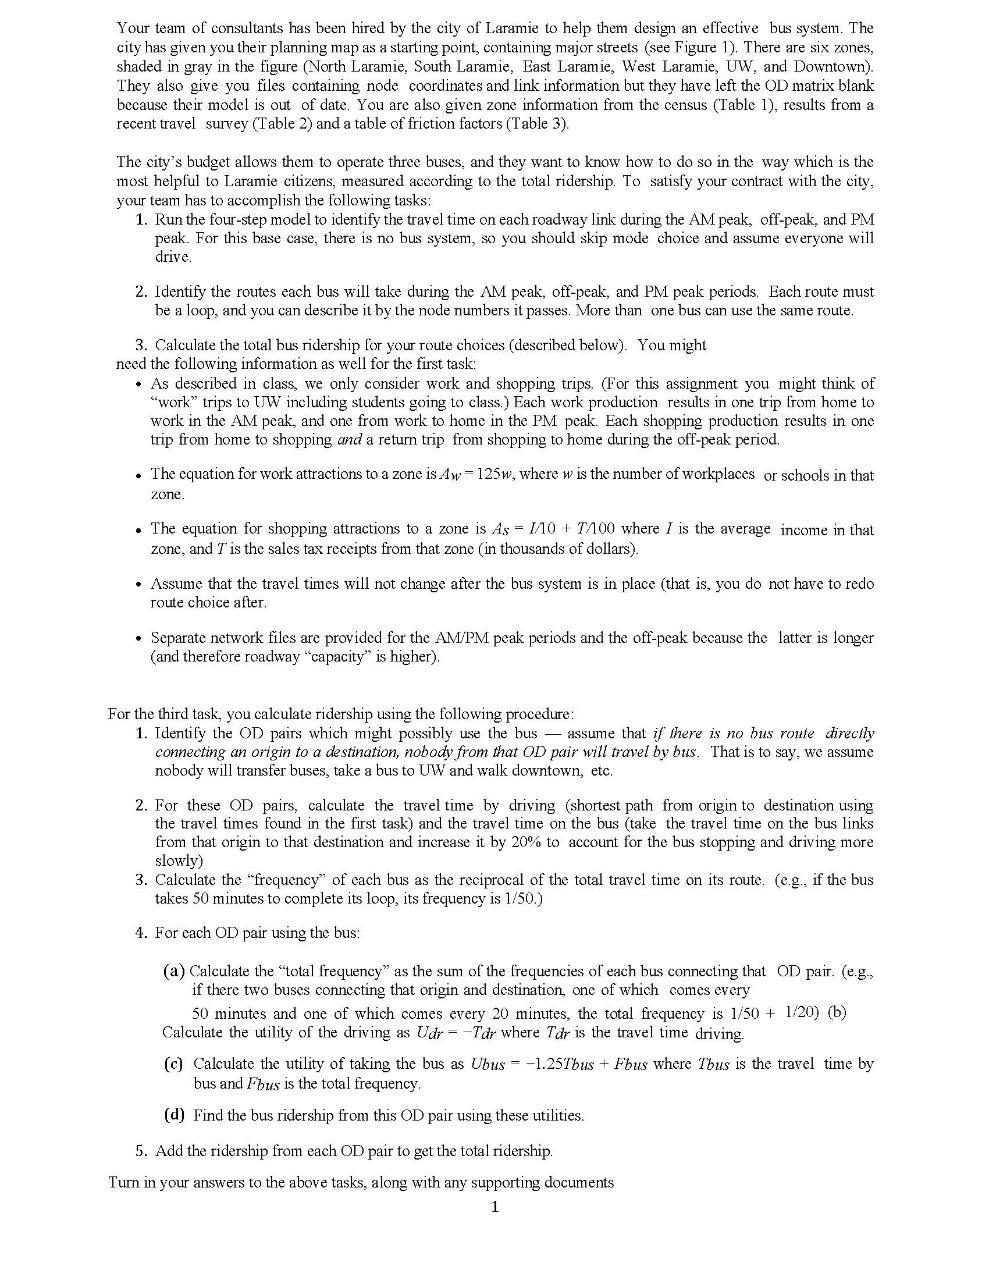
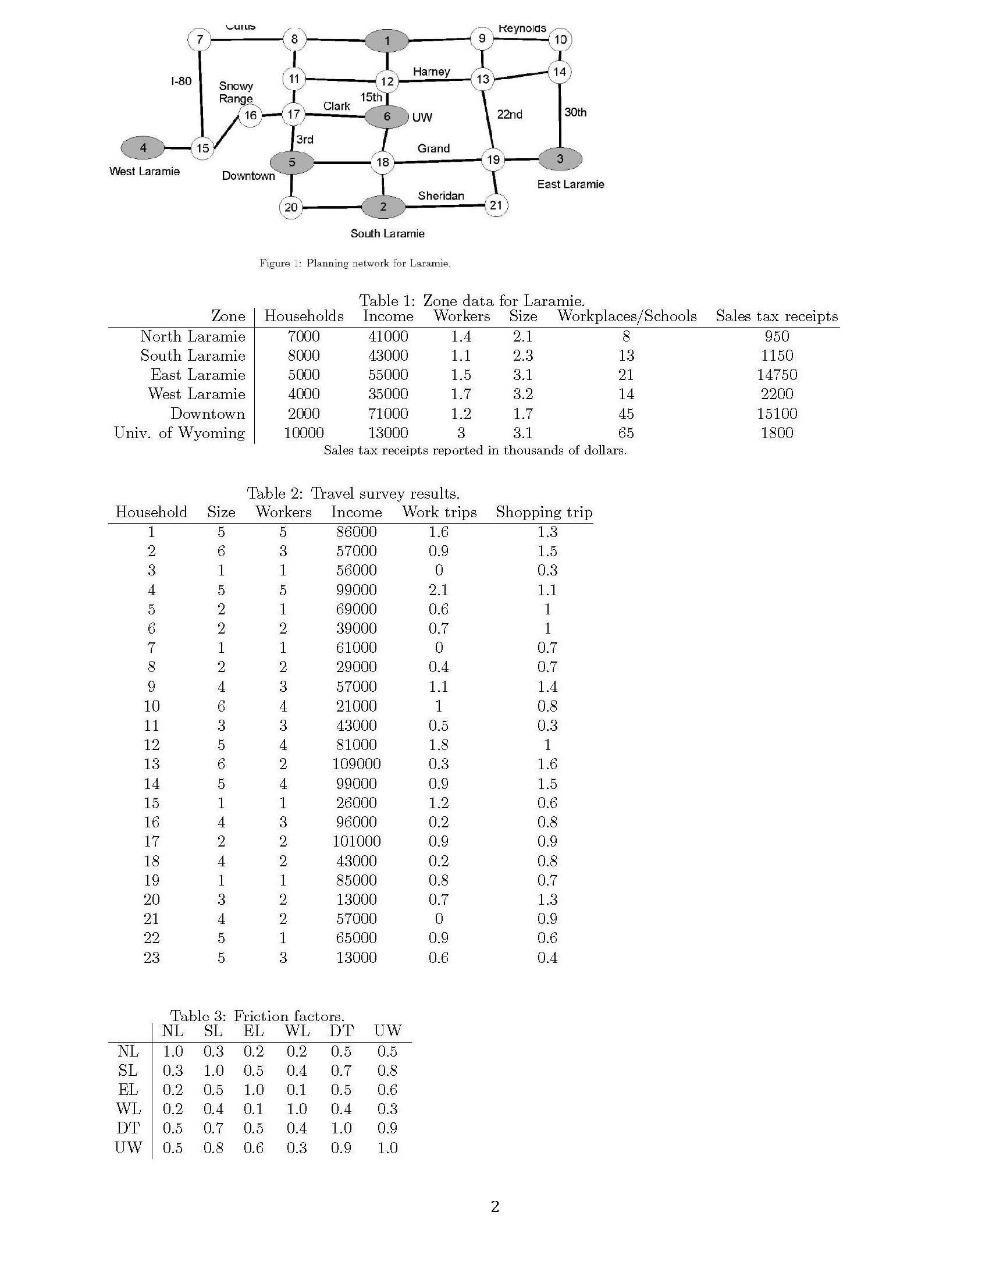
Your team of consultants has been hired by the city of Laramie to help them design an effective bus system. The city has given you their planning map as a starting point, containing major streets (see Figure 1). There are six zones, shaded in gray in the figure (North Laramie, South Laramie, East Laramie, West Laramie, UW, and Downtown). They also give you files containing node coordinates and link information but they have left the OD matrix blank because their model is out of date. You are also given zone information from the census (Table 1), results from a recent travel survey (Table 2) and a table of friction factors (Table 3). The city's budget allows them to operate three buses, and they want to know how to do so in the way which is the most helpful to Laramie citizens, measured according to the total ridership. To satisfy your contract with the city, your team has to accomplish the following tasks: 1. Run the four-step model to identify the travel time on each roadway link during the AM peak, off-peak, and PM peak. For this base case, there is no bus system, so you should skip mode choice and assume everyone will drive. 2. Identify the routes each bus will take during the AM peak, off-peak, and PM peak periods. Each route must be a loop, and you can describe it by the node numbers it passes. More than one bus can use the same route. 3. Calculate the total bus ridership for your route choices (described below). You might need the following information as well for the first task: • As described in class, we only consider work and shopping trips. (For this assignment you might think of "work" trips to UW including students going to class.) Each work production results in one trip from home to work in the AM peak, and one from work to home in the PM peak. Each shopping production results in one trip from home to shopping and a return trip from shopping to home during the off-peak period. • The equation for work attractions to a zone is Aw-125w, where w is the number of workplaces or schools in that zone. . The equation for shopping attractions to a zone is As = I10 TA100 where I is the average income in that zone, and I is the sales tax receipts from that zone (in thousands of dollars). • Assume that the travel times will not change after the bus system is in place (that is, you do not have to redo route choice after. • Separate network files are provided for the AM/PM peak periods and the off-peak because the latter is longer (and therefore roadway "capacity" is higher). For the third task, you calculate ridership using the following procedure: 1. Identify the OD pairs which might possibly use the bus assume that if there is no bus route directly connecting an origin to a destination, nobody from that OD pair will travel by bus. That is to say, we assume nobody will transfer buses, take a bus to UW and walk downtown, etc. 2. For these OD pairs, calculate the travel time by driving (shortest path from origin to destination using the travel times found in the first task) and the travel time on the bus (take the travel time on the bus links from that origin to that destination and increase it by 20% to account for the bus stopping and driving more slowly) 3. Calculate the "frequency" of each bus as the reciprocal of the total travel time on its route. (e.g., if the bus takes 50 minutes to complete its loop, its frequency is 1/50.) 4. For each OD pair using the bus: (a) Calculate the "total frequency" as the sum of the frequencies of each bus connecting that OD pair. (e.g., if there two buses connecting that origin and destination, one of which comes every 50 minutes and one of which comes every 20 minutes, the total frequency is 1/50+ 1/20) (b) Calculate the utility of the driving as Udr-Tdr where Tdr is the travel time driving. (c) Calculate the utility of taking the bus as Ubus -1.25Tbus + Fbus where Thus is the travel time by bus and Fbus is the total frequency. (d) Find the bus ridership from this OD pair using these utilities. 5. Add the ridership from each OD pair to get the total ridership. Turn in your answers to the above tasks, along with any supporting documents 1 Your team of consultants has been hired by the city of Laramie to help them design an effective bus system. The city has given you their planning map as a starting point, containing major streets (see Figure 1). There are six zones, shaded in gray in the figure (North Laramie, South Laramie, East Laramie, West Laramie, UW, and Downtown). They also give you files containing node coordinates and link information but they have left the OD matrix blank because their model is out of date. You are also given zone information from the census (Table 1), results from a recent travel survey (Table 2) and a table of friction factors (Table 3). The city's budget allows them to operate three buses, and they want to know how to do so in the way which is the most helpful to Laramie citizens, measured according to the total ridership. To satisfy your contract with the city, your team has to accomplish the following tasks: 1. Run the four-step model to identify the travel time on each roadway link during the AM peak, off-peak, and PM peak. For this base case, there is no bus system, so you should skip mode choice and assume everyone will drive. 2. Identify the routes each bus will take during the AM peak, off-peak, and PM peak periods. Each route must be a loop, and you can describe it by the node numbers it passes. More than one bus can use the same route. 3. Calculate the total bus ridership for your route choices (described below). You might need the following information as well for the first task: • As described in class, we only consider work and shopping trips. (For this assignment you might think of "work" trips to UW including students going to class.) Each work production results in one trip from home to work in the AM peak, and one from work to home in the PM peak. Each shopping production results in one trip from home to shopping and a return trip from shopping to home during the off-peak period. • The equation for work attractions to a zone is Aw-125w, where w is the number of workplaces or schools in that zone. . The equation for shopping attractions to a zone is As = I10 TA100 where I is the average income in that zone, and I is the sales tax receipts from that zone (in thousands of dollars). • Assume that the travel times will not change after the bus system is in place (that is, you do not have to redo route choice after. • Separate network files are provided for the AM/PM peak periods and the off-peak because the latter is longer (and therefore roadway "capacity" is higher). For the third task, you calculate ridership using the following procedure: 1. Identify the OD pairs which might possibly use the bus assume that if there is no bus route directly connecting an origin to a destination, nobody from that OD pair will travel by bus. That is to say, we assume nobody will transfer buses, take a bus to UW and walk downtown, etc. 2. For these OD pairs, calculate the travel time by driving (shortest path from origin to destination using the travel times found in the first task) and the travel time on the bus (take the travel time on the bus links from that origin to that destination and increase it by 20% to account for the bus stopping and driving more slowly) 3. Calculate the "frequency" of each bus as the reciprocal of the total travel time on its route. (e.g., if the bus takes 50 minutes to complete its loop, its frequency is 1/50.) 4. For each OD pair using the bus: (a) Calculate the "total frequency" as the sum of the frequencies of each bus connecting that OD pair. (e.g., if there two buses connecting that origin and destination, one of which comes every 50 minutes and one of which comes every 20 minutes, the total frequency is 1/50+ 1/20) (b) Calculate the utility of the driving as Udr-Tdr where Tdr is the travel time driving. (c) Calculate the utility of taking the bus as Ubus -1.25Tbus + Fbus where Thus is the travel time by bus and Fbus is the total frequency. (d) Find the bus ridership from this OD pair using these utilities. 5. Add the ridership from each OD pair to get the total ridership. Turn in your answers to the above tasks, along with any supporting documents 1
Expert Answer:
Answer rating: 100% (QA)
According to the given data If wash dryer is dropped then Revised Operating Income will be Sales Lab... View the full answer

Related Book For 

Statistics for Business Decision Making and Analysis
ISBN: 978-0321890269
2nd edition
Authors: Robert Stine, Dean Foster
Posted Date:
Students also viewed these computer engineering questions
-
Milli Company plans to discontinue a division that generates a total contribution margin of $20,000 per year. Fixed overhead associated with this division is $50,000, of which $5,000 cannot be...
-
A researcher records the number of words recalled by students presented with a list of words for one minute. In one group, students were presented with the list of words in color; in a second group,...
-
Count the number of cars that pass by an intersection during consecutive five-minute periods on a highway leading into a city. Would these data allow us to use the Law of Large Numbers eventually to...
-
You start driving east for 14 miles, turn left, and drive north for another 10 miles. At the end of driving, what is your straight line distance from your starting point? Round to the nearest tenth...
-
Giuseppes buys supplies to make pizzas for $4. Operating expenses of the business are 110% of the cost and the profit made is 130% of cost. What is the regular selling price of each pizza?
-
Find the value of $x_{1}$ and $x_{2}$, which minimizes \[F=x_{1}^{2}+x_{2}^{2}-x_{1} x_{2}-3 x_{2}\] subject to \[\begin{aligned}& -x_{1}-x_{2} \geq-2 \\& x \geq 0, x_{2} \text { integer...
-
Consider the general problem of a bar made from m segments, each having a constant cross-sectional area Am and length Lm. If there are n loads on the bar as shown, write a computer program that can...
-
Noble Corporation has outstanding $400,000 of 8 percent bonds callable at 104. On December 1, immediately after the payment of the semiannual interest and the amortization of the bond discount were...
-
Utilizing evidence with in-text citations from course materials, answer parts A, B, and C in an initial posting. Your initial answer should be a minimum of words, and demonstrate an ability to think...
-
Steam enters a turbine at 9 MPa, 600C, and 60 m/s and leaves at 20 kPa and 90 m/s with a moisture content of 5 percent. The turbine is not adequately insulated, and it estimated that heat is lost...
-
Q1: Draw the plan and sections (use autocad) of a pile footing if Number of piles=12 -Pile Diameter 40cm. - Pile length 5m(10cm inside cap) -Distance between piles= Im cle -Pile steel R. 6bars 16mm...
-
What is fraud? How does it differ from error?
-
What is the difference between a simple budget and a flexible budget?
-
What is pay-for-performance?
-
What are the main characteristics of a bond?
-
What are the two categories of controls over information technology?
-
To rationalize the numerator of 8x+27 what value should the numerator and denominator be multiplied by? 3x 8x 27 8 +27 3x X Questi
-
The National Collegiate Athletic Association (NCAA) and the National Federation of State High School Associations (NFHS) set a new standard for non-wood baseball bats. Their goal was to ensure that...
-
Outliers affect more than the statistics that measure the center of a distribution. Outliers also affect statistics that measure the spread of the distribution. Use the sizes of the songs in Exercise...
-
A Canadian paper manufacturer sells much of its paper in the United States. The manufacturer is paid in U.S. dollars but pays its employees in Canadian dollars. The manufacturer is interested in the...
-
Collinearity is sometimes described as a problem with the data, not the model. Rather than filling the scatterplot of X1 on X2, the data concentrate along a diagonal. For example, the following plot...
-
Analyze the last poor decision made by a group of which you were a member. What do you think contributed to the groups poor decision? Did the group think of alternative possibilities? Did the group...
-
Explain why teams and groups are not the same.
-
Discuss the various task groups within an organization and their purposes.

Study smarter with the SolutionInn App