

During the 1960s, Emil Zuckerkandl and Linus Pauling hypothesized that comparisons of genetic sequences from different...
Fantastic news! We've Found the answer you've been seeking!
Question:

Transcribed Image Text:
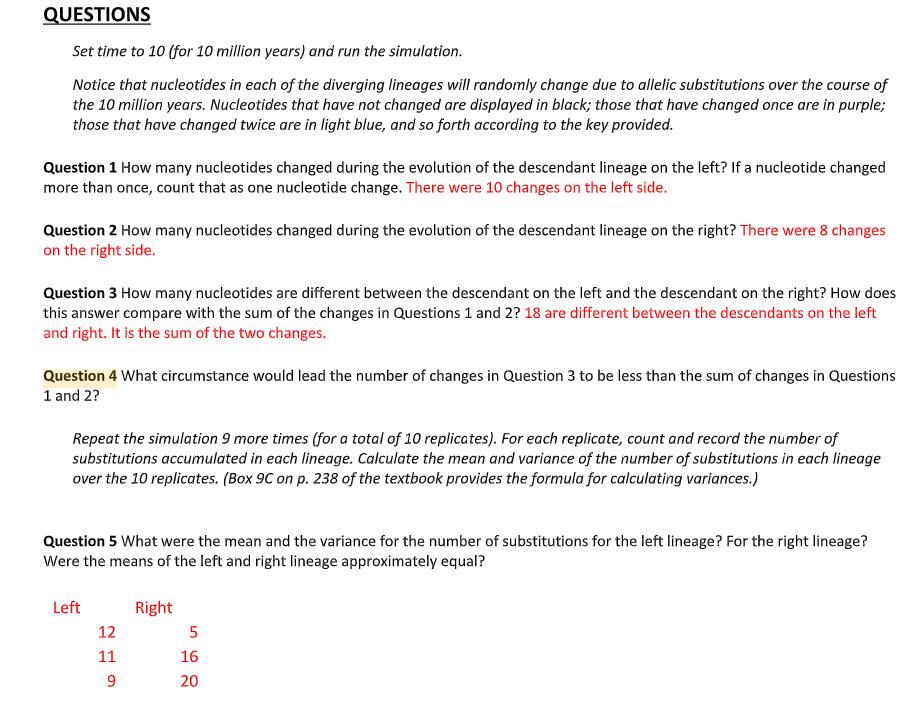
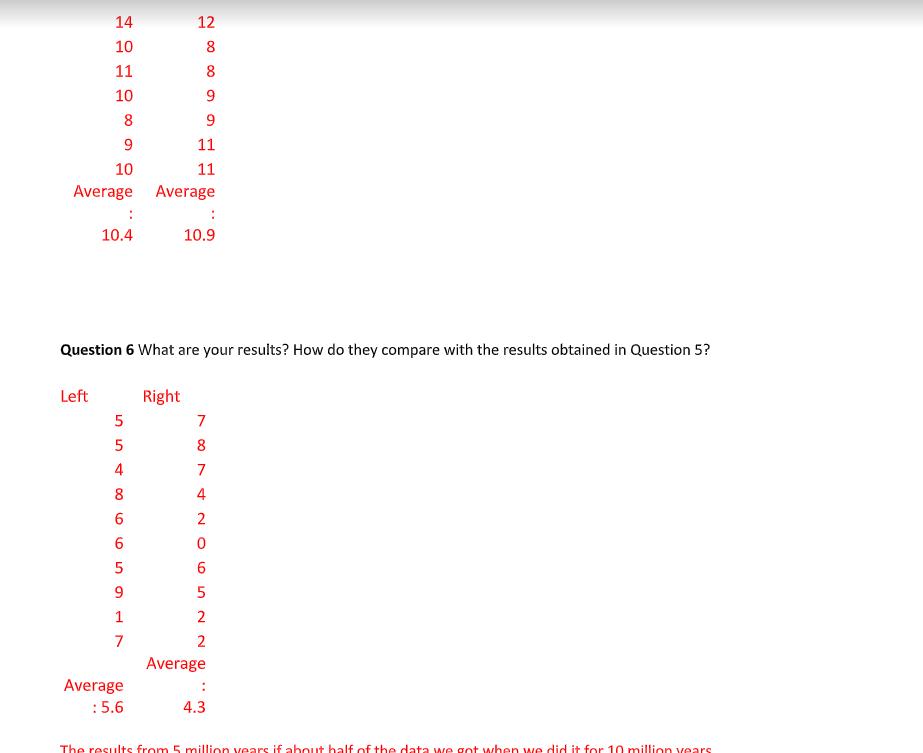
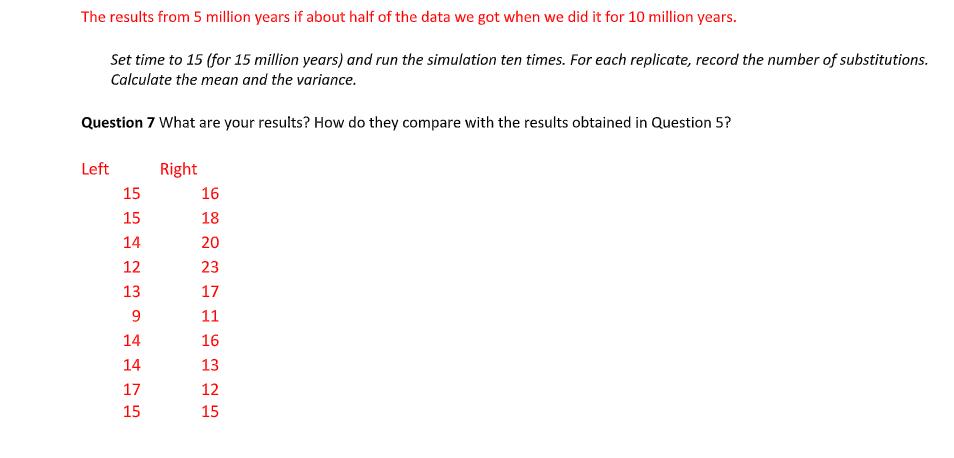
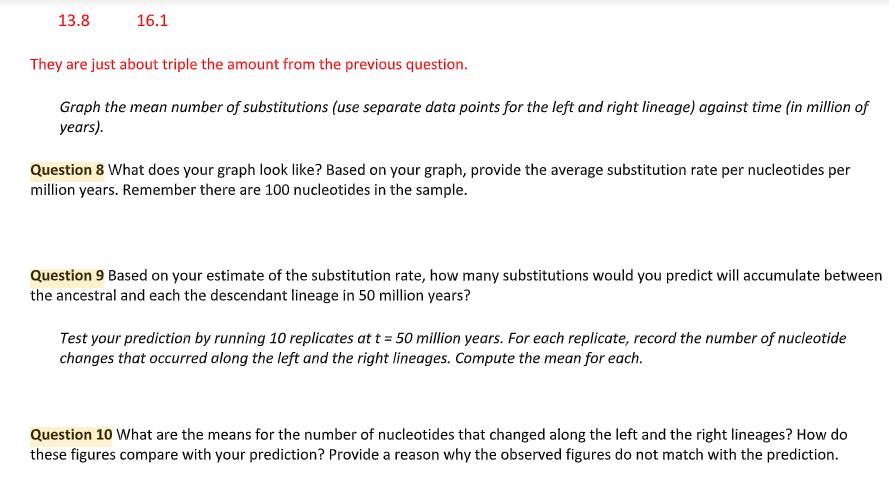
During the 1960s, Emil Zuckerkandl and Linus Pauling hypothesized that comparisons of genetic sequences from different organisms could be used to date their divergence. This idea, known as the molecular clock hypothesis, has been used countless times to provide dates for the splitting of dates. The molecular clock has even been used to date the timing of disease outbreaks, such as those caused by the HIV and H1N1 "swine" flu viruses. To say that a DNA sequence behaves like a molecular clock does not mean that the sequence changes will keep time like a standard clock; the changes are not that regular. Instead, the changes (substitutions) appear more or less randomly. The outcome is that while DNA sequence changes can provide information about estimating the dating of divergences, there will be variance associated with those estimates. Here you will simulate the evolution of DNA sequences. Unlike in nearly all cases of real evolution, you will know the ancestral sequence. This ancestral DNA sequence is shown in the center. The DNA sequence is 100 nucleotide sequences in length (only one strand is shown); it is displayed in 4 columns of 25 nucleotides each. Above to the left of the ancestor is one descendant sequence; above to the right of the ancestor is the other. QUESTIONS Set time to 10 (for 10 million years) and run the simulation. Notice that nucleotides in each of the diverging lineages will randomly change due to allelic substitutions over the course of the 10 million years. Nucleotides that have not changed are displayed in black; those that have changed once are in purple; those that have changed twice are in light blue, and so forth according to the key provided. Question 1 How many nucleotides changed during the evolution of the descendant lineage on the left? If a nucleotide changed more than once, count that as one nucleotide change. There were 10 changes on the left side. Question 2 How many nucleotides changed during the evolution of the descendant lineage on the right? There were 8 changes on the right side. Question 3 How many nucleotides are different between the descendant on the left and the descendant on the right? How does this answer compare with the sum of the changes in Questions 1 and 2? 18 are different between the descendants on the left and right. It is the sum of the two changes. Question 4 What circumstance would lead the number of changes in Question 3 to be less than the sum of changes in Questions 1 and 2? Repeat the simulation 9 more times (for a total of 10 replicates). For each replicate, count and record the number of substitutions accumulated in each lineage. Calculate the mean and variance of the number of substitutions in each lineage over the 10 replicates. (Box 9C on p. 238 of the textbook provides the formula for calculating variances.) Question 5 What were the mean and the variance for the number of substitutions for the left lineage? For the right lineage? Were the means of the left and right lineage approximately equal? Left 12 11 9 Right 5 16 20 14 10 11 10 8 9 10 Average Left 10.4 554 Question 6 What are your results? How do they compare with the results obtained in Question 5? Right 8 6 6 59L7 5 9 1 12 Average : 5.6 8 8 9 9 11 11 Average 10.9 787 4 2 0 6 5 2 2 Average 4.3 The results from 5 million years if about half of the data we got when we did it for 10 million years The results from 5 million years if about half of the data we got when we did it for 10 million years. Set time to 15 (for 15 million years) and run the simulation ten times. For each replicate, record the number of substitutions. Calculate the mean and the variance. Question 7 What are your results? How do they compare with the results obtained in Question 5? Left 15 15 14 12 13 9 14 1415 17 Right 16 18 20 23 17 11 16 13 12 15 13.8 16.1 They are just about triple the amount from the previous question. Graph the mean number of substitutions (use separate data points for the left and right lineage) against time (in million of years). Question 8 What does your graph look like? Based on your graph, provide the average substitution rate per nucleotides per million years. Remember there are 100 nucleotides in the sample. Question 9 Based on your estimate of the substitution rate, how many substitutions would you predict will accumulate between the ancestral and each the descendant lineage in 50 million years? Test your prediction by running 10 replicates at t = 50 million years. For each replicate, record the number of nucleotide changes that occurred along the left and the right lineages. Compute the mean for each. Question 10 What are the means for the number of nucleotides that changed along the left and the right lineages? How do these figures compare with your prediction? Provide a reason why the observed figures do not match with the prediction. During the 1960s, Emil Zuckerkandl and Linus Pauling hypothesized that comparisons of genetic sequences from different organisms could be used to date their divergence. This idea, known as the molecular clock hypothesis, has been used countless times to provide dates for the splitting of dates. The molecular clock has even been used to date the timing of disease outbreaks, such as those caused by the HIV and H1N1 "swine" flu viruses. To say that a DNA sequence behaves like a molecular clock does not mean that the sequence changes will keep time like a standard clock; the changes are not that regular. Instead, the changes (substitutions) appear more or less randomly. The outcome is that while DNA sequence changes can provide information about estimating the dating of divergences, there will be variance associated with those estimates. Here you will simulate the evolution of DNA sequences. Unlike in nearly all cases of real evolution, you will know the ancestral sequence. This ancestral DNA sequence is shown in the center. The DNA sequence is 100 nucleotide sequences in length (only one strand is shown); it is displayed in 4 columns of 25 nucleotides each. Above to the left of the ancestor is one descendant sequence; above to the right of the ancestor is the other. QUESTIONS Set time to 10 (for 10 million years) and run the simulation. Notice that nucleotides in each of the diverging lineages will randomly change due to allelic substitutions over the course of the 10 million years. Nucleotides that have not changed are displayed in black; those that have changed once are in purple; those that have changed twice are in light blue, and so forth according to the key provided. Question 1 How many nucleotides changed during the evolution of the descendant lineage on the left? If a nucleotide changed more than once, count that as one nucleotide change. There were 10 changes on the left side. Question 2 How many nucleotides changed during the evolution of the descendant lineage on the right? There were 8 changes on the right side. Question 3 How many nucleotides are different between the descendant on the left and the descendant on the right? How does this answer compare with the sum of the changes in Questions 1 and 2? 18 are different between the descendants on the left and right. It is the sum of the two changes. Question 4 What circumstance would lead the number of changes in Question 3 to be less than the sum of changes in Questions 1 and 2? Repeat the simulation 9 more times (for a total of 10 replicates). For each replicate, count and record the number of substitutions accumulated in each lineage. Calculate the mean and variance of the number of substitutions in each lineage over the 10 replicates. (Box 9C on p. 238 of the textbook provides the formula for calculating variances.) Question 5 What were the mean and the variance for the number of substitutions for the left lineage? For the right lineage? Were the means of the left and right lineage approximately equal? Left 12 11 9 Right 5 16 20 14 10 11 10 8 9 10 Average Left 10.4 554 Question 6 What are your results? How do they compare with the results obtained in Question 5? Right 8 6 6 59L7 5 9 1 12 Average : 5.6 8 8 9 9 11 11 Average 10.9 787 4 2 0 6 5 2 2 Average 4.3 The results from 5 million years if about half of the data we got when we did it for 10 million years The results from 5 million years if about half of the data we got when we did it for 10 million years. Set time to 15 (for 15 million years) and run the simulation ten times. For each replicate, record the number of substitutions. Calculate the mean and the variance. Question 7 What are your results? How do they compare with the results obtained in Question 5? Left 15 15 14 12 13 9 14 1415 17 Right 16 18 20 23 17 11 16 13 12 15 13.8 16.1 They are just about triple the amount from the previous question. Graph the mean number of substitutions (use separate data points for the left and right lineage) against time (in million of years). Question 8 What does your graph look like? Based on your graph, provide the average substitution rate per nucleotides per million years. Remember there are 100 nucleotides in the sample. Question 9 Based on your estimate of the substitution rate, how many substitutions would you predict will accumulate between the ancestral and each the descendant lineage in 50 million years? Test your prediction by running 10 replicates at t = 50 million years. For each replicate, record the number of nucleotide changes that occurred along the left and the right lineages. Compute the mean for each. Question 10 What are the means for the number of nucleotides that changed along the left and the right lineages? How do these figures compare with your prediction? Provide a reason why the observed figures do not match with the prediction.
Expert Answer:

Related Book For 
Cost Accounting A Managerial Emphasis
ISBN: 978-0133428704
15th edition
Authors: Charles T. Horngren, Srikant M. Datar, Madhav V. Rajan
Posted Date:
Students also viewed these accounting questions
-
Each of the following situations Involves the use of discounts: 1. How much discount may DOOBIE Inc. take in each of the following transactions? What was the annualized Interest rate? Round your...
-
In each of the following indicate which reaction will occur faster. Explain your reasoning. (a) CH3CH2CH2CH2Br or CH3CH2CH2CH2I with sodium cyanide in dimethyl sulfoxide (b) 1-Chloro-2-methylbutane...
-
In each of the following reactions, an amine or a lithium amide derivative reacts with an aryl halide. Give the structure of the expected product, and specify the mechanism by which it is formed.
-
If you deposit $2,000 today into an account earning an annual rate of return of 9 percent, what would your account be worth In 30 years? a. If you deposit $2, 000 today into an account earning an...
-
Framco Resources is an independent oil and natural gas company that engages in the acquisition, development, and exploitation of onshore North American oil and natural gas properties. The company has...
-
Explain the different types of ball bearings used in the industry.
-
How to draft a pretrial memorandum?
-
1) The U.S. Department of Defense has a long history of sponsoring projects that have questionable usefulness. If you were assigned as a member of a project review team for a defense project, what...
-
Does ESG investing incorporate ethics and is there a possibility that this channel may catalyze needed change? Would it be possible to get guidance on this, such as ideas, references etc. I am...
-
Fun Silly Toys (FST) produces a number of space themed toys (e.g., astronaut action figures). One of the newer divisions at FST is the board game division, which currently produces and sells one...
-
What are PERT and Gantt charts? How do we decide which one to use?
-
What are the categories of resources to be allocated to the project?
-
Answer the following true/false questions: Qualify or explain your answers as needed. a. System users tend to be confused by data entry codes, and frequently enter the wrong code; therefore, their...
-
What are the differences between forward scheduling and reverse scheduling?
-
What are the factors to consider in estimating task durations?
-
aye The accounting records of Nettle Distribution show the following assets and liabilities as of December 31 for Year 1 and Year 2. December 31 Cash Year 1 Year 2 $ 46,354 Accounts receivable 25,162...
-
After graduating from college and working a few years at a small technology firm. Preet scored a high-level job in the logistics department at Amex Corporation. Amex sells high-quality electronic...
-
Roku Electronics manufactures universal power adapters at its Desert Sands plant. The company provides you with the following information regarding operations for April 2014: Total power adapters...
-
Carmel Rugs is holding a 2-week carpet sale at Jeans Club, a local warehouse store. Carmel Rugs plans to sell carpets for $ 1,000 each. The company will purchase the carpets from a local distributor...
-
Trendy T-Shirt Factory manufactures plain white and solid-colored T-shirts. Inputs include the following: Additionally, the colored T-shirts require 3 ounces of dye per shirt at a cost of $ 0.40 per...
-
During 2020, Valley Sales Inc. earned revenues of \(\$ 500,000\) on account. Valley Sales collected \(\$ 410,000\) from customers during the year. Expenses totalled \(\$ 420,000\), and the related...
-
Great Sporting Goods Inc. began 2020 owing notes payable of \(\$ 4.0\) million. During 2020 , the company borrowed \(\$ 2.6\) million on notes payable and paid off \(\$ 2.5\) million of notes payable...
-
Marquis Inc. made sales of \(\$ 700\) million during 2020. Of this amount, Marquis Inc. collected cash for all but \(\$ 30\) million. The company's cost of goods sold was \(\$ 300\) million, and all...

Study smarter with the SolutionInn App