

Exhibit 5.7 is a room-occupancy table for the existing system. Each row in the table follows the
Question:
Exhibit 5.7 is a room-occupancy table for the existing system. Each row in the table follows the patients who checked in on a given day. The columns indicate the number of patients in the hospital on a given day. For example, the first row of the table shows that 30 people checked in on Monday and were in the hospital for Monday, Tuesday, and Wednesday. By summing the columns of the table for Wednesday, we see that there are 90 patients staying in the hospital that day.
Although financial data are sketchy, an estimate from a construction company indicates that adding bed capacity would cost about $100,000 per bed. In addition, the rate charged for the hernia surgery varies between about $900 and $2,000 (U.S. dollars), with an average rate of $1,300 per operation. The surgeons are paid a flat $600 per operation. Due to all the uncertainties in government health care legislation, Should ice would like to justify any expansion within a five-year time period.
Exhibit 5.7 for Reference: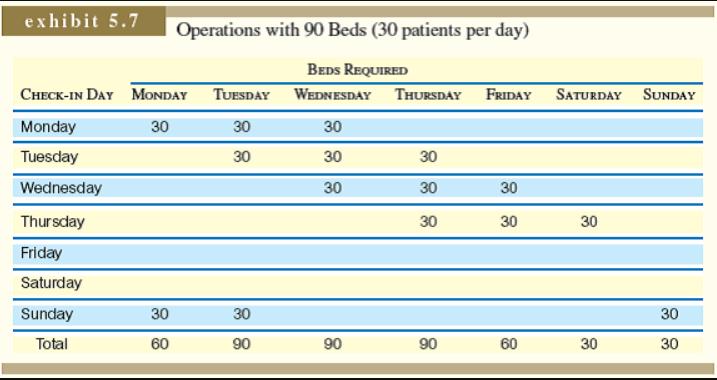
Expert Answer:
The Community Tool Box is a big fan of participatory process That means involving ... View the full answer


