

Now use multiple regression to explore the relationship between Final_exam (Y), assignment_grade (X1), and Tutorial_attend (X2). You
Fantastic news! We've Found the answer you've been seeking!
Question:
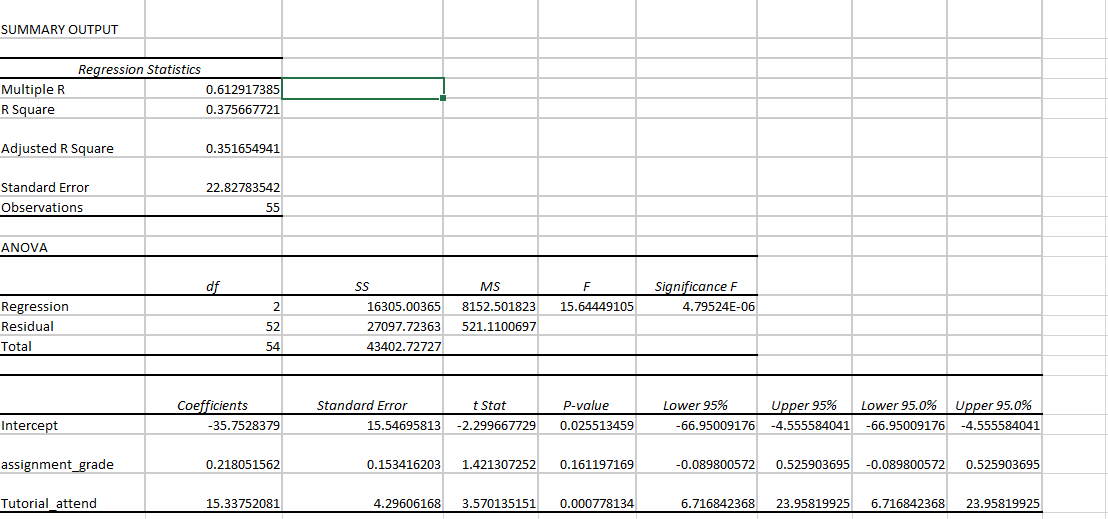
Now use multiple regression to explore the relationship between Final_exam (Y), assignment_grade (X1), and Tutorial_attend (X2). You may use Data Analysis Tool Pack for this. Carry out any relevant two-tailed hypothesis tests at the 5% significance level. Carefully interpret. If you had a magic wand and could request additional data for your analysis of this course, what extra variables would you request and why?
| Final_exam | assignment_grade | Tutorial_attend |
| 100 | 90 | 5 |
| 100 | 75 | 5 |
| 90 | 75 | 5 |
| 85 | 85 | 5 |
| 85 | 100 | 5 |
| 80 | 95 | 5 |
| 70 | 80 | 5 |
| 60 | 95 | 5 |
| 60 | 80 | 5 |
| 55 | 95 | 5 |
| 55 | 25 | 4 |
| 50 | 80 | 5 |
| 45 | 90 | 5 |
| 40 | 65 | 5 |
| 40 | 65 | 4 |
| 35 | 0 | 3 |
| 30 | 70 | 4 |
| 30 | 55 | 4 |
| 25 | 85 | 5 |
| 25 | 90 | 4 |
| 15 | 5 | 3 |
| 15 | 80 | 5 |
| 15 | 50 | 5 |
| 15 | 45 | 3 |
| 5 | 75 | 3 |
| 5 | 70 | 4 |
| 100 | 100 | 5 |
| 95 | 75 | 5 |
| 90 | 100 | 5 |
| 85 | 85 | 5 |
| 80 | 95 | 5 |
| 70 | 45 | 5 |
| 70 | 100 | 5 |
| 65 | 90 | 5 |
| 60 | 100 | 5 |
| 55 | 65 | 4 |
| 55 | 90 | 5 |
| 55 | 80 | 4 |
| 50 | 50 | 5 |
| 45 | 50 | 4 |
| 45 | 75 | 3 |
| 40 | 75 | 5 |
| 40 | 70 | 5 |
| 35 | 90 | 4 |
| 30 | 95 | 5 |
| 30 | 55 | 5 |
| 25 | 75 | 4 |
| 25 | 20 | 3 |
| 25 | 65 | 2 |
| 15 | 60 | 4 |
| 15 | 60 | 4 |
| 15 | 80 | 5 |
| 10 | 55 | 4 |
| 10 | 80 | 2 |
| 0 | 0 | 2 |
Expert Answer:

Related Book For 

Posted Date:
