

Describe the structure of the data. Is it different than data you have examined before? Specifically,...
Fantastic news! We've Found the answer you've been seeking!
Question:
Transcribed Image Text:
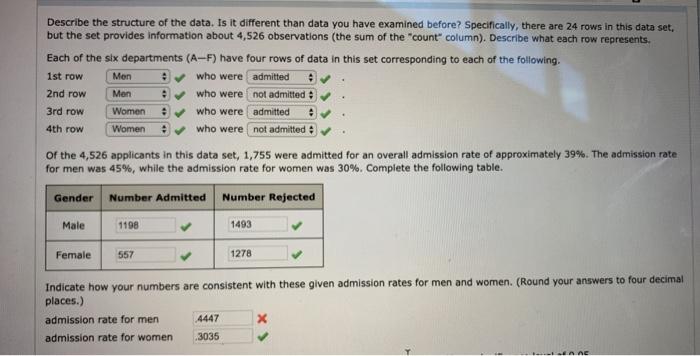
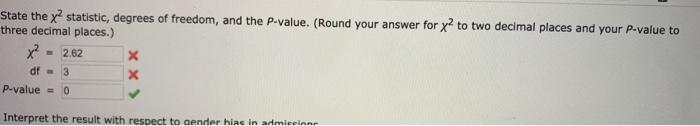
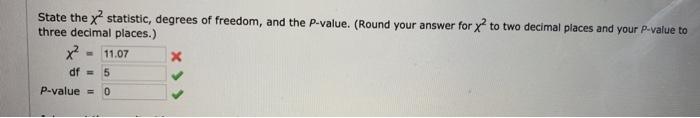
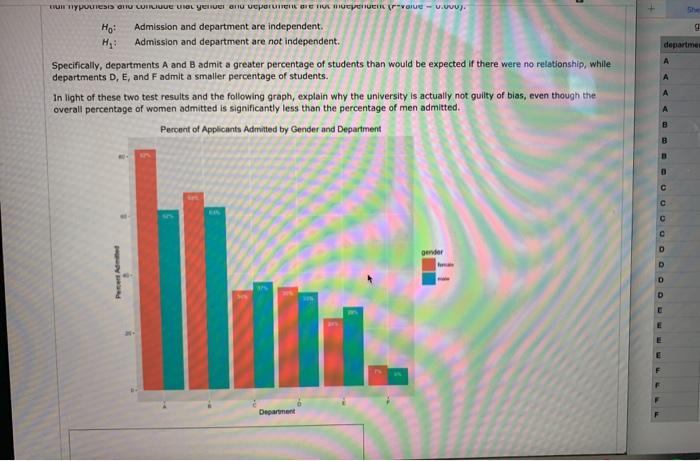
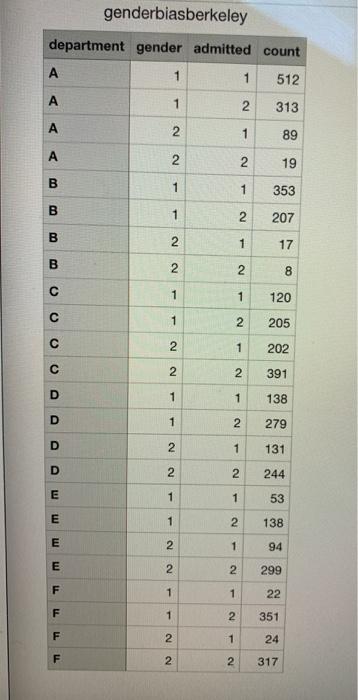
Describe the structure of the data. Is it different than data you have examined before? Specifically, there are 24 rows in this data set, but the set provides information about 4,526 observations (the sum of the "count" column). Describe what each row represents. Each of the six departments (A-F) have four rows of data in this set corresponding to each of the following. 1st row Men who were admitted 2nd row Men ✔ who were not admitted # admitted 3rd row Women ✔who were 4th row Women ✔who were not admitted # of the 4,526 applicants in this data set, 1,755 were admitted for an overall admission rate of approximately 39%. The admission rate for men was 45%, while the admission rate for women was 30%. Complete the following table. Gender Number Admitted Number Rejected Male 1198 1493 1278 Female 557 Indicate how your numbers are consistent with these given admission rates for men and women. (Round your answers to four decimal places.) admission rate for men 4447 x admission rate for women 3035 A DE State the x² statistic, degrees of freedom, and the P-value. (Round your answer for x² to two decimal places and your P-value to three decimal places.) x² 2.62 x x df 3 P-value = 0 Interpret the result with respect to gender hias in admiccione State the x² statistic, degrees of freedom, and the P-value. (Round your answer for x2 to two decimal places and your P-value to three decimal places.). x² 11.07 x df = 5 P-value = 0 mun hypothesis and continue that gender and department is not intende (value.www. Ho: Admission and department are independent. Admission and department are not independent. H₂: Specifically, departments A and B admit a greater percentage of students than would be expected if there were no relationship, while departments D, E, and F admit a smaller percentage of students. In light of these two test results and the following graph, explain why the university is actually not guilty of bias, even though the overall percentage of women admitted is significantly less than the percentage of men admitted. Percent of Applicants Admitted by Gender and Department gender Department Peter Admitted She g departmen OOOOOOOOL D genderbiasberkeley department gender admitted count A 1 1 512 A 2 313 A 2 1 89 A 2 2 19 B 1 1 353 B 1 2 207 B 2 1 17 2 2 8 1 120 2 205 1 202 2 391 1 138 2 279 1 131 244 1 53 2 138 1 94 2 299 1 22 2 351 1 24 2 317 B C C C D D D E E E E F F F LL LL 1 1 2 2 1 1 2 2 1 1 2 2 1 1 2 2 12 Describe the structure of the data. Is it different than data you have examined before? Specifically, there are 24 rows in this data set, but the set provides information about 4,526 observations (the sum of the "count" column). Describe what each row represents. Each of the six departments (A-F) have four rows of data in this set corresponding to each of the following. 1st row Men who were admitted 2nd row Men ✔ who were not admitted # admitted 3rd row Women ✔who were 4th row Women ✔who were not admitted # of the 4,526 applicants in this data set, 1,755 were admitted for an overall admission rate of approximately 39%. The admission rate for men was 45%, while the admission rate for women was 30%. Complete the following table. Gender Number Admitted Number Rejected Male 1198 1493 1278 Female 557 Indicate how your numbers are consistent with these given admission rates for men and women. (Round your answers to four decimal places.) admission rate for men 4447 x admission rate for women 3035 A DE State the x² statistic, degrees of freedom, and the P-value. (Round your answer for x² to two decimal places and your P-value to three decimal places.) x² 2.62 x x df 3 P-value = 0 Interpret the result with respect to gender hias in admiccione State the x² statistic, degrees of freedom, and the P-value. (Round your answer for x2 to two decimal places and your P-value to three decimal places.). x² 11.07 x df = 5 P-value = 0 mun hypothesis and continue that gender and department is not intende (value.www. Ho: Admission and department are independent. Admission and department are not independent. H₂: Specifically, departments A and B admit a greater percentage of students than would be expected if there were no relationship, while departments D, E, and F admit a smaller percentage of students. In light of these two test results and the following graph, explain why the university is actually not guilty of bias, even though the overall percentage of women admitted is significantly less than the percentage of men admitted. Percent of Applicants Admitted by Gender and Department gender Department Peter Admitted She g departmen OOOOOOOOL D genderbiasberkeley department gender admitted count A 1 1 512 A 2 313 A 2 1 89 A 2 2 19 B 1 1 353 B 1 2 207 B 2 1 17 2 2 8 1 120 2 205 1 202 2 391 1 138 2 279 1 131 244 1 53 2 138 1 94 2 299 1 22 2 351 1 24 2 317 B C C C D D D E E E E F F F LL LL 1 1 2 2 1 1 2 2 1 1 2 2 1 1 2 2 12
Expert Answer:

Related Book For 

Posted Date:
Students also viewed these accounting questions
-
Under which conditions due you maximize the multiplier to infinity 3
-
The individuals in this data set are a. Households. b. People. c. Adults. d. 120 variables. e. Columns. At the Census Bureau website www.census.gov, you can view detailed data collected by the...
-
In 2012, 709 women and 586 men were asked how much confidence they had in Congress. The results of the survey are de- scribed by the multiple bar graph in Fig. 18. a. Which gender of those surveyed...
-
Evaluate the binomial coefficient. 8.
-
The Thematic Apperception Test (TAT) presents participants with ambiguous pictures and asks them to tell a story about them. These stories can be scored in any number of ways. Werner, Stabenau, and...
-
How does an auditor test whether cash balances actually exist?
-
Find a video on deposition preparation that is available online. As a paralegal, how can you assist in preparing a client for deposition?
-
The company reported the following information for the year: Ending work-in-process inventory . . . . . . . . . . . . . . . . . . . . . . . . . . . . $100,000 Depreciation on factory building . . . ....
-
you will design and implement a ESP IDF-based IoT system that uses Amazon Alexa voice control to either lock or unlock the "set time" functionality of a ESP32-based embedded system that has a keypad,...
-
You own a firm, and you want to raise $30 million to fund an expansion. Currently, you own 100% of the firms equity, and the firm has no debt. To raise the $30 million solely through equity, you will...
-
a random sample of 15 cars indicates that the mean MPG is 207 miles per gallon Past studies showed that the standard deviation is 21 miles per gallon and the population is normally distributed Find a...
-
The total number of people at a football game was 5 6 0 0 . Field - side tickets were 4 0 dollars and end - zone tickets were 2 0 dollars. If the total amount of money received for the tickets was $...
-
Assets Cash Accounts receivable (net of $4,000 allowance for doubtful accounts) Inventory Property, plant, and equipment (net of $560,000 accumulated depreciation) Total assets Liabilities and...
-
Ty ' s scout troop is picking up litter at the park. Each trash bag holds 8 pounds of litter. The scout troop collected a total of 2 3 0 pounds of litter. How many trash bags did they use?
-
Wages of $11,000 are earned by workers but not paid as of December 31. Depreciation on the company's equipment for the year is $11,440 The Supplies account had a $360 debit balance at the beginning...
-
Rewrite this measurement with a simpler unit, if possible. kg.m 9.3 2 m m 2
-
ok t nces On January 1, 2024, Rick's Pawn Shop leased a truck from Corey Motors for a six-year period with an option to extend the lease for three years. Rick's had no significant economic incentive...
-
In Exercises 1-2, rewrite each verbal statement as an equation. Then decide whether the statement is true or false. Justify your answer. 1. The logarithm of the difference of two numbers is equal to...
-
When modeling some data with an exponential regression curve, explain how to determine whether a data point is an influential point. Compare this process with modeling some data with a regression...
-
The percentages of Americans who say there should be a ban on the possession of handguns are shown in Table 51 for various years. Let p be the percentage of Americans who say there should be a ban on...
-
(2, 5) and (3, 10) Find an approximate equation y = abx of the exponential curve that contains the given pair of points. Round the values of a and b to two decimal places.
-
How does the auditors professional duty of confidence affect disclosures to third parties?
-
When can auditors disclose unlawful acts to the police?
-
What should auditors do if they discover an unlawful act?

Study smarter with the SolutionInn App