

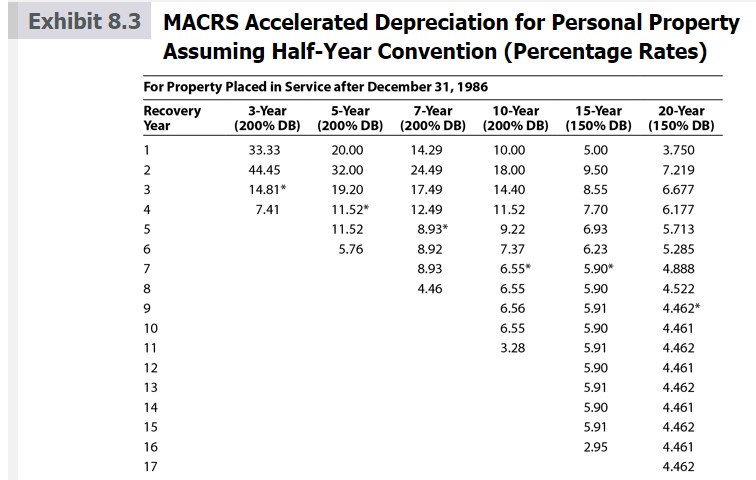
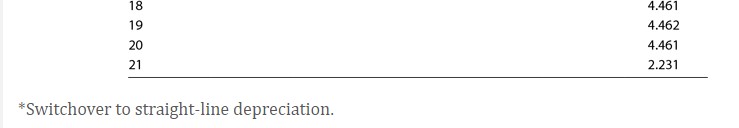
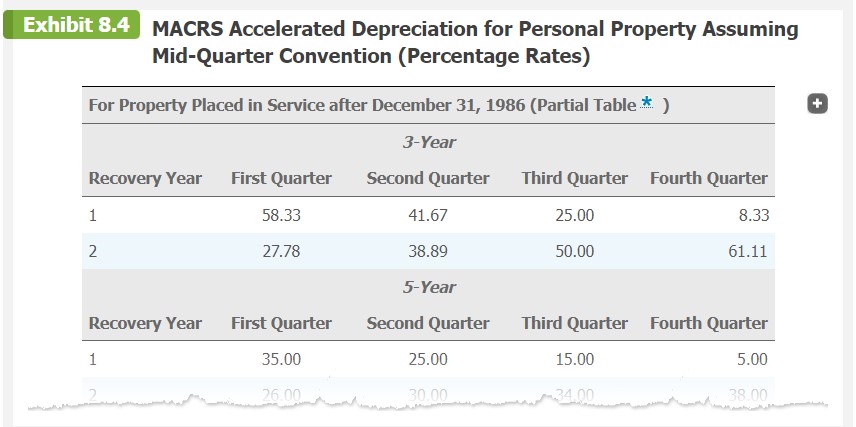
On April 3, 2021, Terry purchased and placed in service a building that cost $2,000,000. An...
Fantastic news! We've Found the answer you've been seeking!
Question:
Transcribed Image Text:
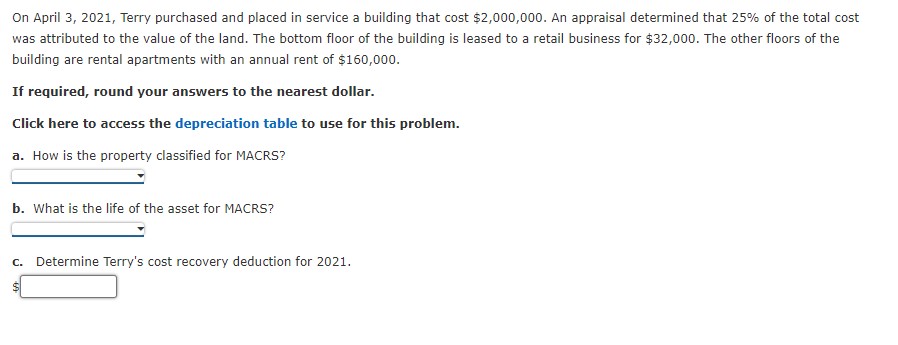
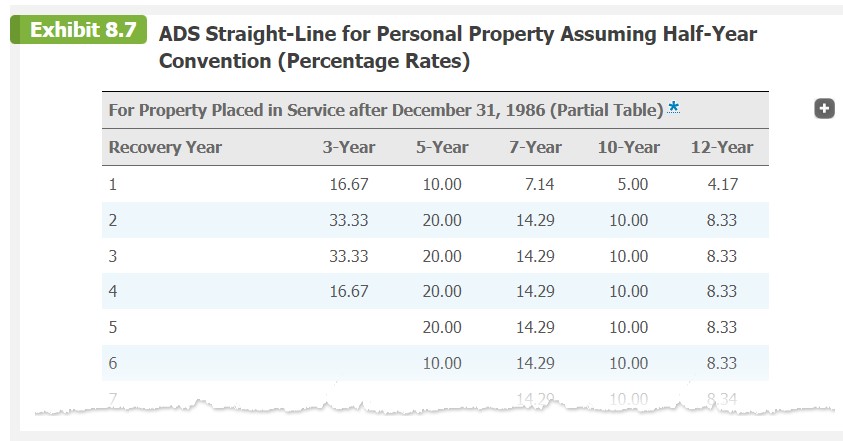
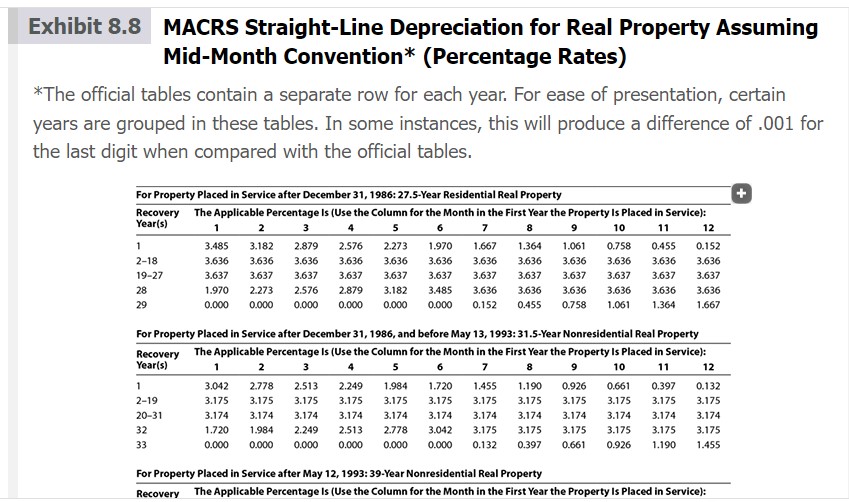
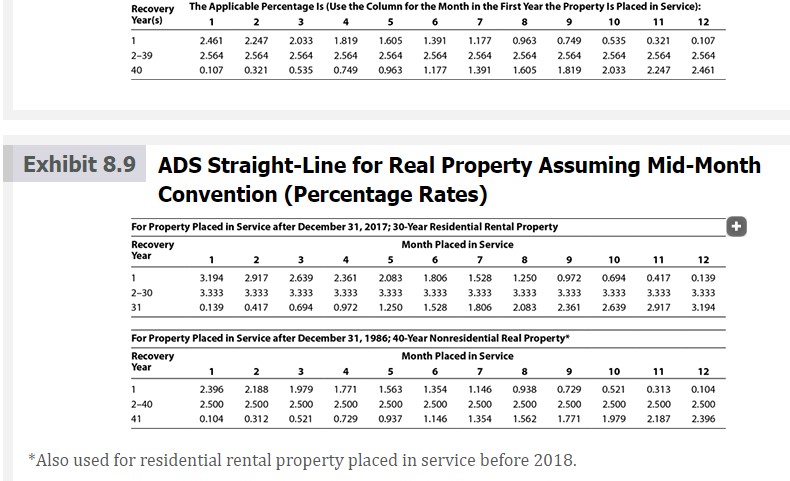
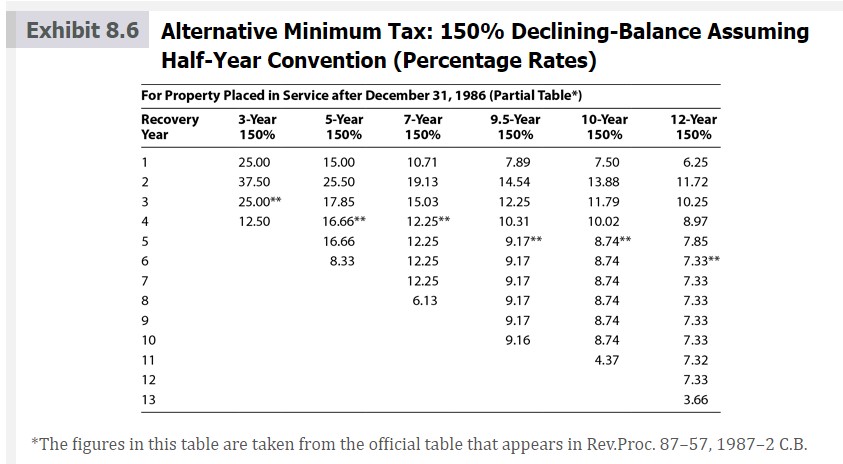
On April 3, 2021, Terry purchased and placed in service a building that cost $2,000,000. An appraisal determined that 25% of the total cost was attributed to the value of the land. The bottom floor of the building is leased to a retail business for $32,000. The other floors of the building are rental apartments with an annual rent of $160,000. If required, round your answers to the nearest dollar. Click here to access the depreciation table to use for this problem. a. How is the property classified for MACRS? b. What is the life of the asset for MACRS? c. Determine Terry's cost recovery deduction for 2021. Exhibit 8.7 ADS Straight-Line for Personal Property Assuming Half-Year Convention (Percentage Rates) For Property Placed in Service after December 31, 1986 (Partial Table).* Recovery Year 3-Year 5-Year 7-Year 10-Year 16.67 7.14 5.00 33.33 10.00 33.33 16.67 1 2 3 4 5 6 Jove 10.00 20.00 20.00 20.00 20.00 10.00 14.29 14.29 14.29 14.29 14.29 14.29 10.00 10.00 10.00 10.00 10.00 12-Year 4.17 8.33 8.33 8.33 8.33 8.33 8.34 Exhibit 8.8 MACRS Straight-Line Depreciation for Real Property Assuming Mid-Month Convention* (Percentage Rates) *The official tables contain a separate row for each year. For ease of presentation, certain years are grouped in these tables. In some instances, this will produce a difference of .001 for the last digit when compared with the official tables. For Property Placed in Service after December 31, 1986: 27.5-Year Residential Real Property Recovery The Applicable Percentage Is (Use the Column for the Month in the First Year the Property Is Placed in Service): Year(s) 4 5 11 6 7 8 9 10 1.970 1.667 1.364 1.061 0.758 3.636 3.636 3.637 3.637 3.485 3.636 0.000 0.152 3.636 3.636 3.636 3.637 3.637 3.637 3.636 3.636 0.455 0.758 1 2-18 19-27 28 29 1 2 3 3.485 3.182 2.879 2.576 2.273 3.636 3.636 3.636 3.636 3.636 3.637 3.637 3.637 3.637 3.637 1.970 2.273 2.576 2.879 3.182 0.000 0.000 0.000 0.000 0.000 1 2-19 20-31 32 33 12 0.455 0.152 3.636 3.637 3.636 3.636 1.061 1.364 For Property Placed in Service after December 31, 1986, and before May 13, 1993: 31.5-Year Nonresidential Real Property Recovery The Applicable Percentage Is (Use the Column for the Month in the First Year the Property Is Placed in Service): Year(s) 4 1 2 3 5 6 7 8 9 10 11 3.042 2.778 2.513 2.249 1.984 1.720 1.455 3.175 3.175 3.175 3.175 3.175 3.175 3.175 3.174 3.174 3.174 3.174 3.174 3.174 3.174 1.720 1.984 2.249 2.513 2.778 3.042 3.175 0.000 0.000 0.000 0.000 0.000 0.000 0.132 0.661 0.397 3.175 3.175 1.190 0.926 3.175 3.175 3.174 3.174 3.174 3.174 3.175 3.175 3.175 3.175 0.397 0.661 0.926 1.190 3.636 3.637 3.636 1.667 12 0.132 3.175 3.174 3.175 1.455 For Property Placed in Service after May 12, 1993: 39-Year Nonresidential Real Property Recovery The Applicable Percentage Is (Use the Column for the Month in the First Year the Property is placed in Service): + Recovery Year(s) 1 2-39 40 Recovery Year The Applicable Percentage Is (Use the Column for the Month in the First Year the Property Is Placed in Service): 2 3 4 5 6 10 11 2.247 2.033 1.819 1.605 1.391 2.564 2.564 2.564 2.564 2.564 0.321 0.535 0.749 0.963 1.177 7 8 9 1.177 0.963 0.749 2.564 2.564 1.391 1.605 Exhibit 8.9 ADS Straight-Line for Real Property Assuming Mid-Month Convention (Percentage Rates) 1 2-30 31 1 2.461 2.564 0.107 For Property Placed in Service after December 31, 2017; 30-Year Residential Rental Property Month Placed in Service 6 7 1.806 1.528 3.333 3.333 1.528 1.806 Recovery Year 12 0.535 2.564 2.564 1.819 2.033 2.247 2.461 0.321 0.107 2.564 2.564 1 2 3.194 2.917 3.333 3.333 0.139 0.417 3 4 5 2.361 2.639 2.083 3.333 3.333 3.333 0.694 0.972 1.250 9 11 8 10 1.250 0.972 0.694 0.417 3.333 3.333 3.333 3.333 2.083 2.361 2.639 2.917 For Property Placed in Service after December 31, 1986; 40-Year Nonresidential Real Property* 1 2 3 10 11 Month Placed in Service 5 6 7 8 9 2.396 2.188 1.979 1.771 1.563 1.354 1.146 0.938 0.729 0.521 0.313 2.500 2.500 2.500 2.500 2.500 2.500 2.500 2.500 2.500 2.500 2.500 0.104 0.312 0.521 0.729 0.937 1.146 1.354 1.771 1.979 2.187 1.562 1 2-40 41 * Also used for residential rental property placed in service before 2018. 12 0.139 3.333 3.194 12 0.104 2.500 2.396 + Exhibit 8.3 MACRS Accelerated Depreciation for Personal Property Assuming Half-Year Convention (Percentage Rates) For Property Placed in Service after December 31, 1986 3-Year 5-Year (200% DB) (200% DB) Recovery Year 1 2 3 4 5 6 7 8 9 10 11 12 13 14 15 16 17 33.33 44.45 14.81* 7.41 20.00 32.00 19.20 11.52* 11.52 5.76 7-Year (200% DB) 14.29 24.49 17.49 12.49 8.93* 8.92 8.93 4.46 10-Year (200% DB) 10.00 18.00 14.40 11.52 9.22 7.37 6.55* 6.55 6.56 6.55 3.28 15-Year (150% DB) 5.00 9.50 8.55 7.70 6.93 6.23 5.90* 5.90 5.91 5.90 5.91 5.90 5.91 5.90 5.91 2.95 20-Year (150% DB) 3.750 7.219 6.677 6.177 5.713 5.285 4.888 4.522 4.462* 4.461 4.462 4.461 4.462 4.461 4.462 4.461 4.462 18 19 20 21 *Switchover to straight-line depreciation. 4.461 4.462 4.461 2.231 Exhibit 8.4 MACRS Accelerated Depreciation for Personal Property Assuming Mid-Quarter Convention (Percentage Rates) For Property Placed in Service after December 31, 1986 (Partial Table * ) 3-Year Recovery Year 1 2 Recovery Year 1 2 First Quarter Second Quarter Third Quarter Fourth Quarter 58.33 27.78 First Quarter 35.00 26.00 41.67 38.89 5-Year Second Quarter 25.00 30.00 25.00 50.00 8.33 15.00 34.00 61.11 Third Quarter Fourth Quarter 5.00 38.00 Exhibit 8.5 MACRS Straight-Line Depreciation for Personal Property Assuming Half-Year Convention * For Property Placed in Service after December 31, 1986 MACRS Class 3-year 5-year 7-year 10-year 15-year % First Recovery Year 16.67 10.00 7.14 5.00 3.33 Other Recovery Years Last Recovery Year Years Year % 2-3 2-5 2-7 2-10 2-15 % 33.33 20.00 14.29 10.00 6.67 4 6 8 11 16 16.67 10.00 7.14 5.00 3.33 Note: The last two rows of this table are used for qualified improvement property (15-year normal MACRS; 20-year ADS). Exhibit 8.6 Alternative Minimum Tax: 150% Declining-Balance Assuming Half-Year Convention (Percentage Rates) For Property Placed in Service after December 31, 1986 (Partial Table*) 5-Year 9.5-Year 150% 150% Recovery Year 1 2 MS 67 ∞0 4 5 8 9 10 11 12 13 3-Year 150% 25.00 37.50 25.00** 12.50 15.00 25.50 17.85 16.66** 16.66 8.33 7-Year 150% 10.71 19.13 15.03 12.25** 12.25 12.25 12.25 6.13 7.89 14.54 12.25 10.31 9.17** 9.17 9.17 9.17 9.17 9.16 10-Year 150% 7.50 13.88 11.79 10.02 8.74** 8.74 8.74 8.74 8.74 8.74 4.37 12-Year 150% 6.25 11.72 10.25 8.97 7.85 7.33** 7.33 7.33 7.33 7.33 7.32 7.33 3.66 *The figures in this table are taken from the official table that appears in Rev.Proc. 87-57,1987-2 C.B. On April 3, 2021, Terry purchased and placed in service a building that cost $2,000,000. An appraisal determined that 25% of the total cost was attributed to the value of the land. The bottom floor of the building is leased to a retail business for $32,000. The other floors of the building are rental apartments with an annual rent of $160,000. If required, round your answers to the nearest dollar. Click here to access the depreciation table to use for this problem. a. How is the property classified for MACRS? b. What is the life of the asset for MACRS? c. Determine Terry's cost recovery deduction for 2021. Exhibit 8.7 ADS Straight-Line for Personal Property Assuming Half-Year Convention (Percentage Rates) For Property Placed in Service after December 31, 1986 (Partial Table).* Recovery Year 3-Year 5-Year 7-Year 10-Year 16.67 7.14 5.00 33.33 10.00 33.33 16.67 1 2 3 4 5 6 Jove 10.00 20.00 20.00 20.00 20.00 10.00 14.29 14.29 14.29 14.29 14.29 14.29 10.00 10.00 10.00 10.00 10.00 12-Year 4.17 8.33 8.33 8.33 8.33 8.33 8.34 Exhibit 8.8 MACRS Straight-Line Depreciation for Real Property Assuming Mid-Month Convention* (Percentage Rates) *The official tables contain a separate row for each year. For ease of presentation, certain years are grouped in these tables. In some instances, this will produce a difference of .001 for the last digit when compared with the official tables. For Property Placed in Service after December 31, 1986: 27.5-Year Residential Real Property Recovery The Applicable Percentage Is (Use the Column for the Month in the First Year the Property Is Placed in Service): Year(s) 4 5 11 6 7 8 9 10 1.970 1.667 1.364 1.061 0.758 3.636 3.636 3.637 3.637 3.485 3.636 0.000 0.152 3.636 3.636 3.636 3.637 3.637 3.637 3.636 3.636 0.455 0.758 1 2-18 19-27 28 29 1 2 3 3.485 3.182 2.879 2.576 2.273 3.636 3.636 3.636 3.636 3.636 3.637 3.637 3.637 3.637 3.637 1.970 2.273 2.576 2.879 3.182 0.000 0.000 0.000 0.000 0.000 1 2-19 20-31 32 33 12 0.455 0.152 3.636 3.637 3.636 3.636 1.061 1.364 For Property Placed in Service after December 31, 1986, and before May 13, 1993: 31.5-Year Nonresidential Real Property Recovery The Applicable Percentage Is (Use the Column for the Month in the First Year the Property Is Placed in Service): Year(s) 4 1 2 3 5 6 7 8 9 10 11 3.042 2.778 2.513 2.249 1.984 1.720 1.455 3.175 3.175 3.175 3.175 3.175 3.175 3.175 3.174 3.174 3.174 3.174 3.174 3.174 3.174 1.720 1.984 2.249 2.513 2.778 3.042 3.175 0.000 0.000 0.000 0.000 0.000 0.000 0.132 0.661 0.397 3.175 3.175 1.190 0.926 3.175 3.175 3.174 3.174 3.174 3.174 3.175 3.175 3.175 3.175 0.397 0.661 0.926 1.190 3.636 3.637 3.636 1.667 12 0.132 3.175 3.174 3.175 1.455 For Property Placed in Service after May 12, 1993: 39-Year Nonresidential Real Property Recovery The Applicable Percentage Is (Use the Column for the Month in the First Year the Property is placed in Service): + Recovery Year(s) 1 2-39 40 Recovery Year The Applicable Percentage Is (Use the Column for the Month in the First Year the Property Is Placed in Service): 2 3 4 5 6 10 11 2.247 2.033 1.819 1.605 1.391 2.564 2.564 2.564 2.564 2.564 0.321 0.535 0.749 0.963 1.177 7 8 9 1.177 0.963 0.749 2.564 2.564 1.391 1.605 Exhibit 8.9 ADS Straight-Line for Real Property Assuming Mid-Month Convention (Percentage Rates) 1 2-30 31 1 2.461 2.564 0.107 For Property Placed in Service after December 31, 2017; 30-Year Residential Rental Property Month Placed in Service 6 7 1.806 1.528 3.333 3.333 1.528 1.806 Recovery Year 12 0.535 2.564 2.564 1.819 2.033 2.247 2.461 0.321 0.107 2.564 2.564 1 2 3.194 2.917 3.333 3.333 0.139 0.417 3 4 5 2.361 2.639 2.083 3.333 3.333 3.333 0.694 0.972 1.250 9 11 8 10 1.250 0.972 0.694 0.417 3.333 3.333 3.333 3.333 2.083 2.361 2.639 2.917 For Property Placed in Service after December 31, 1986; 40-Year Nonresidential Real Property* 1 2 3 10 11 Month Placed in Service 5 6 7 8 9 2.396 2.188 1.979 1.771 1.563 1.354 1.146 0.938 0.729 0.521 0.313 2.500 2.500 2.500 2.500 2.500 2.500 2.500 2.500 2.500 2.500 2.500 0.104 0.312 0.521 0.729 0.937 1.146 1.354 1.771 1.979 2.187 1.562 1 2-40 41 * Also used for residential rental property placed in service before 2018. 12 0.139 3.333 3.194 12 0.104 2.500 2.396 + Exhibit 8.3 MACRS Accelerated Depreciation for Personal Property Assuming Half-Year Convention (Percentage Rates) For Property Placed in Service after December 31, 1986 3-Year 5-Year (200% DB) (200% DB) Recovery Year 1 2 3 4 5 6 7 8 9 10 11 12 13 14 15 16 17 33.33 44.45 14.81* 7.41 20.00 32.00 19.20 11.52* 11.52 5.76 7-Year (200% DB) 14.29 24.49 17.49 12.49 8.93* 8.92 8.93 4.46 10-Year (200% DB) 10.00 18.00 14.40 11.52 9.22 7.37 6.55* 6.55 6.56 6.55 3.28 15-Year (150% DB) 5.00 9.50 8.55 7.70 6.93 6.23 5.90* 5.90 5.91 5.90 5.91 5.90 5.91 5.90 5.91 2.95 20-Year (150% DB) 3.750 7.219 6.677 6.177 5.713 5.285 4.888 4.522 4.462* 4.461 4.462 4.461 4.462 4.461 4.462 4.461 4.462 18 19 20 21 *Switchover to straight-line depreciation. 4.461 4.462 4.461 2.231 Exhibit 8.4 MACRS Accelerated Depreciation for Personal Property Assuming Mid-Quarter Convention (Percentage Rates) For Property Placed in Service after December 31, 1986 (Partial Table * ) 3-Year Recovery Year 1 2 Recovery Year 1 2 First Quarter Second Quarter Third Quarter Fourth Quarter 58.33 27.78 First Quarter 35.00 26.00 41.67 38.89 5-Year Second Quarter 25.00 30.00 25.00 50.00 8.33 15.00 34.00 61.11 Third Quarter Fourth Quarter 5.00 38.00 Exhibit 8.5 MACRS Straight-Line Depreciation for Personal Property Assuming Half-Year Convention * For Property Placed in Service after December 31, 1986 MACRS Class 3-year 5-year 7-year 10-year 15-year % First Recovery Year 16.67 10.00 7.14 5.00 3.33 Other Recovery Years Last Recovery Year Years Year % 2-3 2-5 2-7 2-10 2-15 % 33.33 20.00 14.29 10.00 6.67 4 6 8 11 16 16.67 10.00 7.14 5.00 3.33 Note: The last two rows of this table are used for qualified improvement property (15-year normal MACRS; 20-year ADS). Exhibit 8.6 Alternative Minimum Tax: 150% Declining-Balance Assuming Half-Year Convention (Percentage Rates) For Property Placed in Service after December 31, 1986 (Partial Table*) 5-Year 9.5-Year 150% 150% Recovery Year 1 2 MS 67 ∞0 4 5 8 9 10 11 12 13 3-Year 150% 25.00 37.50 25.00** 12.50 15.00 25.50 17.85 16.66** 16.66 8.33 7-Year 150% 10.71 19.13 15.03 12.25** 12.25 12.25 12.25 6.13 7.89 14.54 12.25 10.31 9.17** 9.17 9.17 9.17 9.17 9.16 10-Year 150% 7.50 13.88 11.79 10.02 8.74** 8.74 8.74 8.74 8.74 8.74 4.37 12-Year 150% 6.25 11.72 10.25 8.97 7.85 7.33** 7.33 7.33 7.33 7.33 7.32 7.33 3.66 *The figures in this table are taken from the official table that appears in Rev.Proc. 87-57,1987-2 C.B.
Expert Answer:
Answer rating: 100% (QA)
a Property Classification Residential rental real estate Explanation The term residential ... View the full answer

Related Book For 

South-Western Federal Taxation 2022 Individual Income Taxes
ISBN: 9780357519073
45th Edition
Authors: James C. Young, Annette Nellen, William A. Raabe, Mark Persellin, William H. Hoffman
Posted Date:
Students also viewed these law questions
-
On April 3, 2016, Terry purchased and placed in service a building that cost $2 million. An appraisal determined that 25% of the total cost was attributed to the value of the land. The bottom floor...
-
On April 3, 2014, Terry purchased and placed in service a building. The building cost $2 million. An appraisal determined that 25% of the total cost was attributed to the value of the land. The...
-
Sentry Transport, Inc., of Atlanta provides in-town parcel delivery services in addition to a full range of passenger services. Sentry engaged in the following activities during the current year: a....
-
1. What kinds of industries tend to be better performers in the medium to long term? Why? What kinds of industries tend to do poorly in the medium to long term? Why? 2. Can you make the claim that...
-
What is the nature of creditors claims on assets?
-
Consider the [102] model \[\begin{aligned}d S_{t} & =\mu_{S} S_{t} d t+\sqrt{Y_{t}} S_{t} d B_{t} \\d Y_{t} & =\mu_{Y} Y_{t} d t+\xi Y_{t} d W_{t}\end{aligned}\] The volatility process is...
-
Julie Company came into existence with a $2,000 cash investment by owners on January 1, 2011, and entered into the following transactions during 2011: Sales . . . . . . . . . . . . . . . . . . . . ....
-
Use BYD Auto digital marketing strategies to answer the following questions in details; Take the role of marketing consultants who have been hired to design a digital strategy for Pearl River Piano...
-
Complete the flexible budget variance analysis by filling in the blanks in the partial flexible budget performance report for 9,000 travel locks for Grant, Inc. GRANT, INC. Flexible Budget...
-
1. Two resistors R = 2200 and R = 1800 are placed in series and connected in a circuit with a battery of 54.0V. What is the net resistance, current through the battery and net power supplied by the...
-
Analyze the role of transformational leadership in driving organizational change and fostering employee commitment.
-
k=0 2k 'WI Find the sum of the series:
-
discuss the challenges and opportunities in regenerative medicine and tissue engineering using embryonic stem cells, induced pluripotent stem cells, and organoid models, including the ethical...
-
How do group cohesiveness and team composition affect the innovation process in cross-functional project teams? Explain
-
Identify organizational documentation that can be used to record strategies and goals for a project. Describe which of these documents are best used for the management of the project integration...
-
Kayser SE owns 25% of Plano Company. For the current year, Plano reports net income of 190,000 and declares and pays a 40,000 cash dividend. Record Kaysers equity in Planos net income and the receipt...
-
Currently, there are five concepts of food stands, including: hot dogs, soft pretzels, turkey legs, sandwich wraps, and funnel cakes. This approach will double the existing number of food stands...
-
Robin incurred the following capital transactions in 2021. Robin also reported a net long-term capital loss in 2020 of $2,000, which it could not use, and ordinary income of $13,000. What are the...
-
Liz had AGI of $130,000 in 2021. She donated Bluebird Corporation stock with a basis of $10,000 to a qualified charitable organization on July 5, 2021. a. What is the amount of Lizs deduction...
-
Javier is the sole proprietor of a trampoline shop. During 2021, the following transactions occurred: Unimproved land adjacent to the store was condemned by the city on February 1. The condemnation...
-
Two radio stations have the same power output from their antennas. One broadcasts AM at a frequency of \(1000 \mathrm{kHz}\) and one broadcasts FM at a frequency of \(100 \mathrm{MHz}\). Which...
-
A paramecium is covered with motile hairs called cilia that propel it at a speed of \(1 \mathrm{~mm} / \mathrm{s}\). If the paramecium has a volume of \(2 \times 10^{-13} \mathrm{~m}^{3}\) and a...
-
Photon P in Figure Q28.35 moves an electron from energy level \(n=1\) to energy level \(n=3\). The electron jumps down to \(n=2\), emitting photon \(\mathrm{Q}\), and then jumps down to \(n=1\),...

Study smarter with the SolutionInn App