

On excel Spread sheet Provide the link to the excel Any type of data, of your choice
Fantastic news! We've Found the answer you've been seeking!
Question:
On excel Spread sheet
Provide the link to the excel
Any type of data, of your choice
Transcribed Image Text:
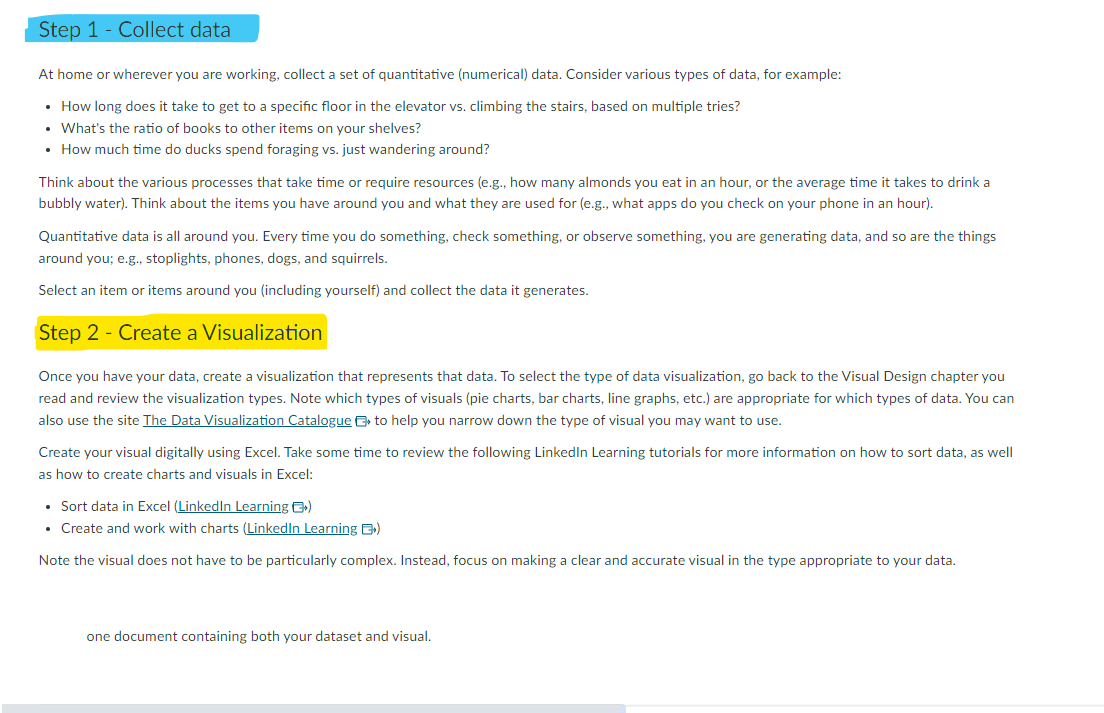
Step 1 - Collect data At home or wherever you are working, collect a set of quantitative (numerical) data. Consider various types of data, for example: How long does it take to get to a specific floor in the elevator vs. climbing the stairs, based on multiple tries? What's the ratio of books to other items on your shelves? How much time do ducks spend foraging vs. just wandering around? Think about the various processes that take time or require resources (e.g., how many almonds you eat in an hour, or the average time it takes to drink a bubbly water). Think about the items you have around you and what they are used for (e.g., what apps do you check on your phone in an hour). Quantitative data is all around you. Every time you do something, check something, or observe something, you are generating data, and so are the things around you; e.g., stoplights, phones, dogs, and squirrels. Select an item or items around you (including yourself) and collect the data it generates. Step 2 - Create a Visualization Once you have your data, create a visualization that represents that data. To select the type of data visualization, go back to the Visual Design chapter you read and review the visualization types. Note which types of visuals (pie charts, bar charts, line graphs, etc.) are appropriate for which types of data. You can also use the site The Data Visualization Catalogue to help you narrow down the type of visual you may want to use. Create your visual digitally using Excel. Take some time to review the following LinkedIn Learning tutorials for more information on how to sort data, as well as how to create charts and visuals in Excel: Sort data in Excel (LinkedIn Learning >) Create and work with charts (LinkedIn Learning E) Note the visual does not have to be particularly complex. Instead, focus on making a clear and accurate visual in the type appropriate to your data. one document containing both your dataset and visual. Step 1 - Collect data At home or wherever you are working, collect a set of quantitative (numerical) data. Consider various types of data, for example: How long does it take to get to a specific floor in the elevator vs. climbing the stairs, based on multiple tries? What's the ratio of books to other items on your shelves? How much time do ducks spend foraging vs. just wandering around? Think about the various processes that take time or require resources (e.g., how many almonds you eat in an hour, or the average time it takes to drink a bubbly water). Think about the items you have around you and what they are used for (e.g., what apps do you check on your phone in an hour). Quantitative data is all around you. Every time you do something, check something, or observe something, you are generating data, and so are the things around you; e.g., stoplights, phones, dogs, and squirrels. Select an item or items around you (including yourself) and collect the data it generates. Step 2 - Create a Visualization Once you have your data, create a visualization that represents that data. To select the type of data visualization, go back to the Visual Design chapter you read and review the visualization types. Note which types of visuals (pie charts, bar charts, line graphs, etc.) are appropriate for which types of data. You can also use the site The Data Visualization Catalogue to help you narrow down the type of visual you may want to use. Create your visual digitally using Excel. Take some time to review the following LinkedIn Learning tutorials for more information on how to sort data, as well as how to create charts and visuals in Excel: Sort data in Excel (LinkedIn Learning >) Create and work with charts (LinkedIn Learning E) Note the visual does not have to be particularly complex. Instead, focus on making a clear and accurate visual in the type appropriate to your data. one document containing both your dataset and visual.
Expert Answer:

Related Book For 
Managerial Economics
ISBN: 978-0133020267
7th edition
Authors: Paul Keat, Philip K Young, Steve Erfle
Posted Date:
Students also viewed these algorithms questions
-
Planning is one of the most important management functions in any business. A front office managers first step in planning should involve determine the departments goals. Planning also includes...
-
Q1. You have identified a market opportunity for home media players that would cater for older members of the population. Many older people have difficulty in understanding the operating principles...
-
Consider the integral I = f(x) da where f(x) is the improper rational function (i) Use long division to rewrite f as the sum of a regular polynomial and a proper rational function. (ii) Factorise the...
-
(a) Can an object be moving when its acceleration is zero? If so, give an example. (b) Can an object be accelerating when its speed is zero? If so, give an example.
-
On January 1, 2016, Perelli Company purchased 90,000 of the 100,000 outstanding shares of common stock of Singer Company as a long-term investment. The purchase price of $4,972,000 was paid in cash....
-
Regal Rooms Ltd is a rug and drapery retailer. Regal Rooms specialises in selling floor rugs and window dressings. The following information was derived from the shops accounting records for the year...
-
Eastevan Company calculated its return on investment as 10 percent. Sales are now $300,000, and the amount of total operating assets is $320,000. Required a. If expenses are reduced by $28,000 and...
-
1. What must be the betas of a portfolio with the following expected returns E (rp) = 18%, 8%, 28%, and 36%, if r = 4% and E(M) 14%? =
-
As a financial analyst at Glencolin International (GI) you have been asked to evaluate two capital investment alternatives submitted by the production department of the firm. Before beginning your...
-
Why does AM have a low efficiency when the full carrier is transmitted?
-
Role play 4: Loan process debrief and feedback In Task 23 of the Written Assignment you provided Ravi and Alice Patel with a loan to purchase a residential investment property. Following the loan...
-
Analyze Comcast Corporation by segment Comcast Corporation (CMCSA) is a global media and entertainment company with operations divided into three major segments: Cable Communications: High-speed...
-
Compute ABC Company's cost of capital based on the following information: Risk free rate: 2% Tax rate: 40% Effective interest of debt: 15% Market rate of return: 12% Beta: 1.6 FMV of preferred stock...
-
In January 2 0 0 5 , a blogger predicted that the price of coffee in ten years would be $ 4 . 3 0 . The blogger claimed his prediction would be within 4 % of the actual price of coffee in January 2 0...
-
Write a method maxMagnitude() with three integer parameters that returns the largest magnitude value. Use the method in the main program that takes three integer inputs and outputs the largest...
-
There are two significant pieces of legislation that impact maritime security in the United States. These include the Maritime Transportation Security Act 2002 and the S.A.F.E. Port Act of 2006....
-
For the vector whose polar components are (Vr = 1, Vθ = 0), compute in polars all components of the second covariant derivative Vα;μ;ν. To find...
-
It has been your secret wish to own and operate an amusement park when you can afford to make the investment. That time has now arrived. There is a large empty lot at the outskirts of Phoenix,...
-
Is there a similarity between cartel pricing and monopoly pricing?
-
Use the production matrix presented to answer the following questions. a. Determine the returns to scale for this matrix. (Start with one unit of X and one unit of Y.) b. Suppose the firm has a...
-
What is the quick (acid test) ratio? A. 0.9 B. 4.8 C. 0.8 D. 0.2 E. 1.7 Using the following balance sheet and income statement Balance sheet m Property 200 Trade payables Plant and equipment 300 Tax...
-
What is the receivables holding period? A. 21.6 days. B. 8 times. C. 19.4 days. D. 4.7 times. E. 28.2 days. Using the following balance sheet and income statement Balance sheet m Property 200 Trade...
-
The most appropriate measure of profitability from the point of view of the shareholders is: A. Return on equity. B. Return on capital employed. C. Return on non-current assets. D. Profit on sales.

Study smarter with the SolutionInn App