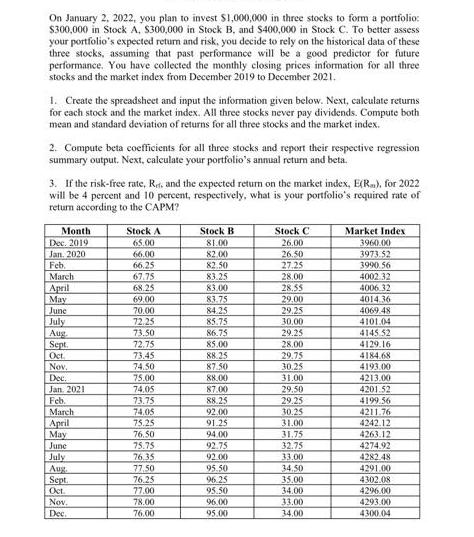
On January 2, 2022, you plan to invest $1,000,000 in three stocks to form a portfolio:...
Fantastic news! We've Found the answer you've been seeking!
Question:
Transcribed Image Text:
On January 2, 2022, you plan to invest $1,000,000 in three stocks to form a portfolio: $300,000 in Stock A, $300,000 in Stock B, and $400,000 in Stock C. To better assess your portfolio's expected return and risk, you decide to rely on the historical data of these three stocks, assuming that past performance will be a good predictor for future performance. You have collected the monthly closing prices information for all three stocks and the market index from December 2019 to December 2021. 1. Create the spreadsheet and input the information given below. Next, calculate returns for each stock and the market index. All three stocks never pay dividends. Compute both mean and standard deviation of returns for all three stocks and the market index. 2. Compute beta coefficients for all three stocks and report their respective regression summary output. Next, calculate your portfolio's annual return and beta. 3. If the risk-free rate, R. and the expected return on the market index, E(Rm), for 2022 will be 4 percent and 10 percent, respectively, what is your portfolio's required rate of return according to the CAPM? Month Dec. 2019 Jan. 2020 Feb. March April May June July Aug Sept. Oct. Nov. Dec. Jan. 2021 Feb. March April May June July Aug Sept. Oct. Nov. Dec. Stock 65.00 66.00 66.25 67.75 68.25 69.00 70.00 72.25 73.50 72.75 73.45 74.50 75.00 74.05 73.75 74.05 75.25 76.50 75.75 76.35 77.50 76.25 77.00 78.00 76.00 Stock 81.00 82.00 82.50 83.25 83.00 83.75 84.25 85.75 86.75 85.00 88.25 87.50 88.00 87.00 88.25 92.00 91.25 94.00 92.75 92.00 95.50 96.25 95.50 96.00 95.00 Stock C 26.00 26.50 27.25 28.00 28.55 29.00 29.25 30.00 29.25 28.00 29.75 30.25 31.00 29.50 29.25 30.25 31.00 31.75 32.75 33.00 34.50 35.00 34.00 33.00 34.00 Market Index 3960.00 3973.52 3990.56 4002:32 4006.32 4014.36 4069.48 4101.04 4145.52 4129.16 4184.68 4193.00 4213.00 4201.52 4199.56 4211.76 4242.12 4263.12 4274.92 4282.48 4291.00 4302.08 4296.00 4293.00 4300.04 On January 2, 2022, you plan to invest $1,000,000 in three stocks to form a portfolio: $300,000 in Stock A, $300,000 in Stock B, and $400,000 in Stock C. To better assess your portfolio's expected return and risk, you decide to rely on the historical data of these three stocks, assuming that past performance will be a good predictor for future performance. You have collected the monthly closing prices information for all three stocks and the market index from December 2019 to December 2021. 1. Create the spreadsheet and input the information given below. Next, calculate returns for each stock and the market index. All three stocks never pay dividends. Compute both mean and standard deviation of returns for all three stocks and the market index. 2. Compute beta coefficients for all three stocks and report their respective regression summary output. Next, calculate your portfolio's annual return and beta. 3. If the risk-free rate, R. and the expected return on the market index, E(Rm), for 2022 will be 4 percent and 10 percent, respectively, what is your portfolio's required rate of return according to the CAPM? Month Dec. 2019 Jan. 2020 Feb. March April May June July Aug Sept. Oct. Nov. Dec. Jan. 2021 Feb. March April May June July Aug Sept. Oct. Nov. Dec. Stock 65.00 66.00 66.25 67.75 68.25 69.00 70.00 72.25 73.50 72.75 73.45 74.50 75.00 74.05 73.75 74.05 75.25 76.50 75.75 76.35 77.50 76.25 77.00 78.00 76.00 Stock 81.00 82.00 82.50 83.25 83.00 83.75 84.25 85.75 86.75 85.00 88.25 87.50 88.00 87.00 88.25 92.00 91.25 94.00 92.75 92.00 95.50 96.25 95.50 96.00 95.00 Stock C 26.00 26.50 27.25 28.00 28.55 29.00 29.25 30.00 29.25 28.00 29.75 30.25 31.00 29.50 29.25 30.25 31.00 31.75 32.75 33.00 34.50 35.00 34.00 33.00 34.00 Market Index 3960.00 3973.52 3990.56 4002:32 4006.32 4014.36 4069.48 4101.04 4145.52 4129.16 4184.68 4193.00 4213.00 4201.52 4199.56 4211.76 4242.12 4263.12 4274.92 4282.48 4291.00 4302.08 4296.00 4293.00 4300.04
Expert Answer:
Answer rating: 100% (QA)
To calculate the returns mean and standard deviation of returns for the stocks and market index as well as the beta coefficients and portfolio return we need to organize the data in a spreadsheet and ... View the full answer
Related Book For
Fundamentals of corporate finance
ISBN: 978-0073382395
9th edition
Authors: Stephen Ross, Randolph Westerfield, Bradford Jordan
Posted Date:
Students also viewed these finance questions
-
The density function of a product is represented by 0.07e -0.07t . What is its approximate reliability after 10 years?
-
Managing Scope Changes Case Study Scope changes on a project can occur regardless of how well the project is planned or executed. Scope changes can be the result of something that was omitted during...
-
Planning is one of the most important management functions in any business. A front office managers first step in planning should involve determine the departments goals. Planning also includes...
-
The total sales (all credit) of a firm are 6,40,000. It has a gross profit margin of 15 per cent and a current ratio of 2.5. The firm's current liabilities are 96,000; inventories 48,000 and cash...
-
Chan just won the grand prize at the city lottery, which consists of $100,000 at the end of one year, $200,000 at the end of two years, and $300,000 at the end of three years. The city lottery...
-
Laredo Leather Company manufactures high-quality leather goods. The companys profits have declined during the past nine months. In an attempt to isolate the causes of poor profit performance,...
-
How do you graphically depict the OE architecture that includes detail interactions of the Higher-Order Systems and Physical Environment domains?
-
Zippy motorcycle manufacturing produces two popular pocket bikes (miniature motorcycles with 49cc engines): the Razor and the Zoomer. In the coming week, the manufacturer wants to produce a total of...
-
5. A thin insulating rod with uniformly spread positive charge Q is bent into a circle of radius R. The center of the circle is z = 0. a. Without calculation, roughly plot the magnitude of the E...
-
Here is a simplified diagram of a RF front end (power and control signals are not shown). 1. What kind of a system is it? What are the RF measurements you would use to characterize it and compare it...
-
What did you learn about the childs physical development from observing and documenting this video? What other observation methods could you have used? You have no information about the children in...
-
Indicate whether each of the following statements is true or false by writing T or F in t he a nswer c olumn. Oral or written evidence cannot legally be introduced to explain unclear portions of a...
-
Indicate whether each of the following statements is true or false by writing T or F in t he a nswer c olumn. A handwritten bill of sale may be an effective legal document.
-
Should Major League Baseball adopt a system of promotion and relegation?
-
A person to whom goods are shipped. a. bailee b. bailment c. bailor d. carriers lie n e. common c arrier f. consignee g. consignor h. constructive ba ilment i. lien j. transient
-
Carlsberg is considering a new retail lager investment in Copenhagen. Financial projections for the investment are tabulated here. The Danish corporate tax rate is 25 per cent and the investment is...
-
A marksman scores a bull's eye on 90% of his shots. (Assume the shots are independent.) (a) What is the probability he gets at least eight bull's eyes if he shoots 10 times? (b) If he shoots until he...
-
Why can wastewater treatment requirements in Hawaii be less stringent than those in most locations on the U.S. mainland?
-
A proposed cost-saving device has an installed cost of $610,000. The device will be used in a five-year project but is classified as three-year MACRS property for tax purposes. The required initial...
-
Debit and Credit Bookkeepers needs a total of $16,000 in cash during the year for transactions and other purposes. Whenever cash runs low, it sells $1,500 in securities and transfers the cash in. The...
-
For the cash flows in the previous problem, what is the NPV at a discount rate of zero percent? What if the discount rate is 10 percent? If it is 20 percent? If it is 30 percent? Data From Previous...
-
Provide an example of a data set whose histogram you would expect to be skewed to the right. Explain why you would expect the histogram to be skewed to the right.
-
Find examples of graphs in newspapers, magazines, or on the Internet that are misleading in some way. Explain how they are misleading. Then find some that present accurate comparisons and explain why...
-
In the chapter introduction, we presented gas mileage data for 2016 model year hybrid and small non-hybrid cars. We will use histograms and back-to-back stem-and-leaf plots to compare the mileages...
Study smarter with the SolutionInn App