

On the first graph, using the data from your quarter of birth in 2019, construct an AD&SRAS&LRAS
Question:
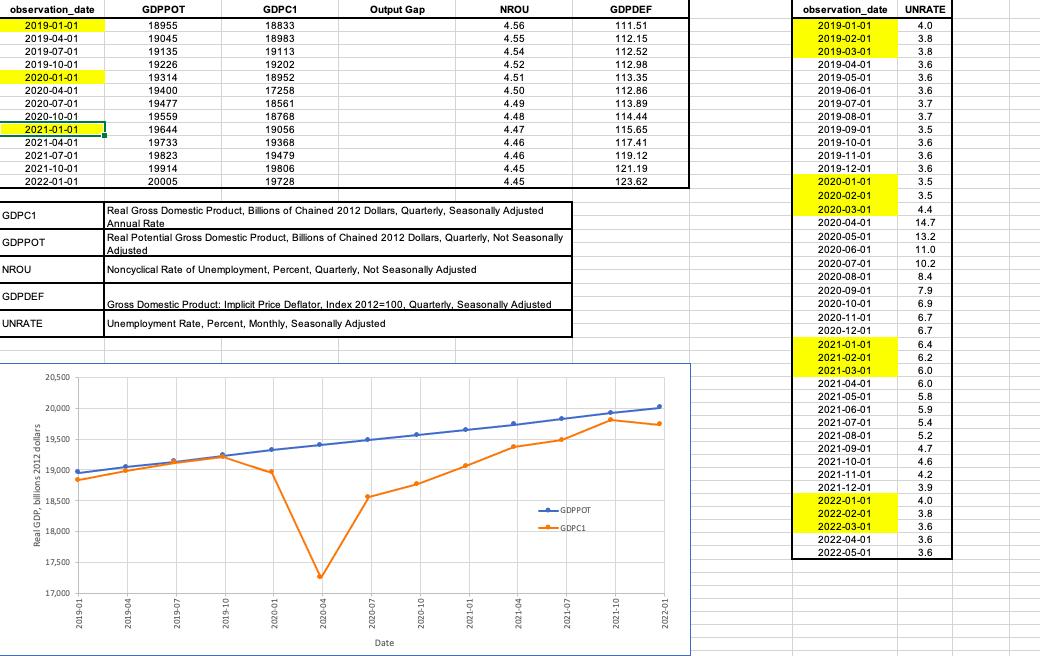
On the first graph, using the data from your quarter of birth in 2019, construct an AD&SRAS&LRAS diagram showing the Short Run Equilibrium on your birthday in 2019. MY BIRTHDAY QUARTER IS Q1 (FEB 8)
Label the value for Potential GDP (Y°) along the horizontal axis. Add the quarter to the label on the LAS curve.
Add the value for actual real GDP (yA) in the correct position relative to the value of potential GDP (yp). The horizontal axis is a number line. Place the value for real GDP either to the left or to the right of the value for potential GDP.
Add the value for the GDP deflator near the middle of the vertical axis.
Locate the (YA, P) pair you just mapped on the Graphing Template. Draw dotted lines from the horizontal and vertical axis to this point.
Expert Answer:


