Answered step by step
Verified Expert Solution
Question
1 Approved Answer
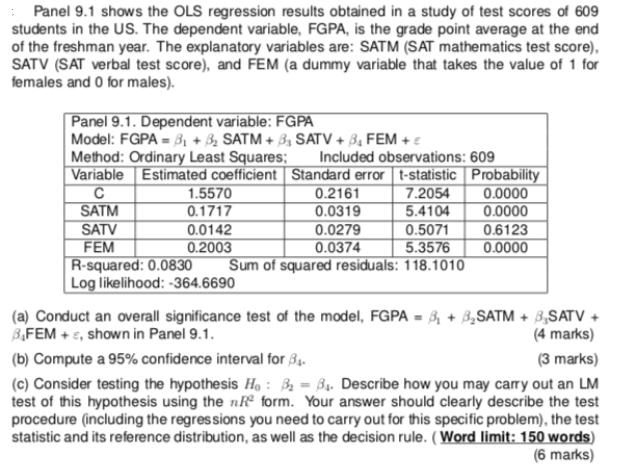
Panel 9.1 shows the OLS regression results obtained in a study of test scores of 609 students in the US. The dependent variable, FGPA,


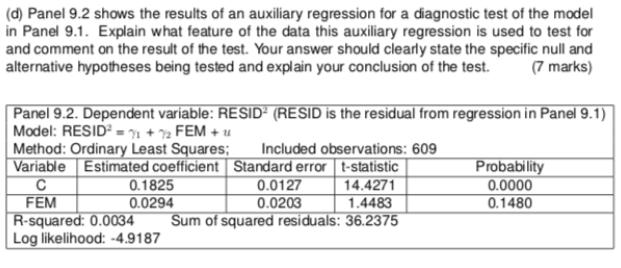
Panel 9.1 shows the OLS regression results obtained in a study of test scores of 609 students in the US. The dependent variable, FGPA, is the grade point average at the end of the freshman year. The explanatory variables are: SATM (SAT mathematics test score), SATV (SAT verbal test score), and FEM (a dummy variable that takes the value of 1 for females and 0 for males). Panel 9.1. Dependent variable: FGPA Model: FGPA = +8 SATM + 3, SATV +8 FEM + Method: Ordinary Least Squares; Variable Estimated coefficient Standard error t-statistic C 7.2054 SATM 5.4104 1.5570 0.1717 SATV FEM R-squared: 0.0830 Log likelihood: -364.6690 0.0142 0.2003 Included observations: 609 0.2161 0.0319 0.0279 0.0374 0.5071 5.3576 Sum of squared residuals: 118.1010 Probability 0.0000 0.0000 0.6123 0.0000 (a) Conduct an overall significance test of the model, FGPA = 3 + SATM + 3,SATV + 3,FEM +, shown in Panel 9.1. (4 marks) (3 marks) (b) Compute a 95% confidence interval for 3. (c) Consider testing the hypothesis Ho: 3. Describe how you may carry out an LM test of this hypothesis using the nR form. Your answer should clearly describe the test procedure (including the regressions you need to carry out for this specific problem), the test statistic its reference distribution, as well as the decision rule. (Word limit: 150 words) (6 marks) (d) Panel 9.2 shows the results of an auxiliary regression for a diagnostic test of the model in Panel 9.1. Explain what feature of the data this auxiliary regression is used to test for and comment on the result of the test. Your answer should clearly state the specific null and alternative hypotheses being tested and explain your conclusion of the test. (7 marks) Panel 9.2. Dependent variable: RESID Model: RESID=1+2 FEM + u Method: Ordinary Least Squares; Included observations: 609 Variable Estimated coefficient Standard error t-statistic C 14.4271 FEM 1.4483 R-squared: 0.0034 Sum of squared residuals: 36.2375 Log likelihood: -4.9187 0.1825 0.0294 (RESID is the residual from regression in Panel 9.1) 0.0127 0.0203 Probability 0.0000 0.1480
Step by Step Solution
★★★★★
3.36 Rating (152 Votes )
There are 3 Steps involved in it
Step: 1
1 Overall significance of model Ho B Bp0 H B 0 foratleastonej j 12p rejection of null hypot...
Get Instant Access to Expert-Tailored Solutions
See step-by-step solutions with expert insights and AI powered tools for academic success
Step: 2

Step: 3

Ace Your Homework with AI
Get the answers you need in no time with our AI-driven, step-by-step assistance
Get Started


