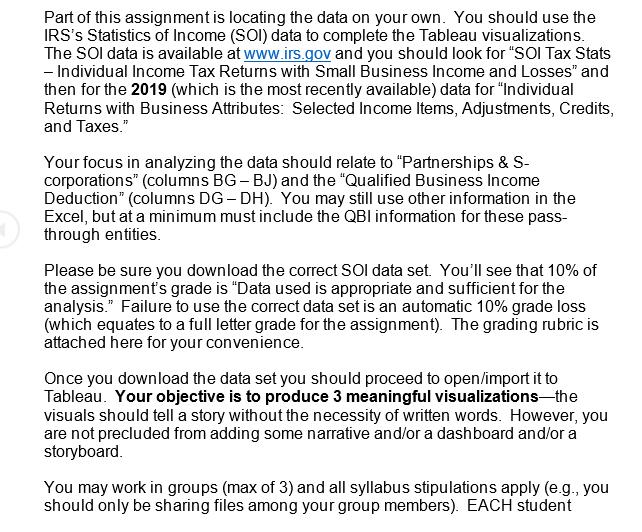
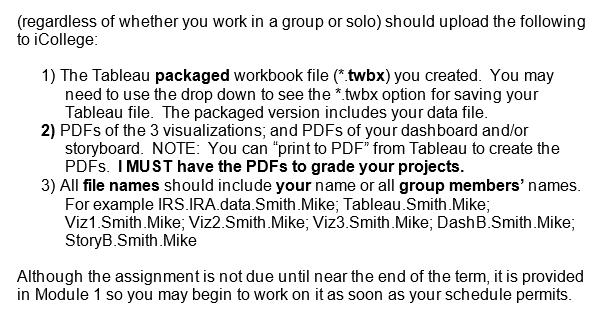
Part of this assignment is locating the data on your own. You should use the IRS's...
Fantastic news! We've Found the answer you've been seeking!
Question:
Transcribed Image Text:
Part of this assignment is locating the data on your own. You should use the IRS's Statistics of Income (SOI) data to complete the Tableau visualizations. The SOI data is available at www.irs.gov and you should look for "SOI Tax Stats - Individual Income Tax Returns with Small Business Income and Losses" and then for the 2019 (which is the most recently available) data for "Individual Returns with Business Attributes: Selected Income Items, Adjustments, Credits, and Taxes." Your focus in analyzing the data should relate to "Partnerships & S- corporations" (columns BG-BJ) and the "Qualified Business Income Deduction" (columns DG DH). You may still use other information in the Excel, but at a minimum must include the QBI information for these pass- through entities. Please be sure you download the correct SOI data set. You'll see that 10% of the assignment's grade is "Data used is appropriate and sufficient for the analysis." Failure to use the correct data set is an automatic 10% grade loss (which equates to a full letter grade for the assignment). The grading rubric is attached here for your convenience. Once you download the data set you should proceed to open/import it to Tableau. Your objective is to produce 3 meaningful visualizations-the visuals should tell a story without the necessity of written words. However, you are not precluded from adding some narrative and/or a dashboard and/or a storyboard. You may work in groups (max of 3) and all syllabus stipulations apply (e.g., you should only be sharing files among your group members). EACH student (regardless of whether you work in a group or solo) should upload the following to iCollege: 1) The Tableau packaged workbook file (*.twbx) you created. You may need to use the drop down to see the *.twbx option for saving your Tableau file. The packaged version includes your data file. 2) PDFs of the 3 visualizations; and PDFs of your dashboard and/or storyboard. NOTE: You can "print to PDF" from Tableau to create the PDFs. I MUST have the PDFs to grade your projects. 3) All file names should include your name or all group members' names. For example IRS.IRA.data. Smith Mike; Tableau.Smith.Mike; Viz1.Smith Mike; Viz2.Smith Mike; Viz3.Smith Mike; Dash B.Smith.Mike; StoryB.Smith Mike Although the assignment is not due until near the end of the term, it is provided in Module 1 so you may begin to work on it as soon as your schedule permits. Part of this assignment is locating the data on your own. You should use the IRS's Statistics of Income (SOI) data to complete the Tableau visualizations. The SOI data is available at www.irs.gov and you should look for "SOI Tax Stats - Individual Income Tax Returns with Small Business Income and Losses" and then for the 2019 (which is the most recently available) data for "Individual Returns with Business Attributes: Selected Income Items, Adjustments, Credits, and Taxes." Your focus in analyzing the data should relate to "Partnerships & S- corporations" (columns BG-BJ) and the "Qualified Business Income Deduction" (columns DG DH). You may still use other information in the Excel, but at a minimum must include the QBI information for these pass- through entities. Please be sure you download the correct SOI data set. You'll see that 10% of the assignment's grade is "Data used is appropriate and sufficient for the analysis." Failure to use the correct data set is an automatic 10% grade loss (which equates to a full letter grade for the assignment). The grading rubric is attached here for your convenience. Once you download the data set you should proceed to open/import it to Tableau. Your objective is to produce 3 meaningful visualizations-the visuals should tell a story without the necessity of written words. However, you are not precluded from adding some narrative and/or a dashboard and/or a storyboard. You may work in groups (max of 3) and all syllabus stipulations apply (e.g., you should only be sharing files among your group members). EACH student (regardless of whether you work in a group or solo) should upload the following to iCollege: 1) The Tableau packaged workbook file (*.twbx) you created. You may need to use the drop down to see the *.twbx option for saving your Tableau file. The packaged version includes your data file. 2) PDFs of the 3 visualizations; and PDFs of your dashboard and/or storyboard. NOTE: You can "print to PDF" from Tableau to create the PDFs. I MUST have the PDFs to grade your projects. 3) All file names should include your name or all group members' names. For example IRS.IRA.data. Smith Mike; Tableau.Smith.Mike; Viz1.Smith Mike; Viz2.Smith Mike; Viz3.Smith Mike; Dash B.Smith.Mike; StoryB.Smith Mike Although the assignment is not due until near the end of the term, it is provided in Module 1 so you may begin to work on it as soon as your schedule permits.
Expert Answer:
Answer rating: 100% (QA)
I understand that you need to work on a data analysis assignment using Tableau specifically with IRS SOI data for partnerships Scorporations and the Q... View the full answer
Related Book For
Discovering Advanced Algebra An Investigative Approach
ISBN: 978-1559539845
1st edition
Authors: Jerald Murdock, Ellen Kamischke, Eric Kamischke
Posted Date:
Students also viewed these mathematics questions
-
The purpose of this assignment is to conduct research related to how a specific company utilizes information related to consumer behavior, product mix or service processes, and pricing to create...
-
The learning outcome of this assignment is to understand how to conduct research on a given topic. Also, the outcome includes the application of your research about strategic human resources planning...
-
Assignment Goal The goal of this Assignment is to improve students' ability to develop applications using Java. It will help students to face potential pits and falls of real world data structure...
-
The following is a symbolic microprogram for an instruction in the computer defined in Sec. 7-3. a. Specify the operation performed when the instruction is executed. b. Convert the four...
-
Handy-Man Services is a repair-service company specializing in small household jobs. Each client pays a fixed monthly service fee based on the number of rooms in the house. Records are kept on the...
-
Regression refers to
-
Analyze the nature of ethnicity and its relationship to the nation-state.
-
Big Wave Company manufactures surf boards in a wide variety of sizes and styles. The following incomplete ledger accounts refer to transactions that are summarized for July: In addition, the...
-
2. Write a C program, problem1.c, to read in a text file, called text.txt, and build a concordance file, called concordance.txt, for the file showing the number of unique words, the unique words, and...
-
Suppose the daily demand curve for flounder at Cape May is given by QD = 1,600 - 600P, where QD is demand in pounds per day and P is price per pound. a. If fishing boats land 1,000 pounds one day,...
-
An "incident" of potentially great international importance occurred involving the Saudi Arabian consulate in Turkey this past week. First, identify what is alleged to have occurred, who it involved,...
-
3. Answer the following questions with regard to multidimensional poverty and why it is important for economic growth to bring people out of poverty. A. Briefly define the multidimensional poverty...
-
Nolan Mills uses a standard cost system. During May, Nolan manufactured 15,000 pillowcases, using 27,000 yards of fabric costing $3.05 per yard and incurring direct labor costs of $17,360 for 3,100...
-
How did you discover your Individual identity from your collective identity 1: List and 5 main elements an organization needs in order to create a company culture that promotes Diversity, Equity and...
-
Oslo Company prepared the following contribution format income statement based on a sales volume of 1,000 units (the relevant range of production is 500 units to 1,500 units): Sales $ 25,000 Variable...
-
A manufacturer reports the information below for three recent years. Variable costing income Beginning finished goods inventory (units) Ending finished goods inventory (units) Year 1 $ 113,000 0...
-
How much pure alcohol is in a 303 mL bottle of a "wine cooler" that is 4.1 percent alcohol by volume.
-
Which of the ocean zones shown would be home to each of the following organisms: lobster, coral, mussel, porpoise, and dragonfish? For those organisms you identify as living in the pelagic...
-
Solve for θ. Express your answers in radians. a. b. c. COS6 12
-
Rita is practicing darts. On this particular dartboard, she can score 20 points for a bull's- ye and 10 points, 5 points, or 1 point for the other regions. Although Rita doesn't know exactly where...
-
A ball rolls off the edge of a 12 m tall cliff at a velocity of 2 m/s. a. Write parametric equations to simulate this motion. b. What equation can you solve to determine when the ball hits the...
-
The center of the thin disk of Figure P1.22 is displaced \(15 \mathrm{~mm}\) and released. What is the maximum velocity attained by the disk, assuming no slipping between the disk and the surface?...
-
The five-blade ceiling fan of Figure P1.24 operates at \(60 \mathrm{rpm}\). The distance between the mass center of a blade and the axis of rotation is \(0.35 \mathrm{~m}\). What is its total kinetic...
-
The U-tube manometer shown in Figure P1.25 rotates about axis \(A-A\) at a speed of \(40 \mathrm{rad} / \mathrm{s}\). At the instant shown, the column of liquid moves with a speed of \(20 \mathrm{~m}...
Study smarter with the SolutionInn App