

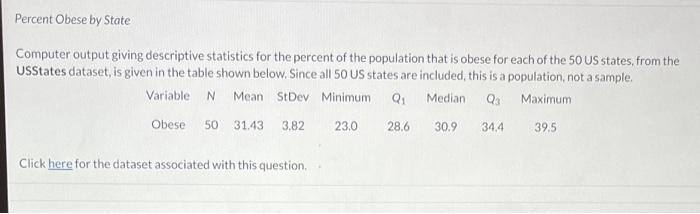
Percent Obese by State Computer output giving descriptive statistics for the percent of the population that...
Fantastic news! We've Found the answer you've been seeking!
Question:
![(a) What are the mean and the standard deviation? [ mu= ]](https://dsd5zvtm8ll6.cloudfront.net/si.experts.images/questions/2022/09/63354c20b6522_1664437516668.png)
Expert Answer:

Related Book For 

Statistics Unlocking the Power of Data
ISBN: 978-1118583104
1st edition
Authors: Robin H. Lock, Patti Frazer Lock, Kari Lock Morgan, Eric F. Lock, Dennis F. Lock
Posted Date:
