

Perform all computations in the script below. Only display the output requested below (suppress display of...
Fantastic news! We've Found the answer you've been seeking!
Question:
Transcribed Image Text:
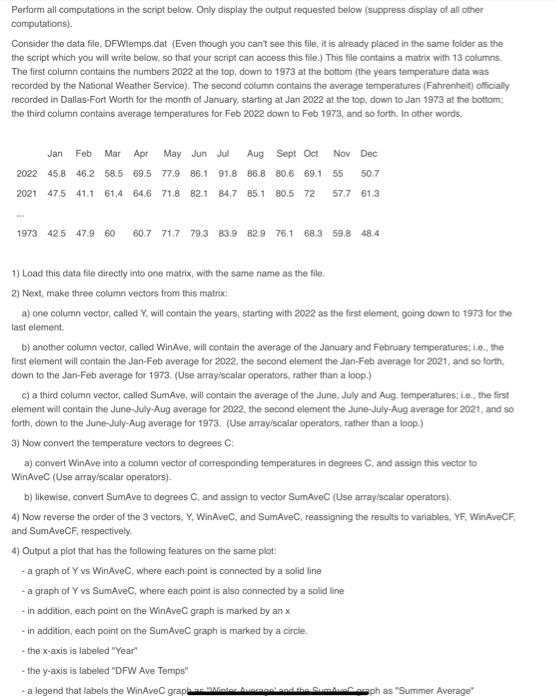
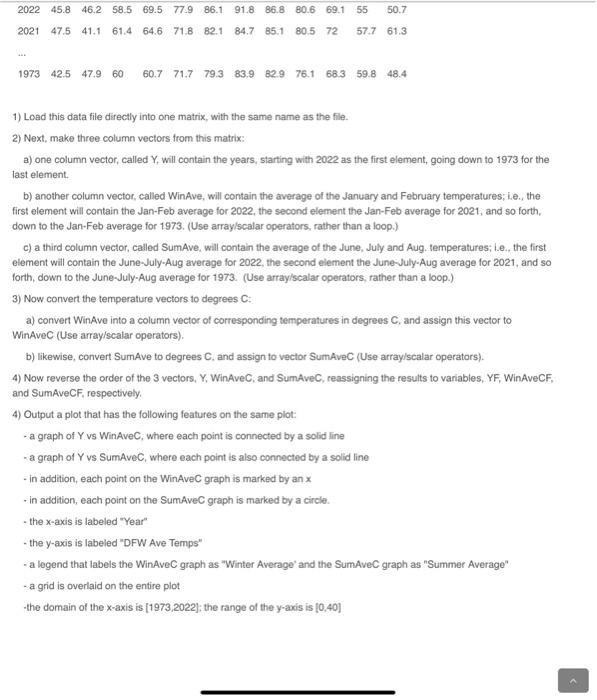
Perform all computations in the script below. Only display the output requested below (suppress display of all other computations). Consider the data file, DFWtemps.dat (Even though you can't see this file, it is already placed in the same folder as the the script which you will write below, so that your script can access this file.) This file contains a matrix with 13 columns. The first column contains the numbers 2022 at the top, down to 1973 at the bottom (the years temperature data was recorded by the National Weather Service). The second column contains the average temperatures (Fahrenheit) officially recorded in Dallas-Fort Worth for the month of January, starting at Jan 2022 at the top, down to Jan 1973 at the bottom: the third column contains average temperatures for Feb 2022 down to Feb 1973, and so forth. In other words, Jan Feb Mar Apr May Jun Jul Aug Sept Oct Nov Dec 2022 45.8 46.2 58.5 69.5 77.9 86.1 91.8 86.8 80.6 69.1 55 50.7 2021 47.5 41.1 61.4 64.6 71.8 82.1 84.7 85.1 80.5 72 57.7 61.3 1973 42.5 47.9 60 60.7 71.7 79.3 83.9 82.9 76.1 68.3 59.8 48.4 1) Load this data file directly into one matrix, with the same name as the file. 2) Next, make three column vectors from this matrix: a) one column vector, called Y, will contain the years, starting with 2022 as the first element, going down to 1973 for the last element. b) another column vector, called WinAve, will contain the average of the January and February temperatures; i.e., the first element will contain the Jan-Feb average for 2022, the second element the Jan-Feb average for 2021, and so forth, down to the Jan-Feb average for 1973. (Use array/scalar operators, rather than a loop.) c) a third column vector, called SumAve, will contain the average of the June, July and Aug. temperatures; ie, the first element will contain the June-July-Aug average for 2022, the second element the June-July-Aug average for 2021, and so forth, down to the June-July-Aug average for 1973. (Use array/scalar operators, rather than a loop.) 3) Now convert the temperature vectors to degrees C: a) convert WinAve into a column vector of corresponding temperatures in degrees C, and assign this vector to WinAvec (Use array/scalar operators). b) likewise, convert SumAve to degrees C, and assign to vector SumAvec (Use array/scalar operators). 4) Now reverse the order of the 3 vectors, Y, WinAveC, and SumAveC, reassigning the results to variables, YF, Win AveCF, and SumAveCF, respectively. 4) Output a plot that has the following features on the same plot: - a graph of Y vs WinAveC, where each point is connected by a solid line - a graph of Y vs SumAveC, where each point is also connected by a solid line - in addition, each point on the WinAvec graph is marked by an x - in addition, each point on the SumAvec graph is marked by a circle. - the x-axis is labeled "Year" - the y-axis is labeled "DFW Ave Temps" - a legend that labels the WinAvec grapha Moter Auerngel Ausal ph as "Summer Average" 2022 45.8 46.2 58.5 69.5 77.9 86.1 91.8 86.8 80.6 69.1 55 50.7 2021 47.5 41.1 61.4 64.6 71.8 82.1 84.7 85.1 80.5 72 57.7 61.3 1973 42.5 47.9 60 60.7 71.7 79.3 83.9 82.9 76.1 68.3 59.8 48.4 1) Load this data file directly into one matrix, with the same name as the file. 2) Next, make three column vectors from this matrix: a) one column vector, called Y, will contain the years, starting with 2022 as the first element, going down to 1973 for the last element. b) another column vector, called WinAve, will contain the average of the January and February temperatures; i.e., the first element will contain the Jan-Feb average for 2022, the second element the Jan-Feb average for 2021, and so forth, down to the Jan-Feb average for 1973. (Use array/scalar operators, rather than a loop.) c) a third column vector, called SumAve, will contain the average of the June, July and Aug. temperatures; i.e., the first element will contain the June-July-Aug average for 2022, the second element the June-July-Aug average for 2021, and so forth, down to the June-July-Aug average for 1973. (Use array/scalar operators, rather than a loop.) 3) Now convert the temperature vectors to degrees C: a) convert WinAve into a column vector of corresponding temperatures in degrees C, and assign this vector to WinAvec (Use array/scalar operators). b) likewise, convert SumAve to degrees C. and assign to vector SumAvec (Use array/scalar operators). 4) Now reverse the order of the 3 vectors, Y, WinAveC, and SumAveC, reassigning the results to variables, YF, WinAveCF, and SumAveCF, respectively. 4) Output a plot that has the following features on the same plot: - a graph of Y vs WinAveC, where each point is connected by a solid line - a graph of Y vs SumAveC, where each point is also connected by a solid line - in addition, each point on the WinAvec graph is marked by an x - in addition, each point on the SumAvec graph is marked by a circle. - the x-axis is labeled "Year" - the y-axis is labeled "DFW Ave Temps" a le a legend that labels the WinAvec graph as "Winter Average and the SumAvec graph as "Summer Average" - a grid is overlaid on the entire plot -the domain of the x-axis is [1973,2022]; the range of the y-axis is [0,40] Perform all computations in the script below. Only display the output requested below (suppress display of all other computations). Consider the data file, DFWtemps.dat (Even though you can't see this file, it is already placed in the same folder as the the script which you will write below, so that your script can access this file.) This file contains a matrix with 13 columns. The first column contains the numbers 2022 at the top, down to 1973 at the bottom (the years temperature data was recorded by the National Weather Service). The second column contains the average temperatures (Fahrenheit) officially recorded in Dallas-Fort Worth for the month of January, starting at Jan 2022 at the top, down to Jan 1973 at the bottom: the third column contains average temperatures for Feb 2022 down to Feb 1973, and so forth. In other words, Jan Feb Mar Apr May Jun Jul Aug Sept Oct Nov Dec 2022 45.8 46.2 58.5 69.5 77.9 86.1 91.8 86.8 80.6 69.1 55 50.7 2021 47.5 41.1 61.4 64.6 71.8 82.1 84.7 85.1 80.5 72 57.7 61.3 1973 42.5 47.9 60 60.7 71.7 79.3 83.9 82.9 76.1 68.3 59.8 48.4 1) Load this data file directly into one matrix, with the same name as the file. 2) Next, make three column vectors from this matrix: a) one column vector, called Y, will contain the years, starting with 2022 as the first element, going down to 1973 for the last element. b) another column vector, called WinAve, will contain the average of the January and February temperatures; i.e., the first element will contain the Jan-Feb average for 2022, the second element the Jan-Feb average for 2021, and so forth, down to the Jan-Feb average for 1973. (Use array/scalar operators, rather than a loop.) c) a third column vector, called SumAve, will contain the average of the June, July and Aug. temperatures; ie, the first element will contain the June-July-Aug average for 2022, the second element the June-July-Aug average for 2021, and so forth, down to the June-July-Aug average for 1973. (Use array/scalar operators, rather than a loop.) 3) Now convert the temperature vectors to degrees C: a) convert WinAve into a column vector of corresponding temperatures in degrees C, and assign this vector to WinAvec (Use array/scalar operators). b) likewise, convert SumAve to degrees C, and assign to vector SumAvec (Use array/scalar operators). 4) Now reverse the order of the 3 vectors, Y, WinAveC, and SumAveC, reassigning the results to variables, YF, Win AveCF, and SumAveCF, respectively. 4) Output a plot that has the following features on the same plot: - a graph of Y vs WinAveC, where each point is connected by a solid line - a graph of Y vs SumAveC, where each point is also connected by a solid line - in addition, each point on the WinAvec graph is marked by an x - in addition, each point on the SumAvec graph is marked by a circle. - the x-axis is labeled "Year" - the y-axis is labeled "DFW Ave Temps" - a legend that labels the WinAvec grapha Moter Auerngel Ausal ph as "Summer Average" 2022 45.8 46.2 58.5 69.5 77.9 86.1 91.8 86.8 80.6 69.1 55 50.7 2021 47.5 41.1 61.4 64.6 71.8 82.1 84.7 85.1 80.5 72 57.7 61.3 1973 42.5 47.9 60 60.7 71.7 79.3 83.9 82.9 76.1 68.3 59.8 48.4 1) Load this data file directly into one matrix, with the same name as the file. 2) Next, make three column vectors from this matrix: a) one column vector, called Y, will contain the years, starting with 2022 as the first element, going down to 1973 for the last element. b) another column vector, called WinAve, will contain the average of the January and February temperatures; i.e., the first element will contain the Jan-Feb average for 2022, the second element the Jan-Feb average for 2021, and so forth, down to the Jan-Feb average for 1973. (Use array/scalar operators, rather than a loop.) c) a third column vector, called SumAve, will contain the average of the June, July and Aug. temperatures; i.e., the first element will contain the June-July-Aug average for 2022, the second element the June-July-Aug average for 2021, and so forth, down to the June-July-Aug average for 1973. (Use array/scalar operators, rather than a loop.) 3) Now convert the temperature vectors to degrees C: a) convert WinAve into a column vector of corresponding temperatures in degrees C, and assign this vector to WinAvec (Use array/scalar operators). b) likewise, convert SumAve to degrees C. and assign to vector SumAvec (Use array/scalar operators). 4) Now reverse the order of the 3 vectors, Y, WinAveC, and SumAveC, reassigning the results to variables, YF, WinAveCF, and SumAveCF, respectively. 4) Output a plot that has the following features on the same plot: - a graph of Y vs WinAveC, where each point is connected by a solid line - a graph of Y vs SumAveC, where each point is also connected by a solid line - in addition, each point on the WinAvec graph is marked by an x - in addition, each point on the SumAvec graph is marked by a circle. - the x-axis is labeled "Year" - the y-axis is labeled "DFW Ave Temps" a le a legend that labels the WinAvec graph as "Winter Average and the SumAvec graph as "Summer Average" - a grid is overlaid on the entire plot -the domain of the x-axis is [1973,2022]; the range of the y-axis is [0,40]
Expert Answer:
Answer rating: 100% (QA)
Below is a Python script that performs the computations described import numpy as np import ... View the full answer

Related Book For 

Income Tax Fundamentals 2013
ISBN: 9781285586618
31st Edition
Authors: Gerald E. Whittenburg, Martha Altus Buller, Steven L Gill
Posted Date:
Students also viewed these programming questions
-
7. Ferris Company's beginning inventory balance and transactions for January are as follows: Purchases Sales Date Jan. 01 (balance) Units Unit Cost Date Units 8,000 $ 8.00 Jan. 05 4,000 Jan. 10 Jan....
-
If the GST rate increased from 5 percent to 6 percent.How would you modify the data file so that the correct amounts were charged for sales and purchases? Do you need to change the tax settings for...
-
As a market risk analyst, each day you calculate VaR from the available prior data. Then, you wait ten days to compare your prediction value VaRt-10 to the realised return and check if the prediction...
-
Rewrite these sentences to eliminate buzzwords and figures of speech. A. Also, through SCMC and by also gaining a membership in ISM, certification opportunities will be at your fingertips. B. The...
-
McCoy Brands Inc. (MBI) is a retailer of consumer products. The company made two acquisitions in previous years to diversify its product lines. In 2011, MBI acquired a consumer electronics firm...
-
Find all transactions in which Zaret or Betsy sold either lipstick or foundation.
-
In leaching, the final saturated raffinate often contains a significant amount of solvent. For example, this occurs in Example 14-2. How do you recover this solvent? Example 14-2 We wish to treat...
-
Bridger Bike Corp. manufactures mountain bikes and distributes them through retail outlets in Montana, Idaho, Oregon, and Washington. Bridger Bike Corp. has declared the following annual dividends...
-
Case 4 - Gambling on an Outside Fundraising Consultant for the "For the Kids" Shelter Question: From the board's position, what might be the 2 or 3 ethical issues posed by this proposal? List and...
-
If the Sommers had chosen the original 15-year, 6.25% mortgage proposal, how much tax shelter would they have lost (over the last five years) as compared to the 30-year, 7.25% mortgage?
-
An engineer at a chemical plant wishes to assess the probability of a major catastrophe occurring at the plant during the overhaul of a processor as a result of a malfunction in the equipment being...
-
Bill can finish a report in 2 hours. Maria can finish the same report in 4 hours. How long will it take them to finish the report if they work together?
-
5. A. Please rearrange the light bulks from high temperature to low temperature. 3. B. Why is this the right order? C. If you have a green light bulk, its temperature is between which two lights?
-
What is the TOTAL PRODUCTION COST? Budgeted output for the year 9800 units Standard details for one unit: Direct materials 40 square metres at 5.30 per square metre Direct wages: Bonding department...
-
4. As a scientist who was doing research on a newly found bacteria, you investigated the growth rate of the bacteria hourly. With a, a2, a3, a4 representing the population of the bacteria after the...
-
Discuss the potential risk associated the use of cloud computing in organizational information technology systems. How can these risks be mitigated in principle of management
-
GASTROCID is a commercial solt that may be composed of Na2CO3, NaHCO3and NaOH used as an ant acid medicine product... 4.55g of this sample was analyzed for percentage content of each ingredient, on...
-
For the vector whose polar components are (Vr = 1, Vθ = 0), compute in polars all components of the second covariant derivative Vα;μ;ν. To find...
-
How much of each of the following prizes or awards is taxable? a. Cheline received a $50,000 gift bag at the Oscars in 2012. b. Jon received a gold watch worth $350 for 25 years of service to his...
-
Rebecca and Walter Bunge have been married for 5 years. They live at 883 Scrub Brush Street, Apt. 52B, Las Vegas, NV 89125. Rebecca is a homemaker and Walt is a high school teacher. Rebecca's Social...
-
Abigail (Abby) Boxer is a single mother working as a civilian accountant for the U.S. Army. Her Social Security number is 676-73-3311 and she lives at 3456 Alamo Way, San Antonio, TX 78249. Helen,...
-
A Nash equilibrium is _________ because once it is established, neither firm has an incentive to change behavior.
-
Repeated games are _________ likely to lead to cooperative results than one-shot games.
-
In a(n) _________ strategy, a game participant does whatever the other participant did during the previous play.

Study smarter with the SolutionInn App