

Question No. 1 Parameters do not allow users to insert their values, which can be integers,...
Fantastic news! We've Found the answer you've been seeking!
Question:
Transcribed Image Text:
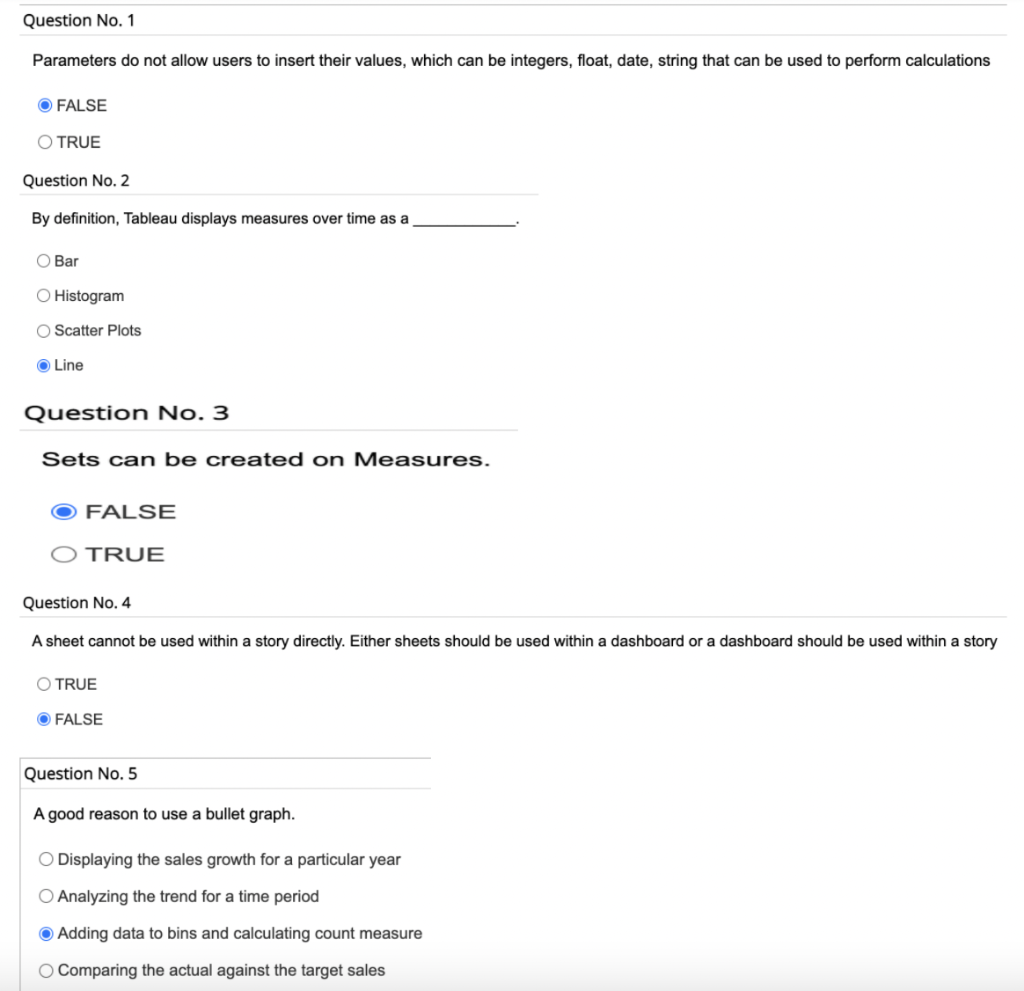
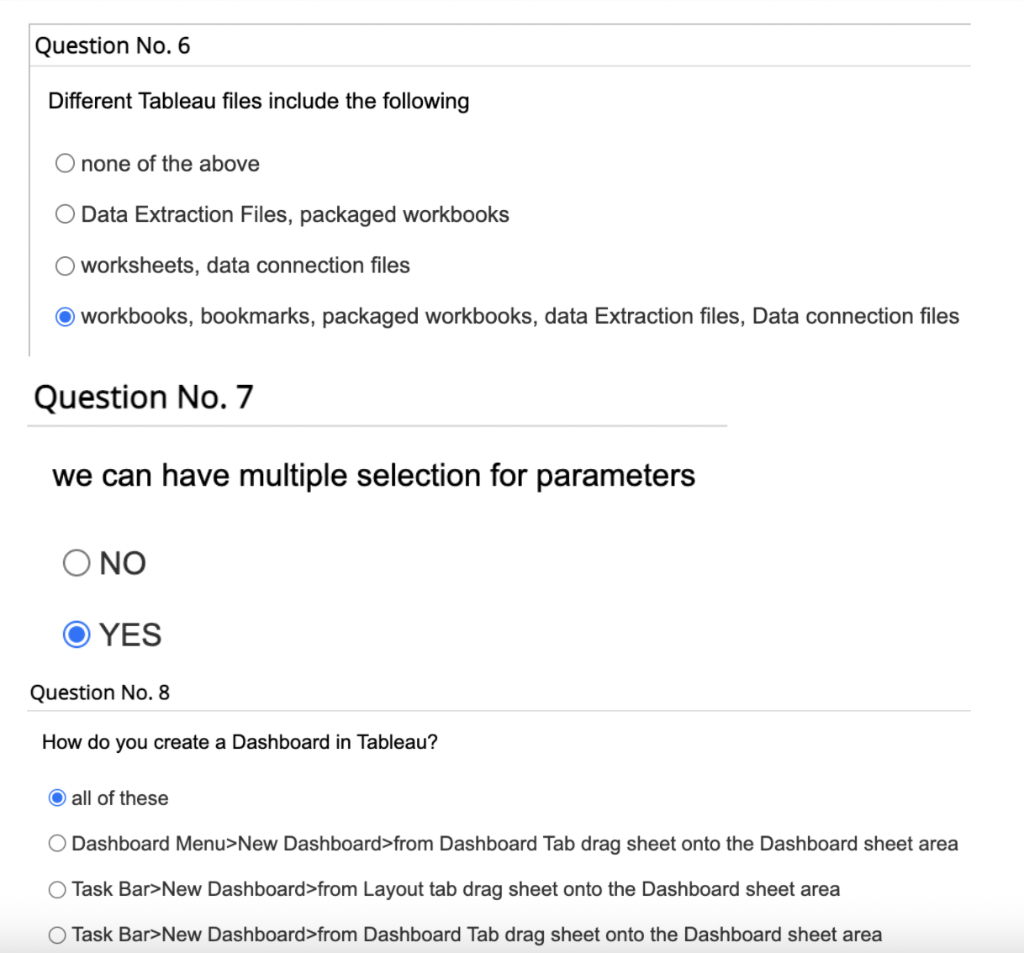
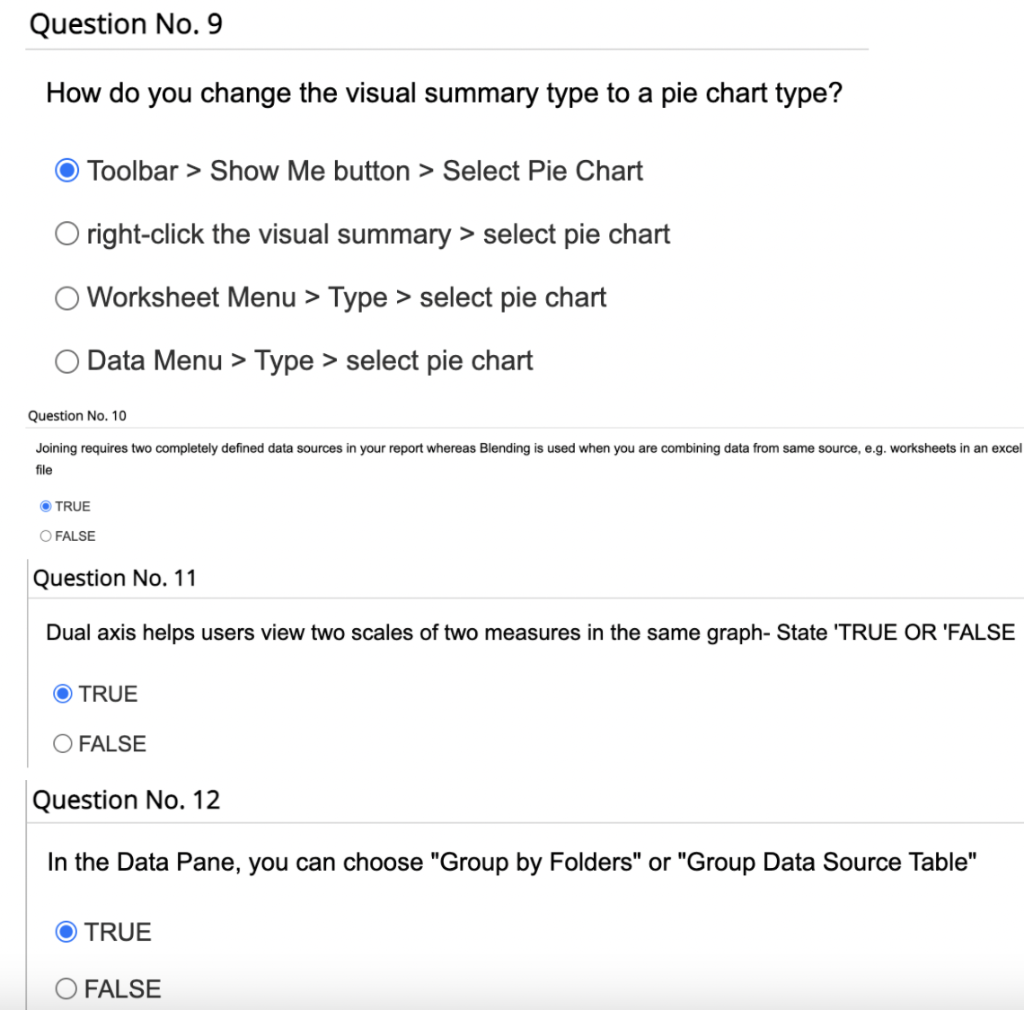
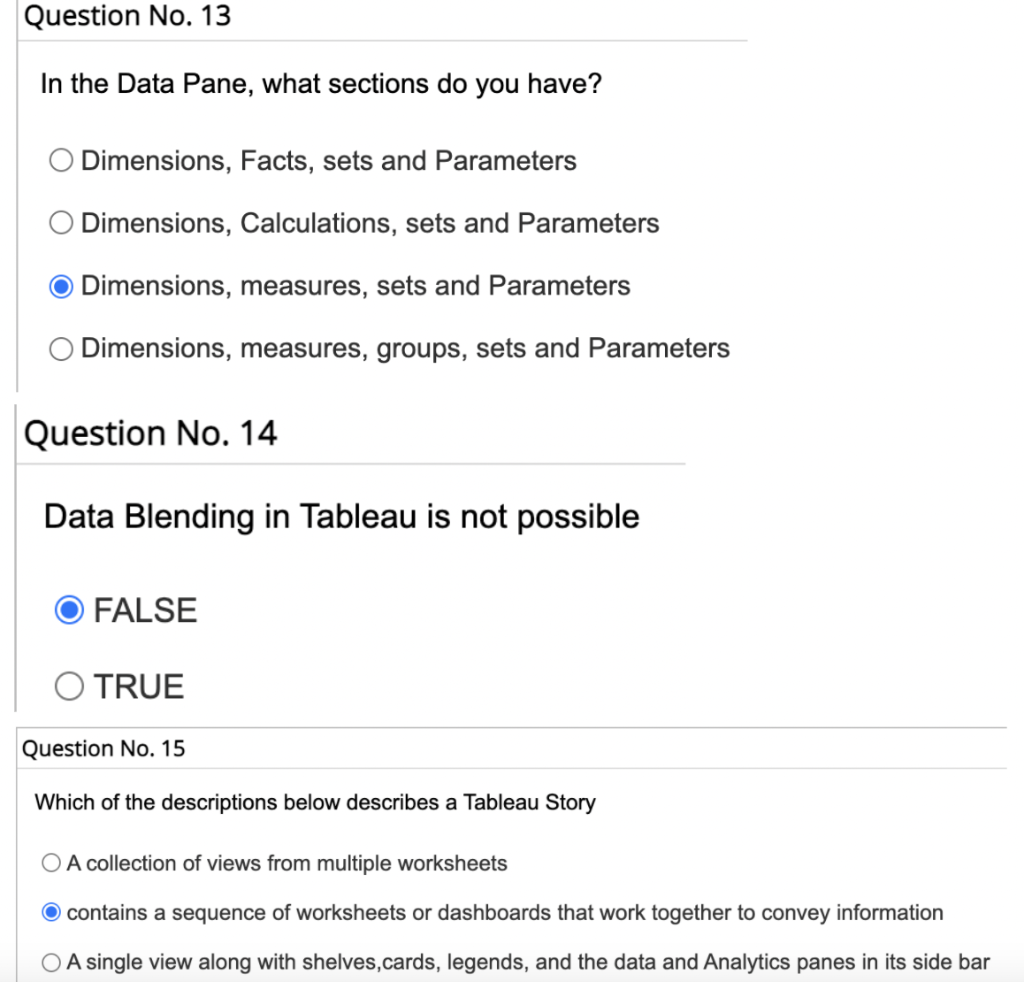
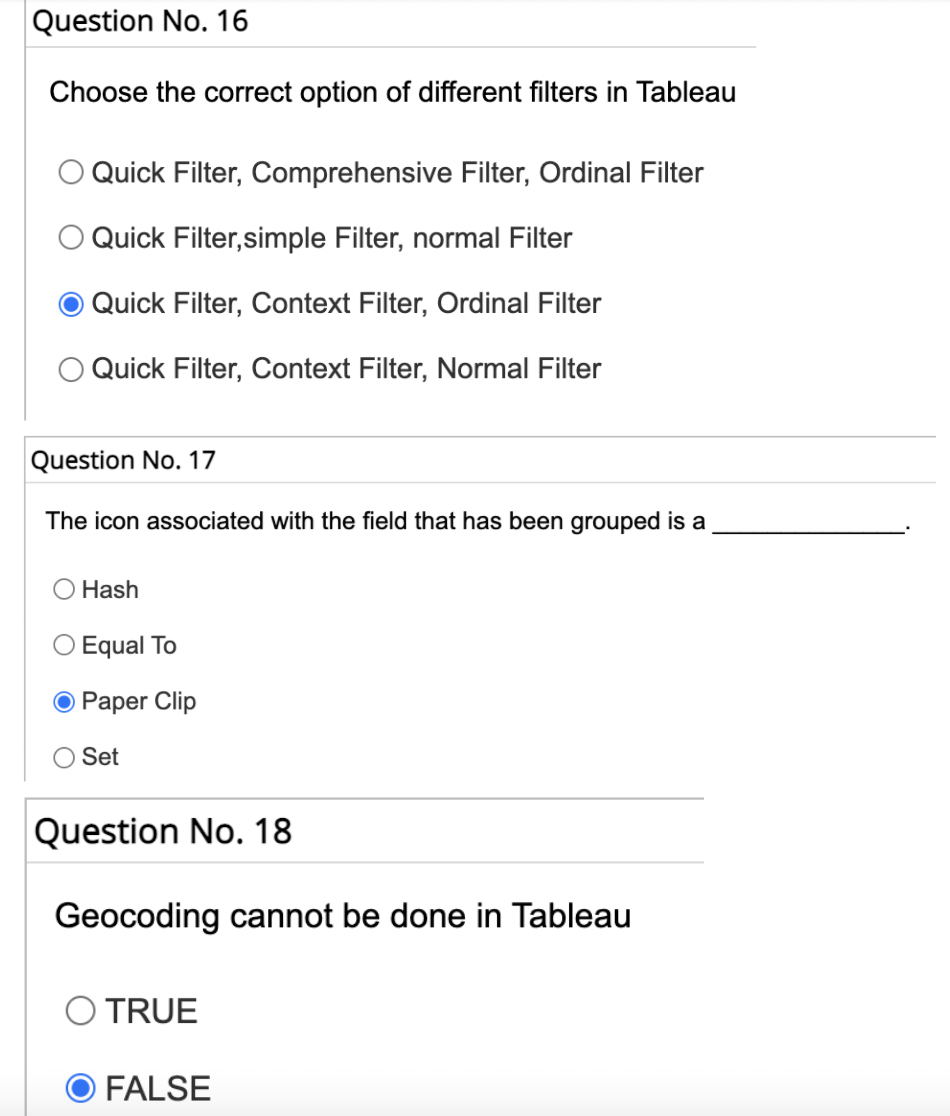
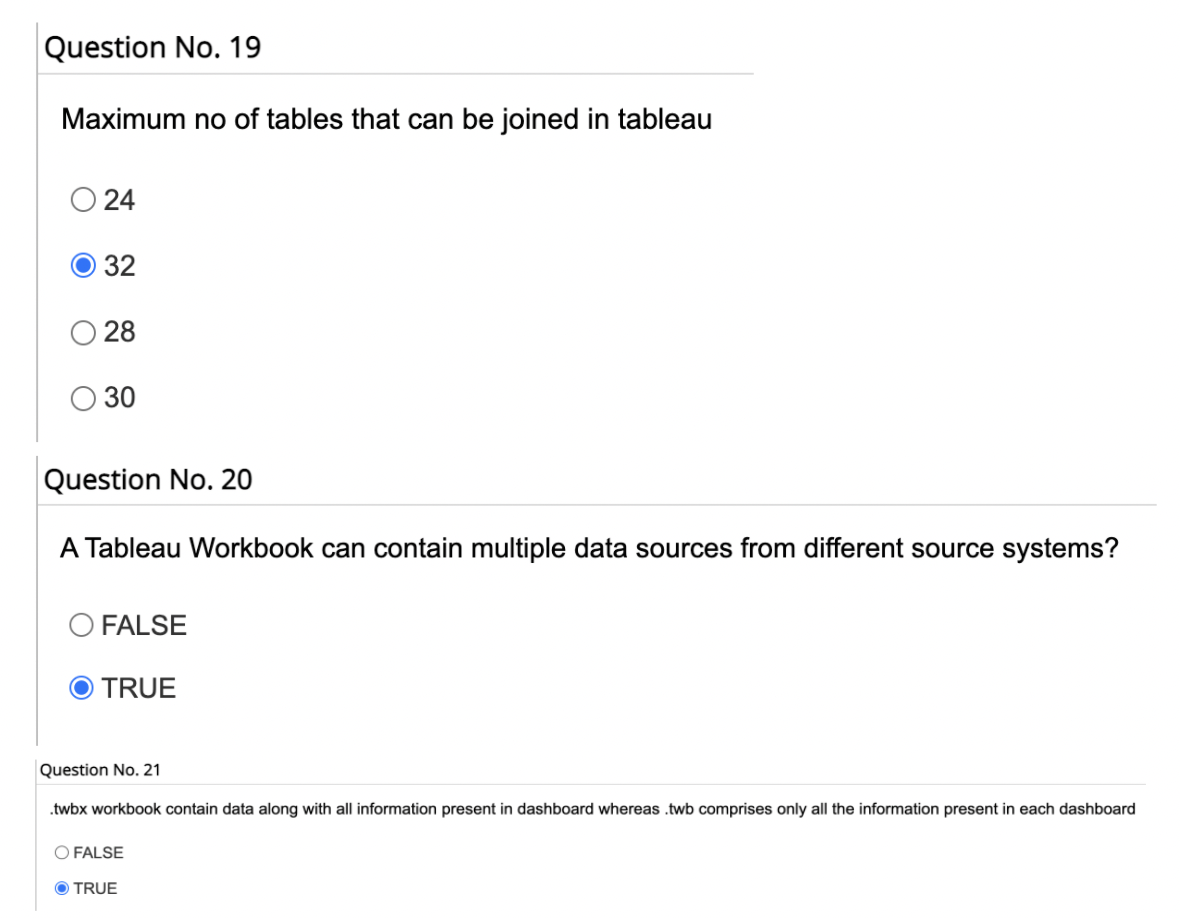
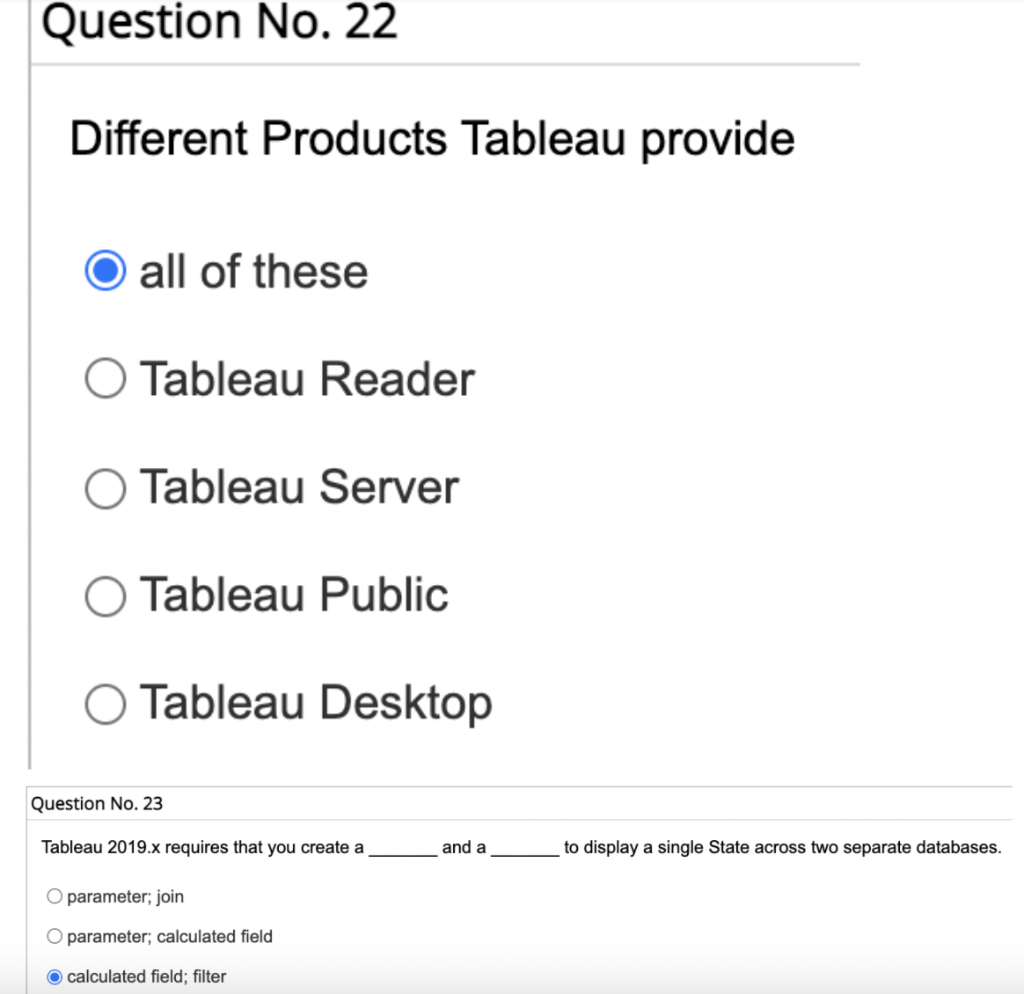
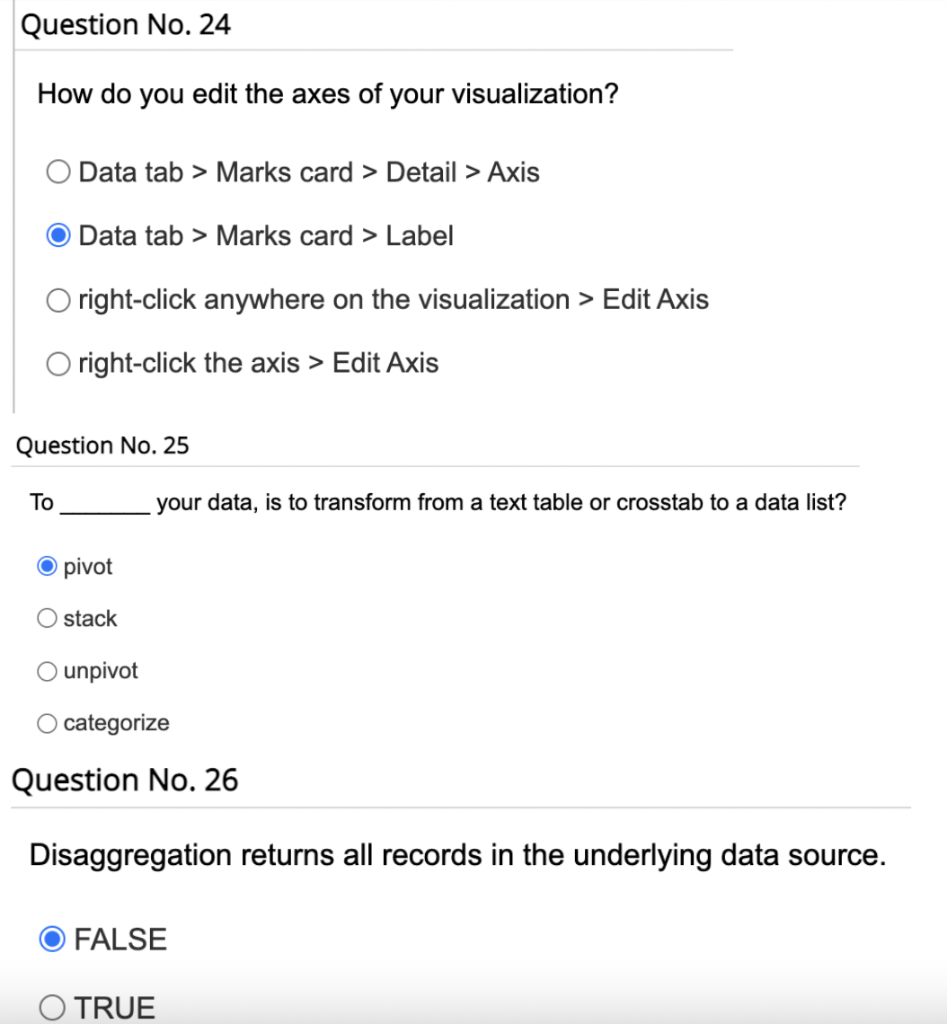
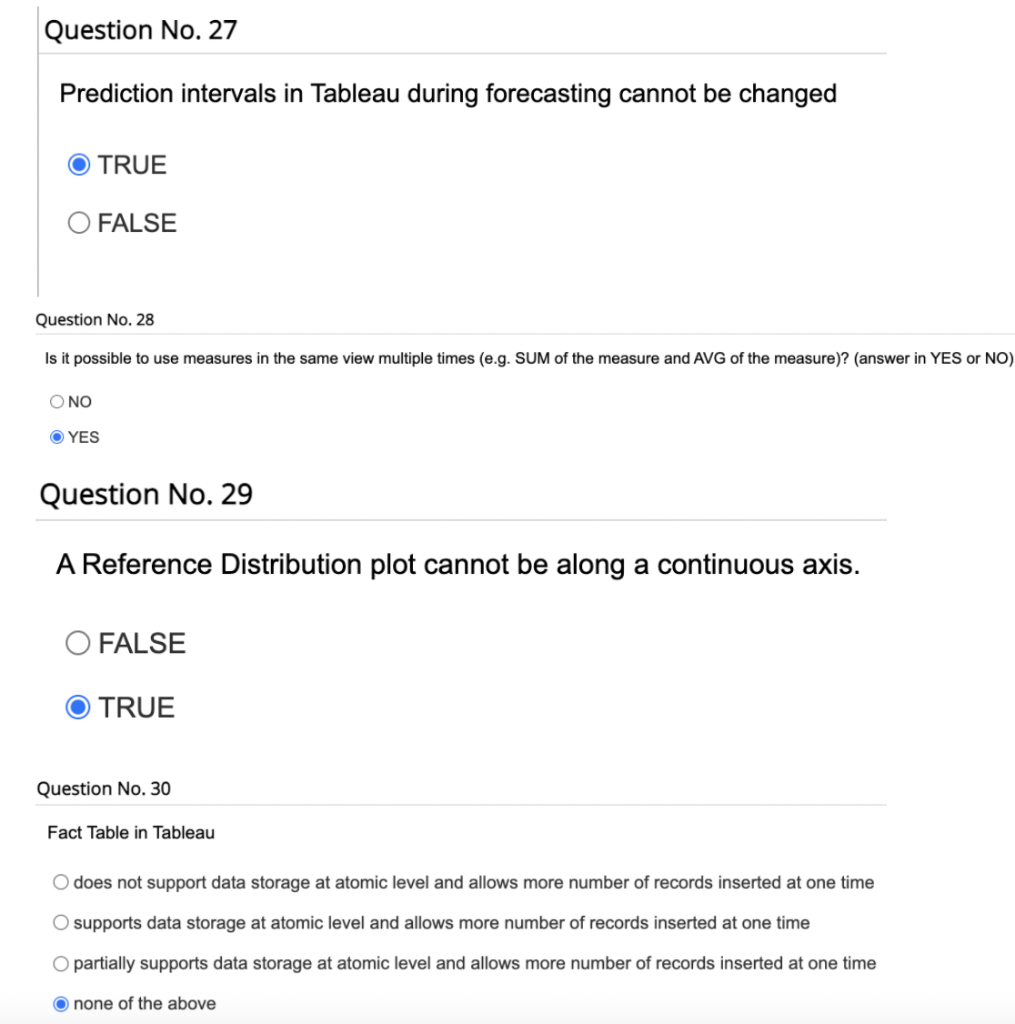
Question No. 1 Parameters do not allow users to insert their values, which can be integers, float, date, string that can be used to perform calculations FALSE O TRUE Question No. 2 By definition, Tableau displays measures over time as a O Bar O Histogram O Scatter Plots Line Question No. 3 Sets can be created on Measures. FALSE TRUE Question No. 4 A sheet cannot be used within a story directly. Either sheets should be used within a dashboard or a dashboard should be used within a story O TRUE FALSE Question No. 5 A good reason to use a bullet graph. O Displaying the sales growth for a particular year O Analyzing the trend for a time period ● Adding data to bins and calculating count measure O Comparing the actual against the target sales Question No. 6 Different Tableau files include the following O none of the above O Data Extraction Files, packaged workbooks worksheets, data connection files workbooks, bookmarks, packaged workbooks, data Extraction files, Data connection files Question No. 7 we can have multiple selection for parameters O NO YES Question No. 8 How do you create a Dashboard in Tableau? O all of these Dashboard Menu>New Dashboard>from Dashboard Tab drag sheet onto the Dashboard sheet area Task Bar>New Dashboard>from Layout tab drag sheet onto the Dashboard sheet area O Task Bar>New Dashboard>from Dashboard Tab drag sheet onto the Dashboard sheet area Question No. 9 How do you change the visual summary type to a pie chart type? Toolbar > Show Me button > Select Pie Chart O right-click the visual summary> select pie chart Worksheet Menu > Type > select pie chart Data Menu > Type> select pie chart Question No. 10 Joining requires two completely defined data sources in your report whereas Blending is used when you are combining data from same source, e.g. worksheets in an excel file TRUE O FALSE Question No. 11 Dual axis helps users view two scales of two measures in the same graph- State 'TRUE OR 'FALSE ● TRUE O FALSE Question No. 12 In the Data Pane, you can choose "Group by Folders" or "Group Data Source Table" TRUE FALSE Question No. 13 In the Data Pane, what sections do you have? Dimensions, Facts, sets and Parameters O Dimensions, Calculations, sets and Parameters Dimensions, measures, sets and Parameters O Dimensions, measures, groups, sets and Parameters Question No. 14 Data Blending in Tableau is not possible FALSE TRUE Question No. 15 Which of the descriptions below describes a Tableau Story O A collection of views from multiple worksheets contains a sequence of worksheets or dashboards that work together to convey information OA single view along with shelves,cards, legends, and the data and Analytics panes in its side bar Question No. 16 Choose the correct option of different filters in Tableau O Quick Filter, Comprehensive Filter, Ordinal Filter O Quick Filter, simple Filter, normal Filter Quick Filter, Context Filter, Ordinal Filter O Quick Filter, Context Filter, Normal Filter Question No. 17 The icon associated with the field that has been grouped is a Hash Equal To ● Paper Clip Set Question No. 18 Geocoding cannot be done in Tableau TRUE FALSE Question No. 19 Maximum no of tables that can be joined in tableau 24 32 28 O 30 Question No. 20 A Tableau Workbook can contain multiple data sources from different source systems? FALSE TRUE Question No. 21 .twbx workbook contain data along with all information present in dashboard whereas .twb comprises only all the information present in each dashboard O FALSE OTRUE Question No. 22 Different Products Tableau provide O all of these O Tableau Reader Tableau Server O Tableau Public O Tableau Desktop Question No. 23 Tableau 2019.x requires that you create a O parameter; join O parameter; calculated field O calculated field; filter and a to display a single State across two separate databases. Question No. 24 How do you edit the axes of your visualization? O Data tab > Marks card > Detail > Axis O Data tab > Marks card > Label O right-click anywhere on the visualization > Edit Axis O right-click the axis > Edit Axis Question No. 25 To O pivot stack your data, is to transform from a text table or crosstab to a data list? Ounpivot O categorize Question No. 26 Disaggregation returns all records in the underlying data source. FALSE O TRUE Question No. 27 Prediction intervals in Tableau during forecasting cannot be changed O TRUE FALSE Question No. 28 Is it possible to use measures in the same view multiple times (e.g. SUM of the measure and AVG of the measure)? (answer in YES or NO) O NO YES Question No. 29 A Reference Distribution plot cannot be along a continuous axis. O FALSE TRUE Question No. 30 Fact Table in Tableau O does not support data storage at atomic level and allows more number of records inserted at one time O supports data storage at atomic level and allows more number of records inserted at one time O partially supports data storage at atomic level and allows more number of records inserted at one time Onone of the above Question No. 1 Parameters do not allow users to insert their values, which can be integers, float, date, string that can be used to perform calculations FALSE O TRUE Question No. 2 By definition, Tableau displays measures over time as a O Bar O Histogram O Scatter Plots Line Question No. 3 Sets can be created on Measures. FALSE TRUE Question No. 4 A sheet cannot be used within a story directly. Either sheets should be used within a dashboard or a dashboard should be used within a story O TRUE FALSE Question No. 5 A good reason to use a bullet graph. O Displaying the sales growth for a particular year O Analyzing the trend for a time period ● Adding data to bins and calculating count measure O Comparing the actual against the target sales Question No. 6 Different Tableau files include the following O none of the above O Data Extraction Files, packaged workbooks worksheets, data connection files workbooks, bookmarks, packaged workbooks, data Extraction files, Data connection files Question No. 7 we can have multiple selection for parameters O NO YES Question No. 8 How do you create a Dashboard in Tableau? O all of these Dashboard Menu>New Dashboard>from Dashboard Tab drag sheet onto the Dashboard sheet area Task Bar>New Dashboard>from Layout tab drag sheet onto the Dashboard sheet area O Task Bar>New Dashboard>from Dashboard Tab drag sheet onto the Dashboard sheet area Question No. 9 How do you change the visual summary type to a pie chart type? Toolbar > Show Me button > Select Pie Chart O right-click the visual summary> select pie chart Worksheet Menu > Type > select pie chart Data Menu > Type> select pie chart Question No. 10 Joining requires two completely defined data sources in your report whereas Blending is used when you are combining data from same source, e.g. worksheets in an excel file TRUE O FALSE Question No. 11 Dual axis helps users view two scales of two measures in the same graph- State 'TRUE OR 'FALSE ● TRUE O FALSE Question No. 12 In the Data Pane, you can choose "Group by Folders" or "Group Data Source Table" TRUE FALSE Question No. 13 In the Data Pane, what sections do you have? Dimensions, Facts, sets and Parameters O Dimensions, Calculations, sets and Parameters Dimensions, measures, sets and Parameters O Dimensions, measures, groups, sets and Parameters Question No. 14 Data Blending in Tableau is not possible FALSE TRUE Question No. 15 Which of the descriptions below describes a Tableau Story O A collection of views from multiple worksheets contains a sequence of worksheets or dashboards that work together to convey information OA single view along with shelves,cards, legends, and the data and Analytics panes in its side bar Question No. 16 Choose the correct option of different filters in Tableau O Quick Filter, Comprehensive Filter, Ordinal Filter O Quick Filter, simple Filter, normal Filter Quick Filter, Context Filter, Ordinal Filter O Quick Filter, Context Filter, Normal Filter Question No. 17 The icon associated with the field that has been grouped is a Hash Equal To ● Paper Clip Set Question No. 18 Geocoding cannot be done in Tableau TRUE FALSE Question No. 19 Maximum no of tables that can be joined in tableau 24 32 28 O 30 Question No. 20 A Tableau Workbook can contain multiple data sources from different source systems? FALSE TRUE Question No. 21 .twbx workbook contain data along with all information present in dashboard whereas .twb comprises only all the information present in each dashboard O FALSE OTRUE Question No. 22 Different Products Tableau provide O all of these O Tableau Reader Tableau Server O Tableau Public O Tableau Desktop Question No. 23 Tableau 2019.x requires that you create a O parameter; join O parameter; calculated field O calculated field; filter and a to display a single State across two separate databases. Question No. 24 How do you edit the axes of your visualization? O Data tab > Marks card > Detail > Axis O Data tab > Marks card > Label O right-click anywhere on the visualization > Edit Axis O right-click the axis > Edit Axis Question No. 25 To O pivot stack your data, is to transform from a text table or crosstab to a data list? Ounpivot O categorize Question No. 26 Disaggregation returns all records in the underlying data source. FALSE O TRUE Question No. 27 Prediction intervals in Tableau during forecasting cannot be changed O TRUE FALSE Question No. 28 Is it possible to use measures in the same view multiple times (e.g. SUM of the measure and AVG of the measure)? (answer in YES or NO) O NO YES Question No. 29 A Reference Distribution plot cannot be along a continuous axis. O FALSE TRUE Question No. 30 Fact Table in Tableau O does not support data storage at atomic level and allows more number of records inserted at one time O supports data storage at atomic level and allows more number of records inserted at one time O partially supports data storage at atomic level and allows more number of records inserted at one time Onone of the above Question No. 1 Parameters do not allow users to insert their values, which can be integers, float, date, string that can be used to perform calculations FALSE O TRUE Question No. 2 By definition, Tableau displays measures over time as a O Bar O Histogram O Scatter Plots Line Question No. 3 Sets can be created on Measures. FALSE TRUE Question No. 4 A sheet cannot be used within a story directly. Either sheets should be used within a dashboard or a dashboard should be used within a story O TRUE FALSE Question No. 5 A good reason to use a bullet graph. O Displaying the sales growth for a particular year O Analyzing the trend for a time period ● Adding data to bins and calculating count measure O Comparing the actual against the target sales Question No. 6 Different Tableau files include the following O none of the above O Data Extraction Files, packaged workbooks worksheets, data connection files workbooks, bookmarks, packaged workbooks, data Extraction files, Data connection files Question No. 7 we can have multiple selection for parameters O NO YES Question No. 8 How do you create a Dashboard in Tableau? O all of these Dashboard Menu>New Dashboard>from Dashboard Tab drag sheet onto the Dashboard sheet area Task Bar>New Dashboard>from Layout tab drag sheet onto the Dashboard sheet area O Task Bar>New Dashboard>from Dashboard Tab drag sheet onto the Dashboard sheet area Question No. 9 How do you change the visual summary type to a pie chart type? Toolbar > Show Me button > Select Pie Chart O right-click the visual summary> select pie chart Worksheet Menu > Type > select pie chart Data Menu > Type> select pie chart Question No. 10 Joining requires two completely defined data sources in your report whereas Blending is used when you are combining data from same source, e.g. worksheets in an excel file TRUE O FALSE Question No. 11 Dual axis helps users view two scales of two measures in the same graph- State 'TRUE OR 'FALSE ● TRUE O FALSE Question No. 12 In the Data Pane, you can choose "Group by Folders" or "Group Data Source Table" TRUE FALSE Question No. 13 In the Data Pane, what sections do you have? Dimensions, Facts, sets and Parameters O Dimensions, Calculations, sets and Parameters Dimensions, measures, sets and Parameters O Dimensions, measures, groups, sets and Parameters Question No. 14 Data Blending in Tableau is not possible FALSE TRUE Question No. 15 Which of the descriptions below describes a Tableau Story O A collection of views from multiple worksheets contains a sequence of worksheets or dashboards that work together to convey information OA single view along with shelves,cards, legends, and the data and Analytics panes in its side bar Question No. 16 Choose the correct option of different filters in Tableau O Quick Filter, Comprehensive Filter, Ordinal Filter O Quick Filter, simple Filter, normal Filter Quick Filter, Context Filter, Ordinal Filter O Quick Filter, Context Filter, Normal Filter Question No. 17 The icon associated with the field that has been grouped is a Hash Equal To ● Paper Clip Set Question No. 18 Geocoding cannot be done in Tableau TRUE FALSE Question No. 19 Maximum no of tables that can be joined in tableau 24 32 28 O 30 Question No. 20 A Tableau Workbook can contain multiple data sources from different source systems? FALSE TRUE Question No. 21 .twbx workbook contain data along with all information present in dashboard whereas .twb comprises only all the information present in each dashboard O FALSE OTRUE Question No. 22 Different Products Tableau provide O all of these O Tableau Reader Tableau Server O Tableau Public O Tableau Desktop Question No. 23 Tableau 2019.x requires that you create a O parameter; join O parameter; calculated field O calculated field; filter and a to display a single State across two separate databases. Question No. 24 How do you edit the axes of your visualization? O Data tab > Marks card > Detail > Axis O Data tab > Marks card > Label O right-click anywhere on the visualization > Edit Axis O right-click the axis > Edit Axis Question No. 25 To O pivot stack your data, is to transform from a text table or crosstab to a data list? Ounpivot O categorize Question No. 26 Disaggregation returns all records in the underlying data source. FALSE O TRUE Question No. 27 Prediction intervals in Tableau during forecasting cannot be changed O TRUE FALSE Question No. 28 Is it possible to use measures in the same view multiple times (e.g. SUM of the measure and AVG of the measure)? (answer in YES or NO) O NO YES Question No. 29 A Reference Distribution plot cannot be along a continuous axis. O FALSE TRUE Question No. 30 Fact Table in Tableau O does not support data storage at atomic level and allows more number of records inserted at one time O supports data storage at atomic level and allows more number of records inserted at one time O partially supports data storage at atomic level and allows more number of records inserted at one time Onone of the above Question No. 1 Parameters do not allow users to insert their values, which can be integers, float, date, string that can be used to perform calculations FALSE O TRUE Question No. 2 By definition, Tableau displays measures over time as a O Bar O Histogram O Scatter Plots Line Question No. 3 Sets can be created on Measures. FALSE TRUE Question No. 4 A sheet cannot be used within a story directly. Either sheets should be used within a dashboard or a dashboard should be used within a story O TRUE FALSE Question No. 5 A good reason to use a bullet graph. O Displaying the sales growth for a particular year O Analyzing the trend for a time period ● Adding data to bins and calculating count measure O Comparing the actual against the target sales Question No. 6 Different Tableau files include the following O none of the above O Data Extraction Files, packaged workbooks worksheets, data connection files workbooks, bookmarks, packaged workbooks, data Extraction files, Data connection files Question No. 7 we can have multiple selection for parameters O NO YES Question No. 8 How do you create a Dashboard in Tableau? O all of these Dashboard Menu>New Dashboard>from Dashboard Tab drag sheet onto the Dashboard sheet area Task Bar>New Dashboard>from Layout tab drag sheet onto the Dashboard sheet area O Task Bar>New Dashboard>from Dashboard Tab drag sheet onto the Dashboard sheet area Question No. 9 How do you change the visual summary type to a pie chart type? Toolbar > Show Me button > Select Pie Chart O right-click the visual summary> select pie chart Worksheet Menu > Type > select pie chart Data Menu > Type> select pie chart Question No. 10 Joining requires two completely defined data sources in your report whereas Blending is used when you are combining data from same source, e.g. worksheets in an excel file TRUE O FALSE Question No. 11 Dual axis helps users view two scales of two measures in the same graph- State 'TRUE OR 'FALSE ● TRUE O FALSE Question No. 12 In the Data Pane, you can choose "Group by Folders" or "Group Data Source Table" TRUE FALSE Question No. 13 In the Data Pane, what sections do you have? Dimensions, Facts, sets and Parameters O Dimensions, Calculations, sets and Parameters Dimensions, measures, sets and Parameters O Dimensions, measures, groups, sets and Parameters Question No. 14 Data Blending in Tableau is not possible FALSE TRUE Question No. 15 Which of the descriptions below describes a Tableau Story O A collection of views from multiple worksheets contains a sequence of worksheets or dashboards that work together to convey information OA single view along with shelves,cards, legends, and the data and Analytics panes in its side bar Question No. 16 Choose the correct option of different filters in Tableau O Quick Filter, Comprehensive Filter, Ordinal Filter O Quick Filter, simple Filter, normal Filter Quick Filter, Context Filter, Ordinal Filter O Quick Filter, Context Filter, Normal Filter Question No. 17 The icon associated with the field that has been grouped is a Hash Equal To ● Paper Clip Set Question No. 18 Geocoding cannot be done in Tableau TRUE FALSE Question No. 19 Maximum no of tables that can be joined in tableau 24 32 28 O 30 Question No. 20 A Tableau Workbook can contain multiple data sources from different source systems? FALSE TRUE Question No. 21 .twbx workbook contain data along with all information present in dashboard whereas .twb comprises only all the information present in each dashboard O FALSE OTRUE Question No. 22 Different Products Tableau provide O all of these O Tableau Reader Tableau Server O Tableau Public O Tableau Desktop Question No. 23 Tableau 2019.x requires that you create a O parameter; join O parameter; calculated field O calculated field; filter and a to display a single State across two separate databases. Question No. 24 How do you edit the axes of your visualization? O Data tab > Marks card > Detail > Axis O Data tab > Marks card > Label O right-click anywhere on the visualization > Edit Axis O right-click the axis > Edit Axis Question No. 25 To O pivot stack your data, is to transform from a text table or crosstab to a data list? Ounpivot O categorize Question No. 26 Disaggregation returns all records in the underlying data source. FALSE O TRUE Question No. 27 Prediction intervals in Tableau during forecasting cannot be changed O TRUE FALSE Question No. 28 Is it possible to use measures in the same view multiple times (e.g. SUM of the measure and AVG of the measure)? (answer in YES or NO) O NO YES Question No. 29 A Reference Distribution plot cannot be along a continuous axis. O FALSE TRUE Question No. 30 Fact Table in Tableau O does not support data storage at atomic level and allows more number of records inserted at one time O supports data storage at atomic level and allows more number of records inserted at one time O partially supports data storage at atomic level and allows more number of records inserted at one time Onone of the above
Expert Answer:
Answer rating: 100% (QA)
The detailed answer for the above question is provided below 1 TRUE A parameter in programming allows a user to insert values into a program or function These values can be of different data types suc... View the full answer

Related Book For 
Posted Date:
Students also viewed these programming questions
-
1 A good reason to use a bullet graph. O Adding data to bins and calculating count measure O Displaying the sales growth for a particular year O Analyzing the trend for a time period Comparing the...
-
Alice's Dressings Distribution systems may evolve over time as a business grows and changes. Consider a small one-store family restaurant named Alice's, with delicious, unique, homemade salad...
-
Which scatter plot displays a regression line with a positive slope? Which displays a regression line with a negative slope? Factor X 2 Factor X
-
What are some examples of artificial selection? How are artificial selection and natural selection similar? How are they different?
-
List four guidelines to facilitate the design of good display output.
-
Find a quadratic function f having the graph shown. (1,0) (-1, 12)
-
Look over the Judicial Council form for an Abstract of Judgment in California, provided in Exhibit 18.2. Once you fill out the form, find out how you file and record it.
-
Andrew Weiman and Mei Lee are discussing accounting for income taxes. They are currently studying a schedule of taxable and deductible amounts that will arise in the future as a result of existing...
-
How can leaders leverage data-driven insights, predictive analytics, and machine learning algorithms to inform strategic decision-making processes, optimize operational efficiencies, and unlock new...
-
What are the most significant differences between the AICPA and the PCAOB standard unmodified opinion audit reports?
-
Weighted Marginal Cost of Funds.The table below provides information that can be used to estimate Northwestern National Banks weighted marginal cost of funds. The estimates represent a best-guess...
-
Nelter Corporation, which has only one product, has provided the following data concerning its most recent month of operations: Selling price Units in beginning inventory Units produced Units sold...
-
What responsibilities do companies have regarding justice and care? Should business ethics be grounded on more concrete tenets? Why or why not?
-
What is the company's position on DEI? Do they have a clear policy or initiative around it? What actions could you take to ensure a diverse, inclusive, and equitable project team is assembled? What...
-
Avicorp has a $11.7 million debt issue outstanding, with a 5.9% coupon rate. The debt has semi-annual coupons, the next coupon is due in six months, and the debt matures in five years. It is...
-
6. A sled travels down a slope and up the side. At which point does it have its greatest kinetic energy? 7. When a car crashes into another, the energy transfer goes into what? 8. The skater has a...
-
A client wants to know more about Wilson Security's services that can help them with their current security concerns. You relay the information to your Regional Manager so they can help you with the...
-
Carlton Stokes owns and operates a car-detailing business named SuperShine & Detailing. For $150, Carltons business will hand wash and wax customers cars, vacuum the interior, and thoroughly clean...
-
Create the logic for a program that prompts a user for 12 numbers and stores them in an array. Pass the array to a method that reverses the order of the numbers. Display the reversed numbers in the...
-
Assume you have written a method with the header void myMethod(num a, string b). Which of the following is a correct method call? a. MyMethod(12) b. MyMethod("Goodbye") c. MyMethod(12, "Hello") d. It...
-
Your downloadable files for Chapter 4 include a file named DEBUG04-04.jpg that contains a flowchart with syntax and/or logical errors. Examine the flowchart and then find and correct all the bugs.
-
What is the function of a steering gear?
-
A shaft running at \(1200 \mathrm{rpm}\) is connected to a second shaft by a Hooke's joint. The angle between the axes of the shafts is \(15^{\circ}\). Determine the velocity and acceleration of the...
-
Watt mechanism is capable of generating (a) approximate straight line (b) exact straight line (c) approximate circular path (d) exact circular path.

Study smarter with the SolutionInn App