

1 2 points Print References a. Complete the total revenue column from the demand-schedule data given...
Fantastic news! We've Found the answer you've been seeking!
Question:
Transcribed Image Text:
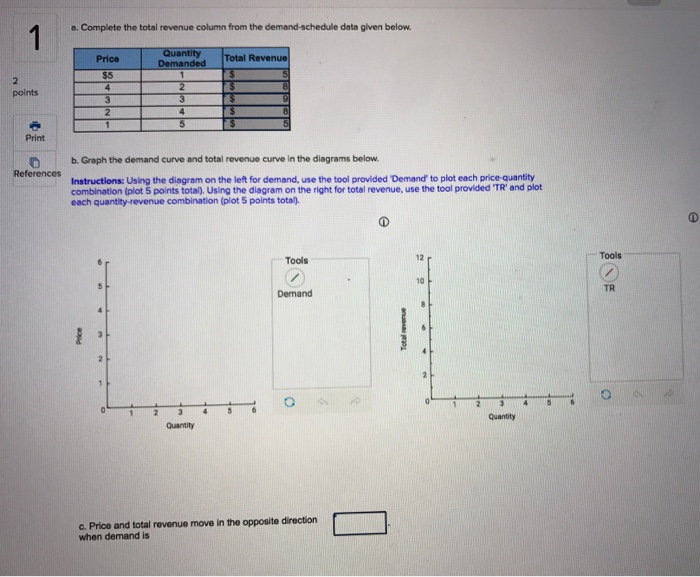
1 2 points Print References a. Complete the total revenue column from the demand-schedule data given below. Quantity Demanded 1 2 3 4 5 Price $5 4 3 2 1 2 2 b. Graph the demand curve and total revenue curve in the diagrams below. Instructions: Using the diagram on the left for demand, use the tool provided 'Demand' to plot each price-quantity combination (plot 5 points total). Using the diagram on the right for total revenue, use the tool provided 'TR' and plot each quantity-revenue combination (plot 5 points total). Quantity Total Revenue $ $ $ 4 $ $ 5 8 9 8 Tools Demand O c. Price and total revenue move in the opposite direction when demand is e Total revenue 10 2 Quantity Tools TR O 1 2 points Print References a. Complete the total revenue column from the demand-schedule data given below. Quantity Demanded 1 2 3 4 5 Price $5 4 3 2 1 2 2 b. Graph the demand curve and total revenue curve in the diagrams below. Instructions: Using the diagram on the left for demand, use the tool provided 'Demand' to plot each price-quantity combination (plot 5 points total). Using the diagram on the right for total revenue, use the tool provided 'TR' and plot each quantity-revenue combination (plot 5 points total). Quantity Total Revenue $ $ $ 4 $ $ 5 8 9 8 Tools Demand O c. Price and total revenue move in the opposite direction when demand is e Total revenue 10 2 Quantity Tools TR O 1 2 points Print References a. Complete the total revenue column from the demand-schedule data given below. Quantity Demanded 1 2 3 4 5 Price $5 4 3 2 1 2 2 b. Graph the demand curve and total revenue curve in the diagrams below. Instructions: Using the diagram on the left for demand, use the tool provided 'Demand' to plot each price-quantity combination (plot 5 points total). Using the diagram on the right for total revenue, use the tool provided 'TR' and plot each quantity-revenue combination (plot 5 points total). Quantity Total Revenue $ $ $ 4 $ $ 5 8 9 8 Tools Demand O c. Price and total revenue move in the opposite direction when demand is e Total revenue 10 2 Quantity Tools TR O 1 2 points Print References a. Complete the total revenue column from the demand-schedule data given below. Quantity Demanded 1 2 3 4 5 Price $5 4 3 2 1 2 2 b. Graph the demand curve and total revenue curve in the diagrams below. Instructions: Using the diagram on the left for demand, use the tool provided 'Demand' to plot each price-quantity combination (plot 5 points total). Using the diagram on the right for total revenue, use the tool provided 'TR' and plot each quantity-revenue combination (plot 5 points total). Quantity Total Revenue $ $ $ 4 $ $ 5 8 9 8 Tools Demand O c. Price and total revenue move in the opposite direction when demand is e Total revenue 10 2 Quantity Tools TR O 1 2 points Print References a. Complete the total revenue column from the demand-schedule data given below. Quantity Demanded 1 2 3 4 5 Price $5 4 3 2 1 2 2 b. Graph the demand curve and total revenue curve in the diagrams below. Instructions: Using the diagram on the left for demand, use the tool provided 'Demand' to plot each price-quantity combination (plot 5 points total). Using the diagram on the right for total revenue, use the tool provided 'TR' and plot each quantity-revenue combination (plot 5 points total). Quantity Total Revenue $ $ $ 4 $ $ 5 8 9 8 Tools Demand O c. Price and total revenue move in the opposite direction when demand is e Total revenue 10 2 Quantity Tools TR O 1 2 points Print References a. Complete the total revenue column from the demand-schedule data given below. Quantity Demanded 1 2 3 4 5 Price $5 4 3 2 1 2 2 b. Graph the demand curve and total revenue curve in the diagrams below. Instructions: Using the diagram on the left for demand, use the tool provided 'Demand' to plot each price-quantity combination (plot 5 points total). Using the diagram on the right for total revenue, use the tool provided 'TR' and plot each quantity-revenue combination (plot 5 points total). Quantity Total Revenue $ $ $ 4 $ $ 5 8 9 8 Tools Demand O c. Price and total revenue move in the opposite direction when demand is e Total revenue 10 2 Quantity Tools TR O 1 2 points Print References a. Complete the total revenue column from the demand-schedule data given below. Quantity Demanded 1 2 3 4 5 Price $5 4 3 2 1 2 2 b. Graph the demand curve and total revenue curve in the diagrams below. Instructions: Using the diagram on the left for demand, use the tool provided 'Demand' to plot each price-quantity combination (plot 5 points total). Using the diagram on the right for total revenue, use the tool provided 'TR' and plot each quantity-revenue combination (plot 5 points total). Quantity Total Revenue $ $ $ 4 $ $ 5 8 9 8 Tools Demand O c. Price and total revenue move in the opposite direction when demand is e Total revenue 10 2 Quantity Tools TR O 1 2 points Print References a. Complete the total revenue column from the demand-schedule data given below. Quantity Demanded 1 2 3 4 5 Price $5 4 3 2 1 2 2 b. Graph the demand curve and total revenue curve in the diagrams below. Instructions: Using the diagram on the left for demand, use the tool provided 'Demand' to plot each price-quantity combination (plot 5 points total). Using the diagram on the right for total revenue, use the tool provided 'TR' and plot each quantity-revenue combination (plot 5 points total). Quantity Total Revenue $ $ $ 4 $ $ 5 8 9 8 Tools Demand O c. Price and total revenue move in the opposite direction when demand is e Total revenue 10 2 Quantity Tools TR O 1 2 points Print References a. Complete the total revenue column from the demand-schedule data given below. Quantity Demanded 1 2 3 4 5 Price $5 4 3 2 1 2 2 b. Graph the demand curve and total revenue curve in the diagrams below. Instructions: Using the diagram on the left for demand, use the tool provided 'Demand' to plot each price-quantity combination (plot 5 points total). Using the diagram on the right for total revenue, use the tool provided 'TR' and plot each quantity-revenue combination (plot 5 points total). Quantity Total Revenue $ $ $ 4 $ $ 5 8 9 8 Tools Demand O c. Price and total revenue move in the opposite direction when demand is e Total revenue 10 2 Quantity Tools TR O 1 2 points Print References a. Complete the total revenue column from the demand-schedule data given below. Quantity Demanded 1 2 3 4 5 Price $5 4 3 2 1 2 2 b. Graph the demand curve and total revenue curve in the diagrams below. Instructions: Using the diagram on the left for demand, use the tool provided 'Demand' to plot each price-quantity combination (plot 5 points total). Using the diagram on the right for total revenue, use the tool provided 'TR' and plot each quantity-revenue combination (plot 5 points total). Quantity Total Revenue $ $ $ 4 $ $ 5 8 9 8 Tools Demand O c. Price and total revenue move in the opposite direction when demand is e Total revenue 10 2 Quantity Tools TR O
Expert Answer:
Answer rating: 100% (QA)
Question PRICE QD 5 1 4 2 3 3 2 4 1 5 PRICE QD TR 5 1 ... View the full answer

Related Book For 

Income Tax Fundamentals 2013
ISBN: 9781285586618
31st Edition
Authors: Gerald E. Whittenburg, Martha Altus Buller, Steven L Gill
Posted Date:
Students also viewed these accounting questions
-
Please watch the movie Fences before doing this discussion. APPLY sociopath-logy or right to live; right to kill TO ONE of the characters in the film. Write your paragraph as if it is an academic...
-
Check IF all journal entries have been entered correctly. Correct the journal entries WHERE applicable. Are all journal entries from june 1 to june 30? 1.Purchase Invoice #BH-5621 Dated June 2,...
-
If a converges uniformly on [c, d], prove that is improperly integrable on (a, b) and F(y)f(x, y) dx f(x, y) dy f (x, y) dx dy- f(x. y) dy dx.
-
1. Jowel, the financial manager for Berjayasama Bhd, wishes to evaluate three potential investments: Investment A, Investments B and Investment C. Table 1 shows the expected returns. You have been...
-
A cash budget, by quarters, is given below for a retail company (000 omitted). The company requires a minimum cash balance of $5,000 to start each quarter. Required: Fill in the missing amounts in...
-
Derby In an investigation of environmental causes of disease, data were collected on the annual mortality rate (deaths per 100,000) for males in 61 large towns in England and Wales. In addition, the...
-
Paola Grillon owns Grillon Skin Care Products. She is contemplating the purchase of an industrial mixer that would be used to mix cosmetics in her factory. The following estimates are available:...
-
The annual data that follow pertain to Flannery Water Optics, a manufacturer of swimming goggles (the company had no beginning inventories): Sales...
-
Please Answer with solutions. The liability section of the statement of financial position of a company on December 31, 2021 showed: Share dividends declared but not yet paid P75,000 Dividends in...
-
In a volumetric determination of an analyte A, the data obtained and their standard deviations are as follows: From the data, find the coefficient of variation of the final result for the % A that is...
-
For each of the following problems ... Enter the solutions as a number only. For example, if the solution is x=2, enter 2 as the answer. Flag question: Question 1 Question 12 pts Solve8x7=25 Flag...
-
c) Find the minimum number of tables required to represent the given ER diagram in relational model- a1 a2 A R1 R2 c1 c2 b1 b2 R3 R3 B
-
The following account balances were taken from the general ledger accounts of the Ellery Corporation. Materials Work in Process Finished Goods Factory Overhead Control Applied Factory Overhead...
-
Santana Rey, owner of Business Solutions, decides to prepare a statement of cash flows for her business using the following financial data. BUSINESS SOLUTIONS Income Statement For Three Months Ended...
-
Consider two firms, Levered Firm and All-Equity Firm, that have identical assets. They generate identical cash flows. All-Equity Firm is a 100% finance by firm's equity, with 1 million shares...
-
discussion on the characteristics of successful project managers. Explain the major characteristics of successful project managers and team members. Provide detail answer and give some examples and...
-
Natalie Proulx outlines in her New York Times Article research related to teacher's racial identity and the impact on students. Geneva Gay's Video talks about the many different characteristics of...
-
What are the key elements of a system investigation report?
-
Leslie is a single taxpayer who is under age 65 and in good health. For 2012, she has a salary of $23,000 and itemized deductions of $1,000. Leslie is entitled to one exemption on her tax return. a....
-
Dr. Ivan I. Incisor and his wife Irene are married and file a joint return for 2012. Ivan's Social Security number is 477-34-4321 and he is 48 years old. Irene I. Incisor's Social Security number is...
-
David and Darlene Jasper have one child, Sam, who is 6 years old. The Jaspers reside at 4639 Honeysuckle Lane, Los Angeles, CA 90248. David's Social Security number is 577-11-3311, Darlene's is...
-
B Croft has a job as a car salesman. He is paid a basic salary of 200 per month, with a commission extra of 2% on the value of his car sales. During the month of April 19X6 he sells 30,000 worth of...
-
A R Kennedy is a security van driver. He has a wage of 200 per week, plus danger money of 2 per hour extra spent in transporting gold bullion. During the week ended 15 June 19X6 he spends 20 hours...
-
T Penketh is an accountant with a salary of 2,000 per month plus bonus, which for May 19X6 was 400. He pays superannuation contributions of 5% of gross pay, and these are allowed as reliefs against...

Study smarter with the SolutionInn App