

Bradford Assay: A method to estimate protein concentration Purpose: To utilize the Bradford dye binding assay...
Fantastic news! We've Found the answer you've been seeking!
Question:

Transcribed Image Text:
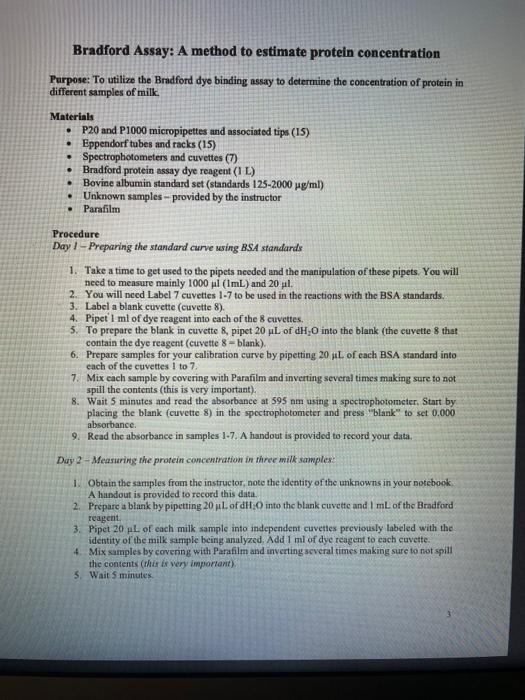
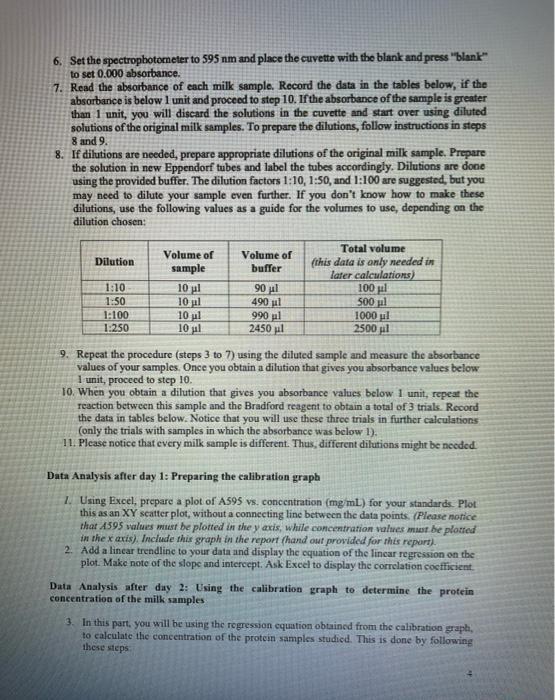
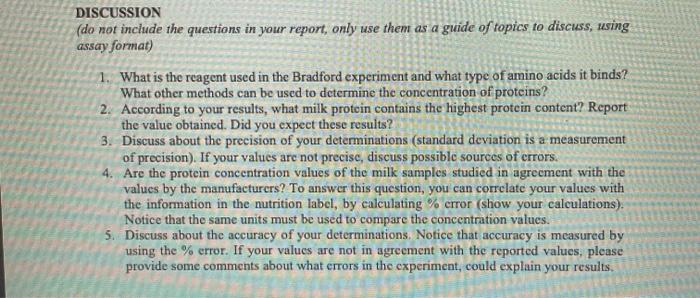
Bradford Assay: A method to estimate protein concentration Purpose: To utilize the Bradford dye binding assay to determine the concentration of protein in different samples of milk. Materials • P20 and P1000 micropipettes and associated tips (15) . Eppendorf tubes and racks (15) • Spectrophotometers and cuvettes (7) Bradford protein assay dye reagent (1 L) Bovine albumin standard set (standards 125-2000 µg/ml) Unknown samples-provided by the instructor • Parafilm ● . Procedure Day 1-Preparing the standard curve using BSA standards 1. Take a time to get used to the pipets needed and the manipulation of these pipets. You will need to measure mainly 1000 µl (1mL) and 20 ul. 2. You will need Label 7 cuvettes 1-7 to be used in the reactions with the BSA standards. 3. Label a blank cuvette (cuvette 8). 4. Pipet' I ml of dye reagent into each of the 8 cuvettes. 5. To prepare the blank in cuvette 8, pipet 20 µL of dH-O into the blank (the cuvette 8 that contain the dye reagent (cuvette 8-blank). 6. Prepare samples for your calibration curve by pipetting 20 μL of each BSA standard into each of the cuvettes 1 to 7. 7. Mix cach sample by covering with Parafilm and inverting several times making sure to not spill the contents (this is very important). 8. Wait 5 minutes and read the absorbance at 595 nm using a spectrophotometer. Start by placing the blank (cuvette 8) in the spectrophotometer and press "blank" to set 0.000 absorbance. 9. Read the absorbance in samples 1-7. A handout is provided to record your data. Day 2 Measuring the protein concentration in three milk samples: 1. Obtain the samples from the instructor, note the identity of the unknowns in your notebook. A handout is provided to record this data.. 2. Prepare a blank by pipetting 20 µL of dH₂O into the blank cuvette and 1 mL of the Bradford reagent.. 3. Pipet 20 µL of each milk sample into independent cuvettes previously labeled with the identity of the milk sample being analyzed. Add 1 ml of dye reagent to each cuvette. 4. Mix samples by covering with Parafilm and inverting several times making sure to not spill the contents (this is very important), 5. Wait 5 minutes. 6. Set the spectrophotorneter to 595 nm and place the cuvette with the blank and press "blank" to set 0.000 absorbance. 7. Read the absorbance of each milk sample. Record the data in the tables below, if the absorbance is below 1 unit and proceed to step 10. If the absorbance of the sample is greater than 1 unit, you will discard the solutions in the cuvette and start over using diluted solutions of the original milk samples. To prepare the dilutions, follow instructions in steps 8 and 9. 8. If dilutions are needed, prepare appropriate dilutions of the original milk sample. Prepare the solution in new Eppendorf tubes and label the tubes accordingly. Dilutions are done using the provided buffer. The dilution factors 1:10, 1:50, and 1:100 are suggested, but you may need to dilute your sample even further. If you don't know how to make these dilutions, use the following values as a guide for the volumes to use, depending on the dilution chosen: Dilution 1:10 1:50 1:100 1:250 Volume of sample 10 μl 10 μl 10 μl 10 μl Volume of buffer 90 μl 490 ul 990 µl 2450 μl Total volume (this data is only needed in later calculations) 100 μl 500 pl 1000μl 2500 μl 9. Repeat the procedure (steps 3 to 7) using the diluted sample and measure the absorbance values of your samples. Once you obtain a dilution that gives you absorbance values below 1 unit, proceed to step 10. 10. When you obtain a dilution that gives you absorbance values below 1 unit, repeat the reaction between this sample and the Bradford reagent to obtain a total of 3 trials. Record the data in tables below. Notice that you will use these three trials in further calculations (only the trials with samples in which the absorbance was below 1). 11. Please notice that every milk sample is different. Thus, different dilutions might be needed. Data Analysis after day 1: Preparing the calibration graph 1. Using Excel, prepare a plot of A595 vs. concentration (mg/mL) for your standards. Plot this as an XY scatter plot, without a connecting line between the data points. (Please notice that A595 values must be plotted in the y axis, while concentration values must be plotted in the x axis). Include this graph in the report (hand out provided for this report). 2. Add a linear trendline to your data and display the equation of the linear regression on the plot. Make note of the slope and intercept. Ask Excel to display the correlation coefficient. Data Analysis after day 2: Using the calibration graph to determine the protein concentration of the milk samples 3. In this part, you will be using the regression equation obtained from the calibration graph, to calculate the concentration of the protein samples studied. This is done by following these steps a) solve the equation of the line to x (concentration) b) calculate the concentration of each sample. 4. If the absorbance values you are using in your calculations, were obtained with diluted samples, you need to find the concentration in the original sample. This is done by t multiplying the concentration you obtain in (3) by the dilution factor that you made. 5. Note that steps 3b and 4 should be done with the 3 trials (you get absorbance values, then you can calculate 3 concentration values. Use these 3 concentration values to find the average (mean) and the standard deviation (a measurement of precision). Show your results in the table provided in the handout. DISCUSSION (do not include the questions in your report, only use them as a guide of topics to discuss, using assay format) 1. What is the reagent used in the Bradford experiment and what type of amino acids it binds? What other methods can be used to determine the concentration of proteins? 2. According to your results, what milk protein contains the highest protein content? Report the value obtained. Did you expect these results? 3. Discuss about the precision of your determinations (standard deviation is a measurement of precision). If your values are not precise, discuss possible sources of errors. 4. Are the protein concentration values of the milk samples studied in agreement with the values by the manufacturers? To answer this question, you can correlate your values with the information in the nutrition label, by calculating % crror (show your calculations). Notice that the same units must be used to compare the concentration values. 5. Discuss about the accuracy of your determinations. Notice that accuracy is measured by using the % error. If your values are not in agreement with the reported values, please provide some comments about what errors in the experiment, could explain your results. Bradford Assay: A method to estimate protein concentration Purpose: To utilize the Bradford dye binding assay to determine the concentration of protein in different samples of milk. Materials • P20 and P1000 micropipettes and associated tips (15) . Eppendorf tubes and racks (15) • Spectrophotometers and cuvettes (7) Bradford protein assay dye reagent (1 L) Bovine albumin standard set (standards 125-2000 µg/ml) Unknown samples-provided by the instructor • Parafilm ● . Procedure Day 1-Preparing the standard curve using BSA standards 1. Take a time to get used to the pipets needed and the manipulation of these pipets. You will need to measure mainly 1000 µl (1mL) and 20 ul. 2. You will need Label 7 cuvettes 1-7 to be used in the reactions with the BSA standards. 3. Label a blank cuvette (cuvette 8). 4. Pipet' I ml of dye reagent into each of the 8 cuvettes. 5. To prepare the blank in cuvette 8, pipet 20 µL of dH-O into the blank (the cuvette 8 that contain the dye reagent (cuvette 8-blank). 6. Prepare samples for your calibration curve by pipetting 20 μL of each BSA standard into each of the cuvettes 1 to 7. 7. Mix cach sample by covering with Parafilm and inverting several times making sure to not spill the contents (this is very important). 8. Wait 5 minutes and read the absorbance at 595 nm using a spectrophotometer. Start by placing the blank (cuvette 8) in the spectrophotometer and press "blank" to set 0.000 absorbance. 9. Read the absorbance in samples 1-7. A handout is provided to record your data. Day 2 Measuring the protein concentration in three milk samples: 1. Obtain the samples from the instructor, note the identity of the unknowns in your notebook. A handout is provided to record this data.. 2. Prepare a blank by pipetting 20 µL of dH₂O into the blank cuvette and 1 mL of the Bradford reagent.. 3. Pipet 20 µL of each milk sample into independent cuvettes previously labeled with the identity of the milk sample being analyzed. Add 1 ml of dye reagent to each cuvette. 4. Mix samples by covering with Parafilm and inverting several times making sure to not spill the contents (this is very important), 5. Wait 5 minutes. 6. Set the spectrophotorneter to 595 nm and place the cuvette with the blank and press "blank" to set 0.000 absorbance. 7. Read the absorbance of each milk sample. Record the data in the tables below, if the absorbance is below 1 unit and proceed to step 10. If the absorbance of the sample is greater than 1 unit, you will discard the solutions in the cuvette and start over using diluted solutions of the original milk samples. To prepare the dilutions, follow instructions in steps 8 and 9. 8. If dilutions are needed, prepare appropriate dilutions of the original milk sample. Prepare the solution in new Eppendorf tubes and label the tubes accordingly. Dilutions are done using the provided buffer. The dilution factors 1:10, 1:50, and 1:100 are suggested, but you may need to dilute your sample even further. If you don't know how to make these dilutions, use the following values as a guide for the volumes to use, depending on the dilution chosen: Dilution 1:10 1:50 1:100 1:250 Volume of sample 10 μl 10 μl 10 μl 10 μl Volume of buffer 90 μl 490 ul 990 µl 2450 μl Total volume (this data is only needed in later calculations) 100 μl 500 pl 1000μl 2500 μl 9. Repeat the procedure (steps 3 to 7) using the diluted sample and measure the absorbance values of your samples. Once you obtain a dilution that gives you absorbance values below 1 unit, proceed to step 10. 10. When you obtain a dilution that gives you absorbance values below 1 unit, repeat the reaction between this sample and the Bradford reagent to obtain a total of 3 trials. Record the data in tables below. Notice that you will use these three trials in further calculations (only the trials with samples in which the absorbance was below 1). 11. Please notice that every milk sample is different. Thus, different dilutions might be needed. Data Analysis after day 1: Preparing the calibration graph 1. Using Excel, prepare a plot of A595 vs. concentration (mg/mL) for your standards. Plot this as an XY scatter plot, without a connecting line between the data points. (Please notice that A595 values must be plotted in the y axis, while concentration values must be plotted in the x axis). Include this graph in the report (hand out provided for this report). 2. Add a linear trendline to your data and display the equation of the linear regression on the plot. Make note of the slope and intercept. Ask Excel to display the correlation coefficient. Data Analysis after day 2: Using the calibration graph to determine the protein concentration of the milk samples 3. In this part, you will be using the regression equation obtained from the calibration graph, to calculate the concentration of the protein samples studied. This is done by following these steps a) solve the equation of the line to x (concentration) b) calculate the concentration of each sample. 4. If the absorbance values you are using in your calculations, were obtained with diluted samples, you need to find the concentration in the original sample. This is done by t multiplying the concentration you obtain in (3) by the dilution factor that you made. 5. Note that steps 3b and 4 should be done with the 3 trials (you get absorbance values, then you can calculate 3 concentration values. Use these 3 concentration values to find the average (mean) and the standard deviation (a measurement of precision). Show your results in the table provided in the handout. DISCUSSION (do not include the questions in your report, only use them as a guide of topics to discuss, using assay format) 1. What is the reagent used in the Bradford experiment and what type of amino acids it binds? What other methods can be used to determine the concentration of proteins? 2. According to your results, what milk protein contains the highest protein content? Report the value obtained. Did you expect these results? 3. Discuss about the precision of your determinations (standard deviation is a measurement of precision). If your values are not precise, discuss possible sources of errors. 4. Are the protein concentration values of the milk samples studied in agreement with the values by the manufacturers? To answer this question, you can correlate your values with the information in the nutrition label, by calculating % crror (show your calculations). Notice that the same units must be used to compare the concentration values. 5. Discuss about the accuracy of your determinations. Notice that accuracy is measured by using the % error. If your values are not in agreement with the reported values, please provide some comments about what errors in the experiment, could explain your results.
Expert Answer:

Related Book For 
Introduction to Mathematical Statistics and Its Applications
ISBN: 978-0321693945
5th edition
Authors: Richard J. Larsen, Morris L. Marx
Posted Date:
Students also viewed these general management questions
-
Let A and B be two events defined on S. If the probability that at least one of them occurs is 0.3 and the probability that A occurs but B does not occur is 0.1, what is P (B)?
-
Let A and B be any two events. Use Venn diagrams to show that (a) The complement of their intersection is the union of their complements: (A B)C = AC BC (b) The complement of their union is the...
-
Let a and b be nonzero vectors in Rn. a) If (t) = a + tb for t R, show that for each to, t0, t1, t2 R with t1, t2 t0, the angle between (t0) - (t0) - (t0) and (t2) - (t0) is 0 or . b) If is the...
-
Norma received a deficiency letter from the Internal Revenue Service. She appealed to the Independent Office of Appeals, and her appeal was denied. Now she wants to take the government to court....
-
Consider how a strong marketing approach might be made to both European consumers and middlemen, such as travel agents, tour guides, even bus drivers.
-
1. What type of MBTI decision style do you think Cynde has? Explain. 2. Based on your answer to question 1, what are Cyndes strengths and blind spots when making important decisions? 3. Help Cynde...
-
What should be included in an engagement letter? What are some reasons a client might change the terms of the engagement? What are the two basic types of engagement proposals?
-
PDQ Repairs has 200 auto-maintenance service outlets nationwide. It performs primarily two lines of service: oil changes and brake repair. Oil change-related services represent 70% of its sales and...
-
Sec2.4: Problem 15 Previous Problem Problem List Next Problem (1 point) Book Exercise 43 Note: Click on graph for larger version in new browser window. The graphs of the function f (given in blue)...
-
Open the Orders Solution.sln file contained in the VB2017\Chap03\Orders Solution folder. The interface provides a button for adding the number ordered to the total ordered, and a button for...
-
The correct answer is Software program. An operating system is system software that manages computer hardware, software resources, and provides common services for computer programs. Operating...
-
Use partial fraction expansions to find the inverse Laplace transforms (the time system responses) of the following functions: (a) \[Y_{1}(s)=\frac{5}{s(s+1)(s+10)}\] (b) \[Y_{2}(s)=\frac{2...
-
What is the role of accountants in guarding against digital disruption in their organizations?
-
How can an organization use digital technologies to enhance its ambidexterity?
-
What is meant by the assertion that digital business is a future state?
-
(a) Derive the transfer function H ( s ) H ( s ) for the general second-order system given by y + 2 n y + 2 n y = 2 n u y + 2 n y + n 2 y = n 2 u where y ( t ) y ( t ) is the output, u (...
-
In what areas of adv business processes have you gotten stronger and more confident as the course comes to a close
-
What are the key dimensions of critical thinking 2. Watch the NBC Learn video on Diet Scams. What types of claims are made in this video Are they valid Elaborate on your responses. Discuss this video...
-
Two manufacturing processes are available for annealing a certain kind of copper tubing, the primary difference being in the temperature required. The critical response variable is the resulting...
-
In Question 3.11.7 define the random variable W to be the "majority" of x, y, and z. For example, W(2, 2, 1) = 2 and W(1, 1, 1) = 1. Find the pdf of W|x.
-
Suppose a series of n independent trials can end in one of three possible outcomes. Let k1 and k2 denote the number of trials that result in outcomes 1 and 2, respectively. Let p1 and p2 denote the...
-
Ethical Issues} Kathryn Goldsmith is the chief accountant for Clean Sweep, a national carpet-cleaning service with a December fiscal year-end. As Kathryn was preparing the 2018 financial statements...
-
Research and Analysis Using the Annual Report} Obtain George Weston Limited's 2014 annual report through the "Investor Relations" portion of its website. \section*{Required:} 1. Determine the amounts...
-
Accounting for Partly Completed Events: A Prelude to Chapter 3} Ehrlich Smith, the owner of The Shoe Box, has asked you to help him understand the proper way to account for certain accounting items...

Study smarter with the SolutionInn App