

We have discussed many concepts in SCM 301 related to planning, sourcing, making and delivering products...
Fantastic news! We've Found the answer you've been seeking!
Question:
Transcribed Image Text:
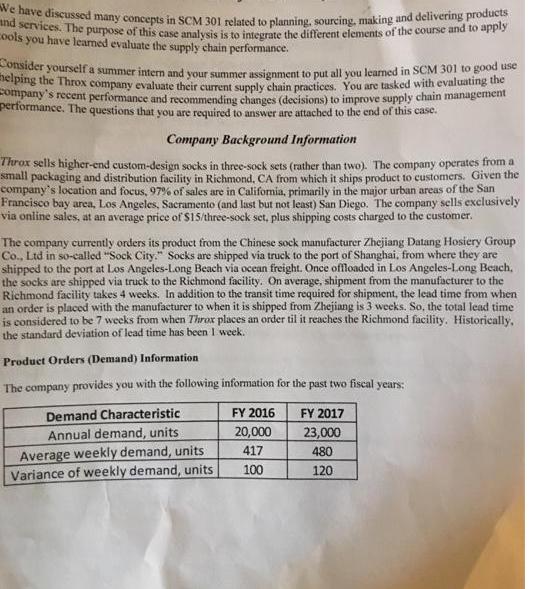
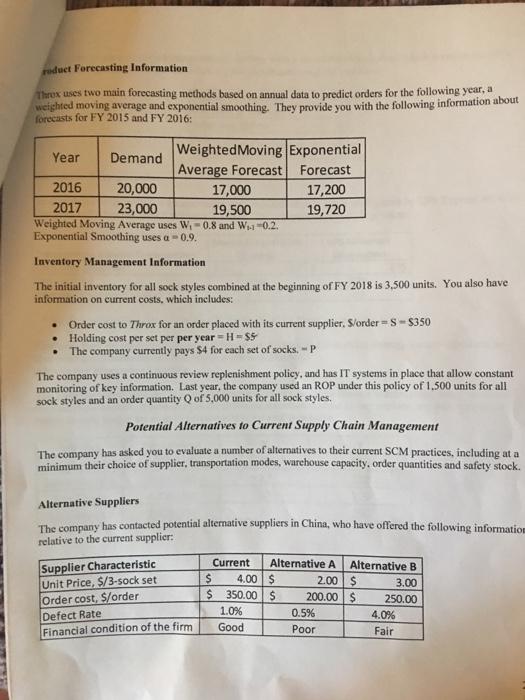
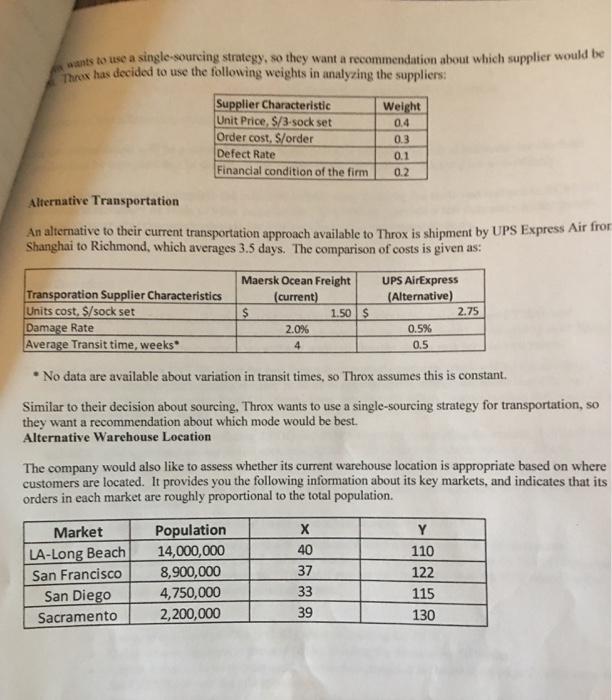
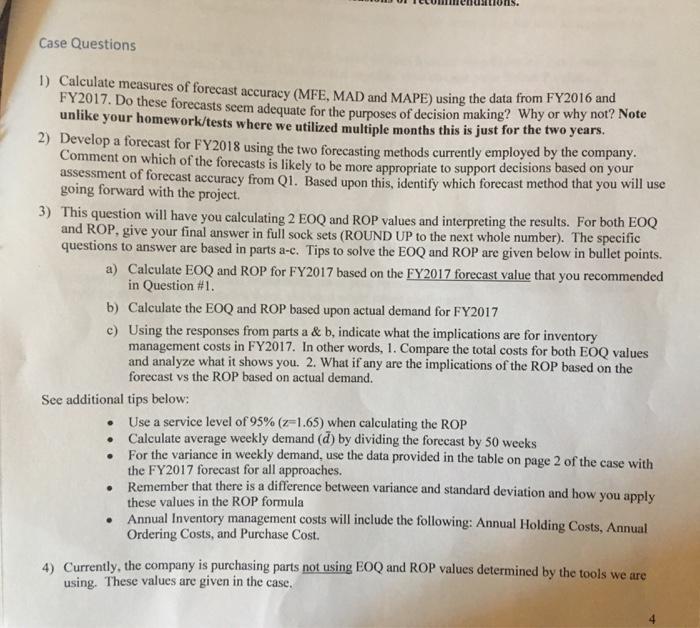
We have discussed many concepts in SCM 301 related to planning, sourcing, making and delivering products and services. The purpose of this case analysis is to integrate the different elements of the course and to apply cools you have learned evaluate the supply chain performance. Consider yourself a summer intern and your summer assignment to put all you learned in SCM 301 to good use helping the Throx company evaluate their current supply chain practices. You are tasked with evaluating the company's recent performance and recommending changes (decisions) to improve supply chain management performance. The questions that you are required to answer are attached to the end of this case. Company Background Information Throx sells higher-end custom-design socks in three-sock sets (rather than two). The company operates from a small packaging and distribution facility in Richmond, CA from which it ships product to customers. Given the company's location and focus, 97% of sales are in California, primarily in the major urban areas of the San Francisco bay area, Los Angeles, Sacramento (and last but not least) San Diego. The company sells exclusively via online sales, at an average price of $15/three-sock set, plus shipping costs charged to the customer. The company currently orders its product from the Chinese sock manufacturer Zhejiang Datang Hosiery Group Co., Ltd in so-called "Sock City." Socks are shipped via truck to the port of Shanghai, from where they are shipped to the port at Los Angeles-Long Beach via ocean freight. Once offloaded in Los Angeles-Long Beach, the socks are shipped via truck to the Richmond facility. On average, shipment from the manufacturer to the Richmond facility takes 4 weeks. In addition to the transit time required for shipment, the lead time from when an order is placed with the manufacturer to when it is shipped from Zhejiang is 3 weeks. So, the total lead time is considered to be 7 weeks from when Throx places an order til it reaches the Richmond facility. Historically, the standard deviation of lead time has been I week. Product Orders (Demand) Information The company provides you with the following information for the past two fiscal years: Demand Characteristic Annual demand, units Average weekly demand, units Variance of weekly demand, units FY 2016 20,000 417 100 FY 2017 23,000 480 120 Foduct Forecasting Information Thrux uses two main forecasting methods based on annual data to predict orders for the following year, a weighted moving average and exponential smoothing. They provide you with the following information about forecasts for FY 2015 and FY 2016: Year Weighted Moving Exponential Average Forecast Forecast Demand 2016 20,000 17,000 2017 23,000 19,500 Weighted Moving Average uses W₁-0.8 and W₁-1-0.2. Exponential Smoothing uses a 0.9. Inventory Management Information The initial inventory for all sock styles combined at the beginning of FY 2018 is 3,500 units. You also have information on current costs, which includes: • Order cost to Throx for an order placed with its current supplier. S/order=S-$350 • Holding cost per set per per year=H=$5 • The company currently pays $4 for each set of socks. - P 17,200 19,720 The company uses a continuous review replenishment policy, and has IT systems in place that allow constant monitoring of key information. Last year, the company used an ROP under this policy of 1,500 units for all sock styles and an order quantity Q of 5,000 units for all sock styles. Potential Alternatives to Current Supply Chain Management The company has asked you to evaluate a number of alternatives to their current SCM practices, including at a minimum their choice of supplier, transportation modes, warehouse capacity, order quantities and safety stock. Alternative Suppliers The company has contacted potential alternative suppliers in China, who have offered the following information relative to the current supplier: Supplier Characteristic Unit Price, $/3-sock set Order cost, $/order Defect Rate Financial condition of the firm Current Alternative A $ 4.00 $ $ 350.00 $ 1.0% Good Alternative B 3.00 250.00 2.00 $ 200.00 $ 0.5% Poor 4.0% Fair wants to use a single-sourcing strategy, so they want a recommendation about which supplier would be Threx has decided to use the following weights in analyzing the suppliers: Supplier Characteristic Unit Price, $/3-sock set Order cost, $/order Defect Rate Financial condition of the firm Alternative Transportation An alternative to their current transportation approach available to Throx is shipment by UPS Express Air from Shanghai to Richmond, which averages 3.5 days. The comparison of costs is given as: Transporation Supplier Characteristics Units cost, $/sock set Damage Rate Average Transit time, weeks Market LA-Long Beach San Francisco San Diego Sacramento Maersk Ocean Freight (current) $ Population 14,000,000 8,900,000 4,750,000 2,200,000 2.0% 4 Weight 0.4 0.3 0.1 0.2 1.50 $ X 40 37 33 39 UPS AirExpress (Alternative) No data are available about variation in transit times, so Throx assumes this is constant. Similar to their decision about sourcing. Throx wants to use a single-sourcing strategy for transportation, so they want a recommendation about which mode would be best. Alternative Warehouse Location 0.5% 0.5 The company would also like to assess whether its current warehouse location is appropriate based on where customers are located. It provides you the following information about its key markets, and indicates that its orders in each market are roughly proportional to the total population. 2.75 Y 110 122 115 130 Case Questions 1) Calculate measures of forecast accuracy (MFE, MAD and MAPE) using the data from FY2016 and FY2017. Do these forecasts seem adequate for the purposes of decision making? Why or why not? Note unlike your homework/tests where we utilized multiple months this is just for the two years. 2) Develop a forecast for FY2018 using the two forecasting methods currently employed by the company. Comment on which of the forecasts is likely to be more appropriate to support decisions based on your assessment of forecast accuracy from Q1. Based upon this, identify which forecast method that you will use going forward with the project. 3) This question will have you calculating 2 EOQ and ROP values and interpreting the results. For both EOQ and ROP, give your final answer in full sock sets (ROUND UP to the next whole number). The specific questions to answer are based in parts a-c. Tips to solve the EOQ and ROP are given below in bullet points. a) Calculate EOQ and ROP for FY2017 based on the FY2017 forecast value that you recommended in Question #1. b) Calculate the EOQ and ROP based upon actual demand for FY2017 c) Using the responses from parts a & b, indicate what the implications are for inventory management costs in FY2017. In other words, 1. Compare the total costs for both EOQ values and analyze what it shows you. 2. What if any are the implications of the ROP based on the forecast vs the ROP based on actual demand. See additional tips below: • • ● ● Use a service level of 95% (z-1.65) when calculating the ROP Calculate average weekly demand (d) by dividing the forecast by 50 weeks For the variance in weekly demand, use the data provided in the table on page 2 of the case with the FY2017 forecast for all approaches. Remember that there is a difference between variance and standard deviation and how you apply these values in the ROP formula • Annual Inventory management costs will include the following: Annual Holding Costs, Annual Ordering Costs, and Purchase Cost. 4) Currently, the company is purchasing parts not using EOQ and ROP values determined by the tools we are using. These values are given in the case. We have discussed many concepts in SCM 301 related to planning, sourcing, making and delivering products and services. The purpose of this case analysis is to integrate the different elements of the course and to apply cools you have learned evaluate the supply chain performance. Consider yourself a summer intern and your summer assignment to put all you learned in SCM 301 to good use helping the Throx company evaluate their current supply chain practices. You are tasked with evaluating the company's recent performance and recommending changes (decisions) to improve supply chain management performance. The questions that you are required to answer are attached to the end of this case. Company Background Information Throx sells higher-end custom-design socks in three-sock sets (rather than two). The company operates from a small packaging and distribution facility in Richmond, CA from which it ships product to customers. Given the company's location and focus, 97% of sales are in California, primarily in the major urban areas of the San Francisco bay area, Los Angeles, Sacramento (and last but not least) San Diego. The company sells exclusively via online sales, at an average price of $15/three-sock set, plus shipping costs charged to the customer. The company currently orders its product from the Chinese sock manufacturer Zhejiang Datang Hosiery Group Co., Ltd in so-called "Sock City." Socks are shipped via truck to the port of Shanghai, from where they are shipped to the port at Los Angeles-Long Beach via ocean freight. Once offloaded in Los Angeles-Long Beach, the socks are shipped via truck to the Richmond facility. On average, shipment from the manufacturer to the Richmond facility takes 4 weeks. In addition to the transit time required for shipment, the lead time from when an order is placed with the manufacturer to when it is shipped from Zhejiang is 3 weeks. So, the total lead time is considered to be 7 weeks from when Throx places an order til it reaches the Richmond facility. Historically, the standard deviation of lead time has been I week. Product Orders (Demand) Information The company provides you with the following information for the past two fiscal years: Demand Characteristic Annual demand, units Average weekly demand, units Variance of weekly demand, units FY 2016 20,000 417 100 FY 2017 23,000 480 120 Foduct Forecasting Information Thrux uses two main forecasting methods based on annual data to predict orders for the following year, a weighted moving average and exponential smoothing. They provide you with the following information about forecasts for FY 2015 and FY 2016: Year Weighted Moving Exponential Average Forecast Forecast Demand 2016 20,000 17,000 2017 23,000 19,500 Weighted Moving Average uses W₁-0.8 and W₁-1-0.2. Exponential Smoothing uses a 0.9. Inventory Management Information The initial inventory for all sock styles combined at the beginning of FY 2018 is 3,500 units. You also have information on current costs, which includes: • Order cost to Throx for an order placed with its current supplier. S/order=S-$350 • Holding cost per set per per year=H=$5 • The company currently pays $4 for each set of socks. - P 17,200 19,720 The company uses a continuous review replenishment policy, and has IT systems in place that allow constant monitoring of key information. Last year, the company used an ROP under this policy of 1,500 units for all sock styles and an order quantity Q of 5,000 units for all sock styles. Potential Alternatives to Current Supply Chain Management The company has asked you to evaluate a number of alternatives to their current SCM practices, including at a minimum their choice of supplier, transportation modes, warehouse capacity, order quantities and safety stock. Alternative Suppliers The company has contacted potential alternative suppliers in China, who have offered the following information relative to the current supplier: Supplier Characteristic Unit Price, $/3-sock set Order cost, $/order Defect Rate Financial condition of the firm Current Alternative A $ 4.00 $ $ 350.00 $ 1.0% Good Alternative B 3.00 250.00 2.00 $ 200.00 $ 0.5% Poor 4.0% Fair wants to use a single-sourcing strategy, so they want a recommendation about which supplier would be Threx has decided to use the following weights in analyzing the suppliers: Supplier Characteristic Unit Price, $/3-sock set Order cost, $/order Defect Rate Financial condition of the firm Alternative Transportation An alternative to their current transportation approach available to Throx is shipment by UPS Express Air from Shanghai to Richmond, which averages 3.5 days. The comparison of costs is given as: Transporation Supplier Characteristics Units cost, $/sock set Damage Rate Average Transit time, weeks Market LA-Long Beach San Francisco San Diego Sacramento Maersk Ocean Freight (current) $ Population 14,000,000 8,900,000 4,750,000 2,200,000 2.0% 4 Weight 0.4 0.3 0.1 0.2 1.50 $ X 40 37 33 39 UPS AirExpress (Alternative) No data are available about variation in transit times, so Throx assumes this is constant. Similar to their decision about sourcing. Throx wants to use a single-sourcing strategy for transportation, so they want a recommendation about which mode would be best. Alternative Warehouse Location 0.5% 0.5 The company would also like to assess whether its current warehouse location is appropriate based on where customers are located. It provides you the following information about its key markets, and indicates that its orders in each market are roughly proportional to the total population. 2.75 Y 110 122 115 130 Case Questions 1) Calculate measures of forecast accuracy (MFE, MAD and MAPE) using the data from FY2016 and FY2017. Do these forecasts seem adequate for the purposes of decision making? Why or why not? Note unlike your homework/tests where we utilized multiple months this is just for the two years. 2) Develop a forecast for FY2018 using the two forecasting methods currently employed by the company. Comment on which of the forecasts is likely to be more appropriate to support decisions based on your assessment of forecast accuracy from Q1. Based upon this, identify which forecast method that you will use going forward with the project. 3) This question will have you calculating 2 EOQ and ROP values and interpreting the results. For both EOQ and ROP, give your final answer in full sock sets (ROUND UP to the next whole number). The specific questions to answer are based in parts a-c. Tips to solve the EOQ and ROP are given below in bullet points. a) Calculate EOQ and ROP for FY2017 based on the FY2017 forecast value that you recommended in Question #1. b) Calculate the EOQ and ROP based upon actual demand for FY2017 c) Using the responses from parts a & b, indicate what the implications are for inventory management costs in FY2017. In other words, 1. Compare the total costs for both EOQ values and analyze what it shows you. 2. What if any are the implications of the ROP based on the forecast vs the ROP based on actual demand. See additional tips below: • • ● ● Use a service level of 95% (z-1.65) when calculating the ROP Calculate average weekly demand (d) by dividing the forecast by 50 weeks For the variance in weekly demand, use the data provided in the table on page 2 of the case with the FY2017 forecast for all approaches. Remember that there is a difference between variance and standard deviation and how you apply these values in the ROP formula • Annual Inventory management costs will include the following: Annual Holding Costs, Annual Ordering Costs, and Purchase Cost. 4) Currently, the company is purchasing parts not using EOQ and ROP values determined by the tools we are using. These values are given in the case. We have discussed many concepts in SCM 301 related to planning, sourcing, making and delivering products and services. The purpose of this case analysis is to integrate the different elements of the course and to apply cools you have learned evaluate the supply chain performance. Consider yourself a summer intern and your summer assignment to put all you learned in SCM 301 to good use helping the Throx company evaluate their current supply chain practices. You are tasked with evaluating the company's recent performance and recommending changes (decisions) to improve supply chain management performance. The questions that you are required to answer are attached to the end of this case. Company Background Information Throx sells higher-end custom-design socks in three-sock sets (rather than two). The company operates from a small packaging and distribution facility in Richmond, CA from which it ships product to customers. Given the company's location and focus, 97% of sales are in California, primarily in the major urban areas of the San Francisco bay area, Los Angeles, Sacramento (and last but not least) San Diego. The company sells exclusively via online sales, at an average price of $15/three-sock set, plus shipping costs charged to the customer. The company currently orders its product from the Chinese sock manufacturer Zhejiang Datang Hosiery Group Co., Ltd in so-called "Sock City." Socks are shipped via truck to the port of Shanghai, from where they are shipped to the port at Los Angeles-Long Beach via ocean freight. Once offloaded in Los Angeles-Long Beach, the socks are shipped via truck to the Richmond facility. On average, shipment from the manufacturer to the Richmond facility takes 4 weeks. In addition to the transit time required for shipment, the lead time from when an order is placed with the manufacturer to when it is shipped from Zhejiang is 3 weeks. So, the total lead time is considered to be 7 weeks from when Throx places an order til it reaches the Richmond facility. Historically, the standard deviation of lead time has been I week. Product Orders (Demand) Information The company provides you with the following information for the past two fiscal years: Demand Characteristic Annual demand, units Average weekly demand, units Variance of weekly demand, units FY 2016 20,000 417 100 FY 2017 23,000 480 120 Foduct Forecasting Information Thrux uses two main forecasting methods based on annual data to predict orders for the following year, a weighted moving average and exponential smoothing. They provide you with the following information about forecasts for FY 2015 and FY 2016: Year Weighted Moving Exponential Average Forecast Forecast Demand 2016 20,000 17,000 2017 23,000 19,500 Weighted Moving Average uses W₁-0.8 and W₁-1-0.2. Exponential Smoothing uses a 0.9. Inventory Management Information The initial inventory for all sock styles combined at the beginning of FY 2018 is 3,500 units. You also have information on current costs, which includes: • Order cost to Throx for an order placed with its current supplier. S/order=S-$350 • Holding cost per set per per year=H=$5 • The company currently pays $4 for each set of socks. - P 17,200 19,720 The company uses a continuous review replenishment policy, and has IT systems in place that allow constant monitoring of key information. Last year, the company used an ROP under this policy of 1,500 units for all sock styles and an order quantity Q of 5,000 units for all sock styles. Potential Alternatives to Current Supply Chain Management The company has asked you to evaluate a number of alternatives to their current SCM practices, including at a minimum their choice of supplier, transportation modes, warehouse capacity, order quantities and safety stock. Alternative Suppliers The company has contacted potential alternative suppliers in China, who have offered the following information relative to the current supplier: Supplier Characteristic Unit Price, $/3-sock set Order cost, $/order Defect Rate Financial condition of the firm Current Alternative A $ 4.00 $ $ 350.00 $ 1.0% Good Alternative B 3.00 250.00 2.00 $ 200.00 $ 0.5% Poor 4.0% Fair wants to use a single-sourcing strategy, so they want a recommendation about which supplier would be Threx has decided to use the following weights in analyzing the suppliers: Supplier Characteristic Unit Price, $/3-sock set Order cost, $/order Defect Rate Financial condition of the firm Alternative Transportation An alternative to their current transportation approach available to Throx is shipment by UPS Express Air from Shanghai to Richmond, which averages 3.5 days. The comparison of costs is given as: Transporation Supplier Characteristics Units cost, $/sock set Damage Rate Average Transit time, weeks Market LA-Long Beach San Francisco San Diego Sacramento Maersk Ocean Freight (current) $ Population 14,000,000 8,900,000 4,750,000 2,200,000 2.0% 4 Weight 0.4 0.3 0.1 0.2 1.50 $ X 40 37 33 39 UPS AirExpress (Alternative) No data are available about variation in transit times, so Throx assumes this is constant. Similar to their decision about sourcing. Throx wants to use a single-sourcing strategy for transportation, so they want a recommendation about which mode would be best. Alternative Warehouse Location 0.5% 0.5 The company would also like to assess whether its current warehouse location is appropriate based on where customers are located. It provides you the following information about its key markets, and indicates that its orders in each market are roughly proportional to the total population. 2.75 Y 110 122 115 130 Case Questions 1) Calculate measures of forecast accuracy (MFE, MAD and MAPE) using the data from FY2016 and FY2017. Do these forecasts seem adequate for the purposes of decision making? Why or why not? Note unlike your homework/tests where we utilized multiple months this is just for the two years. 2) Develop a forecast for FY2018 using the two forecasting methods currently employed by the company. Comment on which of the forecasts is likely to be more appropriate to support decisions based on your assessment of forecast accuracy from Q1. Based upon this, identify which forecast method that you will use going forward with the project. 3) This question will have you calculating 2 EOQ and ROP values and interpreting the results. For both EOQ and ROP, give your final answer in full sock sets (ROUND UP to the next whole number). The specific questions to answer are based in parts a-c. Tips to solve the EOQ and ROP are given below in bullet points. a) Calculate EOQ and ROP for FY2017 based on the FY2017 forecast value that you recommended in Question #1. b) Calculate the EOQ and ROP based upon actual demand for FY2017 c) Using the responses from parts a & b, indicate what the implications are for inventory management costs in FY2017. In other words, 1. Compare the total costs for both EOQ values and analyze what it shows you. 2. What if any are the implications of the ROP based on the forecast vs the ROP based on actual demand. See additional tips below: • • ● ● Use a service level of 95% (z-1.65) when calculating the ROP Calculate average weekly demand (d) by dividing the forecast by 50 weeks For the variance in weekly demand, use the data provided in the table on page 2 of the case with the FY2017 forecast for all approaches. Remember that there is a difference between variance and standard deviation and how you apply these values in the ROP formula • Annual Inventory management costs will include the following: Annual Holding Costs, Annual Ordering Costs, and Purchase Cost. 4) Currently, the company is purchasing parts not using EOQ and ROP values determined by the tools we are using. These values are given in the case. We have discussed many concepts in SCM 301 related to planning, sourcing, making and delivering products and services. The purpose of this case analysis is to integrate the different elements of the course and to apply cools you have learned evaluate the supply chain performance. Consider yourself a summer intern and your summer assignment to put all you learned in SCM 301 to good use helping the Throx company evaluate their current supply chain practices. You are tasked with evaluating the company's recent performance and recommending changes (decisions) to improve supply chain management performance. The questions that you are required to answer are attached to the end of this case. Company Background Information Throx sells higher-end custom-design socks in three-sock sets (rather than two). The company operates from a small packaging and distribution facility in Richmond, CA from which it ships product to customers. Given the company's location and focus, 97% of sales are in California, primarily in the major urban areas of the San Francisco bay area, Los Angeles, Sacramento (and last but not least) San Diego. The company sells exclusively via online sales, at an average price of $15/three-sock set, plus shipping costs charged to the customer. The company currently orders its product from the Chinese sock manufacturer Zhejiang Datang Hosiery Group Co., Ltd in so-called "Sock City." Socks are shipped via truck to the port of Shanghai, from where they are shipped to the port at Los Angeles-Long Beach via ocean freight. Once offloaded in Los Angeles-Long Beach, the socks are shipped via truck to the Richmond facility. On average, shipment from the manufacturer to the Richmond facility takes 4 weeks. In addition to the transit time required for shipment, the lead time from when an order is placed with the manufacturer to when it is shipped from Zhejiang is 3 weeks. So, the total lead time is considered to be 7 weeks from when Throx places an order til it reaches the Richmond facility. Historically, the standard deviation of lead time has been I week. Product Orders (Demand) Information The company provides you with the following information for the past two fiscal years: Demand Characteristic Annual demand, units Average weekly demand, units Variance of weekly demand, units FY 2016 20,000 417 100 FY 2017 23,000 480 120 Foduct Forecasting Information Thrux uses two main forecasting methods based on annual data to predict orders for the following year, a weighted moving average and exponential smoothing. They provide you with the following information about forecasts for FY 2015 and FY 2016: Year Weighted Moving Exponential Average Forecast Forecast Demand 2016 20,000 17,000 2017 23,000 19,500 Weighted Moving Average uses W₁-0.8 and W₁-1-0.2. Exponential Smoothing uses a 0.9. Inventory Management Information The initial inventory for all sock styles combined at the beginning of FY 2018 is 3,500 units. You also have information on current costs, which includes: • Order cost to Throx for an order placed with its current supplier. S/order=S-$350 • Holding cost per set per per year=H=$5 • The company currently pays $4 for each set of socks. - P 17,200 19,720 The company uses a continuous review replenishment policy, and has IT systems in place that allow constant monitoring of key information. Last year, the company used an ROP under this policy of 1,500 units for all sock styles and an order quantity Q of 5,000 units for all sock styles. Potential Alternatives to Current Supply Chain Management The company has asked you to evaluate a number of alternatives to their current SCM practices, including at a minimum their choice of supplier, transportation modes, warehouse capacity, order quantities and safety stock. Alternative Suppliers The company has contacted potential alternative suppliers in China, who have offered the following information relative to the current supplier: Supplier Characteristic Unit Price, $/3-sock set Order cost, $/order Defect Rate Financial condition of the firm Current Alternative A $ 4.00 $ $ 350.00 $ 1.0% Good Alternative B 3.00 250.00 2.00 $ 200.00 $ 0.5% Poor 4.0% Fair wants to use a single-sourcing strategy, so they want a recommendation about which supplier would be Threx has decided to use the following weights in analyzing the suppliers: Supplier Characteristic Unit Price, $/3-sock set Order cost, $/order Defect Rate Financial condition of the firm Alternative Transportation An alternative to their current transportation approach available to Throx is shipment by UPS Express Air from Shanghai to Richmond, which averages 3.5 days. The comparison of costs is given as: Transporation Supplier Characteristics Units cost, $/sock set Damage Rate Average Transit time, weeks Market LA-Long Beach San Francisco San Diego Sacramento Maersk Ocean Freight (current) $ Population 14,000,000 8,900,000 4,750,000 2,200,000 2.0% 4 Weight 0.4 0.3 0.1 0.2 1.50 $ X 40 37 33 39 UPS AirExpress (Alternative) No data are available about variation in transit times, so Throx assumes this is constant. Similar to their decision about sourcing. Throx wants to use a single-sourcing strategy for transportation, so they want a recommendation about which mode would be best. Alternative Warehouse Location 0.5% 0.5 The company would also like to assess whether its current warehouse location is appropriate based on where customers are located. It provides you the following information about its key markets, and indicates that its orders in each market are roughly proportional to the total population. 2.75 Y 110 122 115 130 Case Questions 1) Calculate measures of forecast accuracy (MFE, MAD and MAPE) using the data from FY2016 and FY2017. Do these forecasts seem adequate for the purposes of decision making? Why or why not? Note unlike your homework/tests where we utilized multiple months this is just for the two years. 2) Develop a forecast for FY2018 using the two forecasting methods currently employed by the company. Comment on which of the forecasts is likely to be more appropriate to support decisions based on your assessment of forecast accuracy from Q1. Based upon this, identify which forecast method that you will use going forward with the project. 3) This question will have you calculating 2 EOQ and ROP values and interpreting the results. For both EOQ and ROP, give your final answer in full sock sets (ROUND UP to the next whole number). The specific questions to answer are based in parts a-c. Tips to solve the EOQ and ROP are given below in bullet points. a) Calculate EOQ and ROP for FY2017 based on the FY2017 forecast value that you recommended in Question #1. b) Calculate the EOQ and ROP based upon actual demand for FY2017 c) Using the responses from parts a & b, indicate what the implications are for inventory management costs in FY2017. In other words, 1. Compare the total costs for both EOQ values and analyze what it shows you. 2. What if any are the implications of the ROP based on the forecast vs the ROP based on actual demand. See additional tips below: • • ● ● Use a service level of 95% (z-1.65) when calculating the ROP Calculate average weekly demand (d) by dividing the forecast by 50 weeks For the variance in weekly demand, use the data provided in the table on page 2 of the case with the FY2017 forecast for all approaches. Remember that there is a difference between variance and standard deviation and how you apply these values in the ROP formula • Annual Inventory management costs will include the following: Annual Holding Costs, Annual Ordering Costs, and Purchase Cost. 4) Currently, the company is purchasing parts not using EOQ and ROP values determined by the tools we are using. These values are given in the case. We have discussed many concepts in SCM 301 related to planning, sourcing, making and delivering products and services. The purpose of this case analysis is to integrate the different elements of the course and to apply cools you have learned evaluate the supply chain performance. Consider yourself a summer intern and your summer assignment to put all you learned in SCM 301 to good use helping the Throx company evaluate their current supply chain practices. You are tasked with evaluating the company's recent performance and recommending changes (decisions) to improve supply chain management performance. The questions that you are required to answer are attached to the end of this case. Company Background Information Throx sells higher-end custom-design socks in three-sock sets (rather than two). The company operates from a small packaging and distribution facility in Richmond, CA from which it ships product to customers. Given the company's location and focus, 97% of sales are in California, primarily in the major urban areas of the San Francisco bay area, Los Angeles, Sacramento (and last but not least) San Diego. The company sells exclusively via online sales, at an average price of $15/three-sock set, plus shipping costs charged to the customer. The company currently orders its product from the Chinese sock manufacturer Zhejiang Datang Hosiery Group Co., Ltd in so-called "Sock City." Socks are shipped via truck to the port of Shanghai, from where they are shipped to the port at Los Angeles-Long Beach via ocean freight. Once offloaded in Los Angeles-Long Beach, the socks are shipped via truck to the Richmond facility. On average, shipment from the manufacturer to the Richmond facility takes 4 weeks. In addition to the transit time required for shipment, the lead time from when an order is placed with the manufacturer to when it is shipped from Zhejiang is 3 weeks. So, the total lead time is considered to be 7 weeks from when Throx places an order til it reaches the Richmond facility. Historically, the standard deviation of lead time has been I week. Product Orders (Demand) Information The company provides you with the following information for the past two fiscal years: Demand Characteristic Annual demand, units Average weekly demand, units Variance of weekly demand, units FY 2016 20,000 417 100 FY 2017 23,000 480 120 Foduct Forecasting Information Thrux uses two main forecasting methods based on annual data to predict orders for the following year, a weighted moving average and exponential smoothing. They provide you with the following information about forecasts for FY 2015 and FY 2016: Year Weighted Moving Exponential Average Forecast Forecast Demand 2016 20,000 17,000 2017 23,000 19,500 Weighted Moving Average uses W₁-0.8 and W₁-1-0.2. Exponential Smoothing uses a 0.9. Inventory Management Information The initial inventory for all sock styles combined at the beginning of FY 2018 is 3,500 units. You also have information on current costs, which includes: • Order cost to Throx for an order placed with its current supplier. S/order=S-$350 • Holding cost per set per per year=H=$5 • The company currently pays $4 for each set of socks. - P 17,200 19,720 The company uses a continuous review replenishment policy, and has IT systems in place that allow constant monitoring of key information. Last year, the company used an ROP under this policy of 1,500 units for all sock styles and an order quantity Q of 5,000 units for all sock styles. Potential Alternatives to Current Supply Chain Management The company has asked you to evaluate a number of alternatives to their current SCM practices, including at a minimum their choice of supplier, transportation modes, warehouse capacity, order quantities and safety stock. Alternative Suppliers The company has contacted potential alternative suppliers in China, who have offered the following information relative to the current supplier: Supplier Characteristic Unit Price, $/3-sock set Order cost, $/order Defect Rate Financial condition of the firm Current Alternative A $ 4.00 $ $ 350.00 $ 1.0% Good Alternative B 3.00 250.00 2.00 $ 200.00 $ 0.5% Poor 4.0% Fair wants to use a single-sourcing strategy, so they want a recommendation about which supplier would be Threx has decided to use the following weights in analyzing the suppliers: Supplier Characteristic Unit Price, $/3-sock set Order cost, $/order Defect Rate Financial condition of the firm Alternative Transportation An alternative to their current transportation approach available to Throx is shipment by UPS Express Air from Shanghai to Richmond, which averages 3.5 days. The comparison of costs is given as: Transporation Supplier Characteristics Units cost, $/sock set Damage Rate Average Transit time, weeks Market LA-Long Beach San Francisco San Diego Sacramento Maersk Ocean Freight (current) $ Population 14,000,000 8,900,000 4,750,000 2,200,000 2.0% 4 Weight 0.4 0.3 0.1 0.2 1.50 $ X 40 37 33 39 UPS AirExpress (Alternative) No data are available about variation in transit times, so Throx assumes this is constant. Similar to their decision about sourcing. Throx wants to use a single-sourcing strategy for transportation, so they want a recommendation about which mode would be best. Alternative Warehouse Location 0.5% 0.5 The company would also like to assess whether its current warehouse location is appropriate based on where customers are located. It provides you the following information about its key markets, and indicates that its orders in each market are roughly proportional to the total population. 2.75 Y 110 122 115 130 Case Questions 1) Calculate measures of forecast accuracy (MFE, MAD and MAPE) using the data from FY2016 and FY2017. Do these forecasts seem adequate for the purposes of decision making? Why or why not? Note unlike your homework/tests where we utilized multiple months this is just for the two years. 2) Develop a forecast for FY2018 using the two forecasting methods currently employed by the company. Comment on which of the forecasts is likely to be more appropriate to support decisions based on your assessment of forecast accuracy from Q1. Based upon this, identify which forecast method that you will use going forward with the project. 3) This question will have you calculating 2 EOQ and ROP values and interpreting the results. For both EOQ and ROP, give your final answer in full sock sets (ROUND UP to the next whole number). The specific questions to answer are based in parts a-c. Tips to solve the EOQ and ROP are given below in bullet points. a) Calculate EOQ and ROP for FY2017 based on the FY2017 forecast value that you recommended in Question #1. b) Calculate the EOQ and ROP based upon actual demand for FY2017 c) Using the responses from parts a & b, indicate what the implications are for inventory management costs in FY2017. In other words, 1. Compare the total costs for both EOQ values and analyze what it shows you. 2. What if any are the implications of the ROP based on the forecast vs the ROP based on actual demand. See additional tips below: • • ● ● Use a service level of 95% (z-1.65) when calculating the ROP Calculate average weekly demand (d) by dividing the forecast by 50 weeks For the variance in weekly demand, use the data provided in the table on page 2 of the case with the FY2017 forecast for all approaches. Remember that there is a difference between variance and standard deviation and how you apply these values in the ROP formula • Annual Inventory management costs will include the following: Annual Holding Costs, Annual Ordering Costs, and Purchase Cost. 4) Currently, the company is purchasing parts not using EOQ and ROP values determined by the tools we are using. These values are given in the case. We have discussed many concepts in SCM 301 related to planning, sourcing, making and delivering products and services. The purpose of this case analysis is to integrate the different elements of the course and to apply cools you have learned evaluate the supply chain performance. Consider yourself a summer intern and your summer assignment to put all you learned in SCM 301 to good use helping the Throx company evaluate their current supply chain practices. You are tasked with evaluating the company's recent performance and recommending changes (decisions) to improve supply chain management performance. The questions that you are required to answer are attached to the end of this case. Company Background Information Throx sells higher-end custom-design socks in three-sock sets (rather than two). The company operates from a small packaging and distribution facility in Richmond, CA from which it ships product to customers. Given the company's location and focus, 97% of sales are in California, primarily in the major urban areas of the San Francisco bay area, Los Angeles, Sacramento (and last but not least) San Diego. The company sells exclusively via online sales, at an average price of $15/three-sock set, plus shipping costs charged to the customer. The company currently orders its product from the Chinese sock manufacturer Zhejiang Datang Hosiery Group Co., Ltd in so-called "Sock City." Socks are shipped via truck to the port of Shanghai, from where they are shipped to the port at Los Angeles-Long Beach via ocean freight. Once offloaded in Los Angeles-Long Beach, the socks are shipped via truck to the Richmond facility. On average, shipment from the manufacturer to the Richmond facility takes 4 weeks. In addition to the transit time required for shipment, the lead time from when an order is placed with the manufacturer to when it is shipped from Zhejiang is 3 weeks. So, the total lead time is considered to be 7 weeks from when Throx places an order til it reaches the Richmond facility. Historically, the standard deviation of lead time has been I week. Product Orders (Demand) Information The company provides you with the following information for the past two fiscal years: Demand Characteristic Annual demand, units Average weekly demand, units Variance of weekly demand, units FY 2016 20,000 417 100 FY 2017 23,000 480 120 Foduct Forecasting Information Thrux uses two main forecasting methods based on annual data to predict orders for the following year, a weighted moving average and exponential smoothing. They provide you with the following information about forecasts for FY 2015 and FY 2016: Year Weighted Moving Exponential Average Forecast Forecast Demand 2016 20,000 17,000 2017 23,000 19,500 Weighted Moving Average uses W₁-0.8 and W₁-1-0.2. Exponential Smoothing uses a 0.9. Inventory Management Information The initial inventory for all sock styles combined at the beginning of FY 2018 is 3,500 units. You also have information on current costs, which includes: • Order cost to Throx for an order placed with its current supplier. S/order=S-$350 • Holding cost per set per per year=H=$5 • The company currently pays $4 for each set of socks. - P 17,200 19,720 The company uses a continuous review replenishment policy, and has IT systems in place that allow constant monitoring of key information. Last year, the company used an ROP under this policy of 1,500 units for all sock styles and an order quantity Q of 5,000 units for all sock styles. Potential Alternatives to Current Supply Chain Management The company has asked you to evaluate a number of alternatives to their current SCM practices, including at a minimum their choice of supplier, transportation modes, warehouse capacity, order quantities and safety stock. Alternative Suppliers The company has contacted potential alternative suppliers in China, who have offered the following information relative to the current supplier: Supplier Characteristic Unit Price, $/3-sock set Order cost, $/order Defect Rate Financial condition of the firm Current Alternative A $ 4.00 $ $ 350.00 $ 1.0% Good Alternative B 3.00 250.00 2.00 $ 200.00 $ 0.5% Poor 4.0% Fair wants to use a single-sourcing strategy, so they want a recommendation about which supplier would be Threx has decided to use the following weights in analyzing the suppliers: Supplier Characteristic Unit Price, $/3-sock set Order cost, $/order Defect Rate Financial condition of the firm Alternative Transportation An alternative to their current transportation approach available to Throx is shipment by UPS Express Air from Shanghai to Richmond, which averages 3.5 days. The comparison of costs is given as: Transporation Supplier Characteristics Units cost, $/sock set Damage Rate Average Transit time, weeks Market LA-Long Beach San Francisco San Diego Sacramento Maersk Ocean Freight (current) $ Population 14,000,000 8,900,000 4,750,000 2,200,000 2.0% 4 Weight 0.4 0.3 0.1 0.2 1.50 $ X 40 37 33 39 UPS AirExpress (Alternative) No data are available about variation in transit times, so Throx assumes this is constant. Similar to their decision about sourcing. Throx wants to use a single-sourcing strategy for transportation, so they want a recommendation about which mode would be best. Alternative Warehouse Location 0.5% 0.5 The company would also like to assess whether its current warehouse location is appropriate based on where customers are located. It provides you the following information about its key markets, and indicates that its orders in each market are roughly proportional to the total population. 2.75 Y 110 122 115 130 Case Questions 1) Calculate measures of forecast accuracy (MFE, MAD and MAPE) using the data from FY2016 and FY2017. Do these forecasts seem adequate for the purposes of decision making? Why or why not? Note unlike your homework/tests where we utilized multiple months this is just for the two years. 2) Develop a forecast for FY2018 using the two forecasting methods currently employed by the company. Comment on which of the forecasts is likely to be more appropriate to support decisions based on your assessment of forecast accuracy from Q1. Based upon this, identify which forecast method that you will use going forward with the project. 3) This question will have you calculating 2 EOQ and ROP values and interpreting the results. For both EOQ and ROP, give your final answer in full sock sets (ROUND UP to the next whole number). The specific questions to answer are based in parts a-c. Tips to solve the EOQ and ROP are given below in bullet points. a) Calculate EOQ and ROP for FY2017 based on the FY2017 forecast value that you recommended in Question #1. b) Calculate the EOQ and ROP based upon actual demand for FY2017 c) Using the responses from parts a & b, indicate what the implications are for inventory management costs in FY2017. In other words, 1. Compare the total costs for both EOQ values and analyze what it shows you. 2. What if any are the implications of the ROP based on the forecast vs the ROP based on actual demand. See additional tips below: • • ● ● Use a service level of 95% (z-1.65) when calculating the ROP Calculate average weekly demand (d) by dividing the forecast by 50 weeks For the variance in weekly demand, use the data provided in the table on page 2 of the case with the FY2017 forecast for all approaches. Remember that there is a difference between variance and standard deviation and how you apply these values in the ROP formula • Annual Inventory management costs will include the following: Annual Holding Costs, Annual Ordering Costs, and Purchase Cost. 4) Currently, the company is purchasing parts not using EOQ and ROP values determined by the tools we are using. These values are given in the case.
Expert Answer:
Answer rating: 100% (QA)
Calculate measures of forecast accuracy MFE MAD and MAPE using the data from FY2016 and FY2017 Do these forecasts seem adequate for the purposes of decisionmaking Why or why not To calculate the forec... View the full answer

Related Book For 

Accounting
ISBN: 978-0324662962
23rd Edition
Authors: Jonathan E. Duchac, James M. Reeve, Carl S. Warren
Posted Date:
Students also viewed these accounting questions
-
You work for a pharmaceutical company that has developed a new drug. The patent on the drug will last 5 years. You expect that the drugs profits will be $4 million in its first year and that this...
-
Write a program that prompts the user for four 32-bit integers, stores them in an array, calculates the sum of the array, and displays the sum on the screen. The program also display the smallest and...
-
Income or expenses that arises from events or transactions that are clearly distinct from the ordinary activities of the enterprises and therefore are not expected to recur frequently or regularly...
-
Which of the following do ergonomics most directly address? Physical wellbeing Mental wellbeing Emotional wellbeing Social wellbeing
-
Smith will earn a profit of $200 next year if an oil pipeline is built in Nebraska or $60 if it is not built. Jones will earn $20 if the pipeline is built or $120 if it is not built. The probability...
-
Discuss some of the challenges that service parts logistics creates for logistics managers.
-
After returning from a skiing vacation in Vermont, Leslie Adel came down with Legionnaires Disease. He claimed it was from the water drunk at the ski resort and provided by Greensprings of Vermont...
-
Oasis Health Care Inc. is owned and operated by Dr. George Hancock, the sole stockholder. During January 2013, Oasis Health Care entered into the following transactions: Jan. 1 Received $15,000 from...
-
Mary, Shannon, and Anika each invested $9,000, $25,000, and $18,000, respectively, into a business. a. Calculate their investment ratio reduced to the lowest terms. 0 : 0 : 0
-
What are the three basic forms of business organizations?
-
Ted is the sole shareholder of a C corporation, and Sue owns a sole proprietorship. Both businesseswere started in 2011, and each business sustained a $5,000 net capital loss for the year. Which of...
-
Melody owns a life estate in a house. It has a casita in the backyard which has been rented for many years to the same man, but her tenant has decided to not renew his lease. Melody has recently...
-
Medicare put into effect a payment system for physician services by placing a value on procedures performed on an outpatient basis. This payment system is based o a geographic area, malpractice...
-
There are many leadership theories, and there are courses in other fields that cover this material in our program. From the perspective of learning and development, we present many different aspects...
-
Evaluate the following given f(x) = 4x + 3 and g(x) = x + 4x -1. 1. (f+g)(x) 2. (f-g)(x)
-
What are some of the current barriers to increasing financial literacy among Millenials? What are some challenges and opportunities to help increase the knowledge base, especially for those who are...
-
Consider eight data points. The following matrix shows the pairwise distances between any two points. 1 2 3 4 5 6 7 8 1 0 2 11 0 3 5 13 0 4 12 2 14 0 5 7 17 1 18 0 6 13 4 15 5 20 0 7 9 15 12 16 15 19...
-
Consider the discrete group G of order 8 that has the following Cayley diagram e If we have the sequence of operations: fcagec, which of the options represents the reduction of the sequence to a...
-
Determine the present value of $100,000 to be received at the end of each of four years, using an interest rate of 6%, compounded annually, as follows: (a) By successive computations, using the...
-
Beets Company sells a product for $75 per unit. The variable cost is $65 per unit, and fixed costs are $100,000. Determine (a) The break-even point in sales units and (b) The break-even point in...
-
Thomson Company estimates that total factory overhead costs will be $600,000 for the year. Direct labor hours are estimated to be 250,000. For Thomson Company, (a) Determine the predetermined factory...
-
When marginal cost equals the minimum point of average variable cost, what is true about the average productivity and marginal productivity of workers?
-
What determines the distance between the average total cost and the average variable cost?
-
If average productivity falls, will marginal cost necessarily rise? How about average cost?

Study smarter with the SolutionInn App