

Solve using Python spyder. The airline_delay on the right is just a snapshot of the file. explain
Fantastic news! We've Found the answer you've been seeking!
Question:
Solve using Python spyder. The airline_delay on the right is just a snapshot of the file. explain in steps.
Transcribed Image Text:
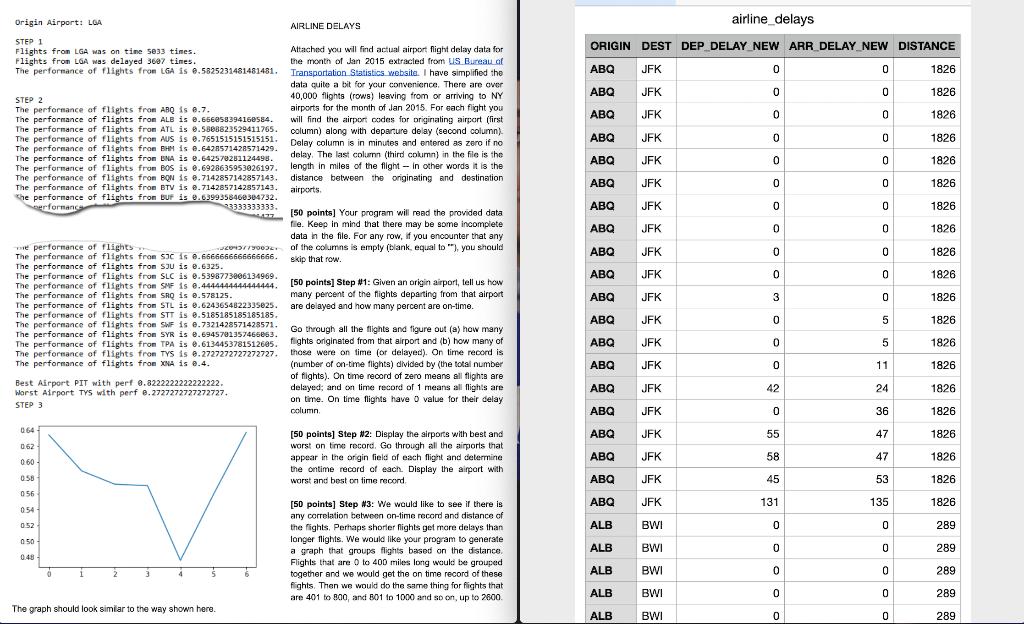
Origin Airport: LGA STEP 1 Flights from LGA was on time 5033 times. Flights from LGA was delayed 3607 times. The performance of flights from LGA is 0.5825231481481481. STEP 2 The performance of flights from ABQ is 0.7. The performance of flights from ALB is 0.656058394160584. The performance of flights from ATL is 0.5808823529411765. The performance of flights from AUS is 0.7651515151515151. The performance of flights from BHM is 0.6428571428571429. The performance of flights from BNA is 0.642578281124498. The performance of flights from BOS is 0.6928635953026197. The performance of flights from BQN is 0.7142857142857143. The performance of flights from BTV is 0.7142857142857143. the performance of flights from BUF is 0.6399358460364732. performance 3333333333. e performance of flights The performance of flights from $3C is The performance of flights from SJU is 0.6325. The performance of flights from SLC is 0.5398773006134969. The performance of flights from SMF is 0.4444444444444444. The performance of flights from SRQ is 0.578125. The performance of flights from STL is 0.6243654822335025. The performance of flights from STT is 0.5185185185185185. The performance of flights from SWF is 0.7321428571428571. The performance of flights from SYR is 0.6945701357466863. The performance of flights from TPA is 0.6134453781512605. The performance of flights from TYS is 0.2727272727272727. The performance of flights from XNA is 8.4. Best Airport PIT with perf 0.8222222222222222. Worst Airport TYS with perf 8.2727272727272727. STEP 3 064 0.62 0.60 0.58 att 056 ATL 0.54 0.52 0:50 0.48- 3 220437/90032 0.6666666666666666. 4 ś The graph should look similar to the way shown here. AIRLINE DELAYS Attached you will find actual airport flight delay data for the month of Jan 2015 extracted from US Bureau of Transportation Statistics website. I have simplified the data quite a bit for your convenience. There are over 40,000 flights (rows) leaving from or arriving to NY airports for the month of Jan 2015. For each flight you will find the airport codes for originating airport (first column) along with departure delay (second column) Delay column is in minutes and entered as zero if no delay. The last column (third column) in the file is the length in miles of the flight in other words it is the distance between the originating and destination airports. [50 points] Your program will read the provided data file. Keep in mind that there may be some incomplete data in the file. For any row, if you encounter that any of the columns is empty (blank, equal to "), you should skip that row. [50 points] Step #1: Given an origin airport, tell us how many percent of the flights departing from that airport are delayed and how many percent are on-time. Go through all the flights and figure out (a) how many flights originated from that airport and (b) how many of those were on time (or delayed). On time record is (number of on-time flights) divided by (the total number of flights). On time record of zero means all flights are delayed; and on time record of 1 means all flights are on time. On time flights have 0 value for their delay column. [50 points] Step #2: Display the airports with best and worst on time record. Go through all the airports that appear in the origin field of each flight and determine the ontime record of each. Display the airport with worst and best on time record. [50 points] Step #3: We would like to see if there is any correlation between on-time record and distance of the fights. Perhaps shorter flights get more delays than longer flights. We would like your program to generate a graph that groups flights based on the distance. Flights that are 0 to 400 miles long would be grouped together and we would get the on time record of these fights. Then we would do the same thing for flights that are 401 to 800, and 801 to 1000 and so on, up to 2600. airline_delays ORIGIN DEST DEP_DELAY NEW ARR_DELAY NEW DISTANCE ABQ JFK ABQ JFK ABQ JFK ABQ JFK ABQ JFK ABQ JFK ABQ JFK ABQ JFK ABQ JFK ABQ JFK ABQ JFK ABQ JFK ABQ JFK ABQ JFK ABQ JFK ABQ JFK ABQ JFK ABQ JFK ABQ JFK ABQ JFK ALB BWI ALB BWI ALB BWI ALB BWI ALB BWI 0 0 0 0 0 0 0 0 0 0 3 0 0 0 42 0 55 58 45 131 0 0 0 0 0 0 0 0 0 0 0 0 0 0 0 0 5 5 11 24 36 47 47 53 135 0 0 0 0 0 1826 1826 1826 1826 1826 1826 1826 1826 1826 1826 1826 1826 1826 1826 1826 1826 1826 1826 1826 1826 289 289 289 289 289 Origin Airport: LGA STEP 1 Flights from LGA was on time 5033 times. Flights from LGA was delayed 3607 times. The performance of flights from LGA is 0.5825231481481481. STEP 2 The performance of flights from ABQ is 0.7. The performance of flights from ALB is 0.656058394160584. The performance of flights from ATL is 0.5808823529411765. The performance of flights from AUS is 0.7651515151515151. The performance of flights from BHM is 0.6428571428571429. The performance of flights from BNA is 0.642578281124498. The performance of flights from BOS is 0.6928635953026197. The performance of flights from BQN is 0.7142857142857143. The performance of flights from BTV is 0.7142857142857143. the performance of flights from BUF is 0.6399358460364732. performance 3333333333. e performance of flights The performance of flights from $3C is The performance of flights from SJU is 0.6325. The performance of flights from SLC is 0.5398773006134969. The performance of flights from SMF is 0.4444444444444444. The performance of flights from SRQ is 0.578125. The performance of flights from STL is 0.6243654822335025. The performance of flights from STT is 0.5185185185185185. The performance of flights from SWF is 0.7321428571428571. The performance of flights from SYR is 0.6945701357466863. The performance of flights from TPA is 0.6134453781512605. The performance of flights from TYS is 0.2727272727272727. The performance of flights from XNA is 8.4. Best Airport PIT with perf 0.8222222222222222. Worst Airport TYS with perf 8.2727272727272727. STEP 3 064 0.62 0.60 0.58 att 056 ATL 0.54 0.52 0:50 0.48- 3 220437/90032 0.6666666666666666. 4 ś The graph should look similar to the way shown here. AIRLINE DELAYS Attached you will find actual airport flight delay data for the month of Jan 2015 extracted from US Bureau of Transportation Statistics website. I have simplified the data quite a bit for your convenience. There are over 40,000 flights (rows) leaving from or arriving to NY airports for the month of Jan 2015. For each flight you will find the airport codes for originating airport (first column) along with departure delay (second column) Delay column is in minutes and entered as zero if no delay. The last column (third column) in the file is the length in miles of the flight in other words it is the distance between the originating and destination airports. [50 points] Your program will read the provided data file. Keep in mind that there may be some incomplete data in the file. For any row, if you encounter that any of the columns is empty (blank, equal to "), you should skip that row. [50 points] Step #1: Given an origin airport, tell us how many percent of the flights departing from that airport are delayed and how many percent are on-time. Go through all the flights and figure out (a) how many flights originated from that airport and (b) how many of those were on time (or delayed). On time record is (number of on-time flights) divided by (the total number of flights). On time record of zero means all flights are delayed; and on time record of 1 means all flights are on time. On time flights have 0 value for their delay column. [50 points] Step #2: Display the airports with best and worst on time record. Go through all the airports that appear in the origin field of each flight and determine the ontime record of each. Display the airport with worst and best on time record. [50 points] Step #3: We would like to see if there is any correlation between on-time record and distance of the fights. Perhaps shorter flights get more delays than longer flights. We would like your program to generate a graph that groups flights based on the distance. Flights that are 0 to 400 miles long would be grouped together and we would get the on time record of these fights. Then we would do the same thing for flights that are 401 to 800, and 801 to 1000 and so on, up to 2600. airline_delays ORIGIN DEST DEP_DELAY NEW ARR_DELAY NEW DISTANCE ABQ JFK ABQ JFK ABQ JFK ABQ JFK ABQ JFK ABQ JFK ABQ JFK ABQ JFK ABQ JFK ABQ JFK ABQ JFK ABQ JFK ABQ JFK ABQ JFK ABQ JFK ABQ JFK ABQ JFK ABQ JFK ABQ JFK ABQ JFK ALB BWI ALB BWI ALB BWI ALB BWI ALB BWI 0 0 0 0 0 0 0 0 0 0 3 0 0 0 42 0 55 58 45 131 0 0 0 0 0 0 0 0 0 0 0 0 0 0 0 0 5 5 11 24 36 47 47 53 135 0 0 0 0 0 1826 1826 1826 1826 1826 1826 1826 1826 1826 1826 1826 1826 1826 1826 1826 1826 1826 1826 1826 1826 289 289 289 289 289
Expert Answer:
Answer rating: 100% (QA)
Read the CSV files containing the airline delay data into a single DataFrame Then display the total number of rows imported Change the date column to date format YYYYM eg 20181 Then perform explorator... View the full answer

Related Book For 

Public Finance A Contemporary Application of Theory to Policy
ISBN: 978-1285173955
11th edition
Authors: David N Hyman
Posted Date:
Students also viewed these physics questions
-
The Excel file titled airline performance. xlsx lists the status of 100 flights as either on time or late along with the airline for that flight. a. Construct a contingency table for these data. b....
-
Using python in programming essentials a local small business has hired you to write a payroll calculation program. The program only needs to calculate gross pay for an employee and display the...
-
Define the following byte size data elements (A, B) in the data segment starting at memory offest 400h : ECH, CCH, and two word size data elements (C, D) in the data segment starting at memory offest...
-
How many orders of magnitude is 3 . 2 \ times 1 0 - 9 m smaller than 0 . 0 0 0 0 4 m ?
-
What are the Statements on Standards for Tax Services? Who issues them?
-
Given the average flow velocity and the flow depth, explain how you would determine if the flow in open channels is tranquil, critical, or rapid.
-
Incomplete information concerning the financial performance of two manufacturing companies is presented below. Required Determine the answers to (a) to(f) for the two companies. Work in process,...
-
The COSO internal control framework identifies five internal control components. Which of those components is most relevant to the procedures that SOX mandates public companies establish to enable,...
-
3 - The company purchasedequipment worth $ 4 1 , 0 0 0 onJuly 1 st . The equipment had a ten year life. What is the amount that should be used for the third adjusting entry provided.
-
A researcher at the Medical College of Virginia conducted a study of 60 randomly selected male soccer players and concluded that frequently heading the ball in soccer lowers players IQs (USA Today,...
-
Janice is wealthy and generous single woman and has given gifts in excess of $40,000,000 in taxable gifts over the last 20 years. This year she gave a gift of $552,709 to her daughter. She promptly...
-
Over the past four years, the return on ABCs stock has been 11%, 0%, -6%, and 18%. Based on this information, what is the expected return and standard deviation of ABCs annual returns?
-
What are the nonverbal cues that are important during a presentation? State why each of them are important.
-
Did Netflix do the same jobs for consumers that Blockbuster did? How did this evolve over time? Using the profit model in the study guide, discuss difference between Netflix and Blockbuster's profit...
-
Transmittal letter (cover letter that describes your proposal project) Natural versus Man-made Disasters Table of Contents Informative abstract
-
Is it beneficial to change your style of leadership ( Visionary leaders , Coaching leaders , Affiliative leaders , Democratic leaders , Pacesetting leaders, Commanding leaders) based on the moment or...
-
Required information [The following information applies to the questions displayed below.] The following trial balance was drawn from the records of Jordan Company as of October 1, year 2. Cash...
-
Three successive resonance frequencies in an organ pipe are 1310, 1834, and 2358 Hz. (a) Is the pipe closed at one end or open at both ends? (b) What is the fundamental frequency? (c) What is the...
-
The current tax rate paid by employees in a company on their income is 30 percent. Currently, the employer provides workers with a health insurance policy that is worth $3,000 per year. a. Assuming...
-
Suppose the services of a road are subject to congestion after 50,000 vehicles per hour enter the road. Assume that it is feasible to price road services on an hourly basis. Use a graph like that...
-
Municipal zoning laws often are used as a means of controlling the population and income levels of citizens in a political jurisdiction. How can zoning laws that require homes to be built on a...
-
Natural gas (methane) flows from a 3-in.-diameter gas main, through a 1-in.-diameter pipe, and into the burner of a furnace at a rate of \(100 \mathrm{ft}^{3} /\) hour. Determine the pressure in the...
-
SAE 30 oil at \(60^{\circ} \mathrm{F}\) flows through a 2-in.-diameter pipe with a mean velocity of \(5 \mathrm{ft} / \mathrm{s}\). Determine the value of the Reynolds number (see Example 1.4)....
-
Calculate the Reynolds numbers for the flow of water and for air through a 4-mm-diameter tube, if the mean velocity is \(3 \mathrm{~m} / \mathrm{s}\) and the temperature is \(30^{\circ} \mathrm{C}\)...

Study smarter with the SolutionInn App