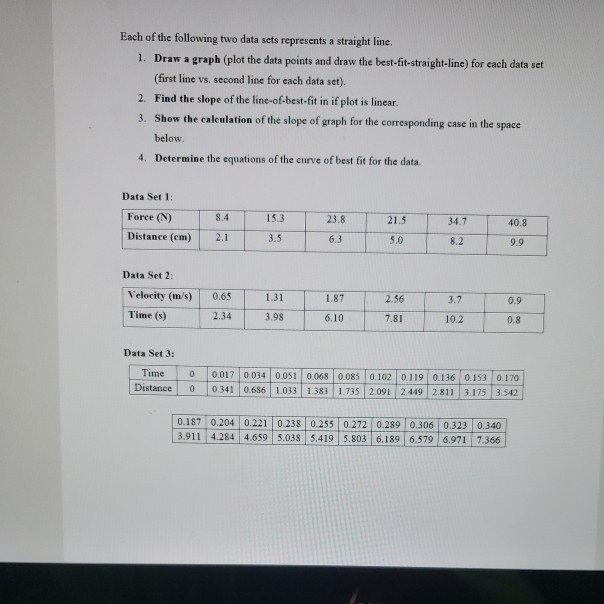
Each of the following two data sets represents a straight line. 1. Draw a graph (plot...
Fantastic news! We've Found the answer you've been seeking!
Question:
Transcribed Image Text:
Each of the following two data sets represents a straight line. 1. Draw a graph (plot the data points and draw the best-fit-straight-line) for each data set (first line vs. second line for each data set). 2. Find the slope of the line-of-best-fit in if plot is linear. 3. Show the caleulation of the slope of graph for the corresponding case in the space below. 4. Determine the equations of the curve of best fit for the data. Data Set 1: Force (N) 8.4 15.3 23.8 21.5 34.7 40.8 Distance (em) 2.1 3.5 6.3 5.0 8.2 9.9 Data Set 2: Velocity (m/s) 0.65 1.31 1.87 2.56 3.7 0.9 Time (s) 2.34 3.98 6.10 7.81 10.2 0.8 Data Set 3: Time 0.017 0.0340.051 0.068 0.085 0.102 0.119 0.136 0.153 0.170o 0.341 0.686 1.033 1.383 1.735 2.091 2.449 2.811 3.175 3.542 Distance 0.187 0.204 0.221 0.238 0.255 0.272 0.289 0.306 0.323 0.340 3.911 4.284 4.659 5.038 5.419 5.803 6.189 6.579 6.971 7.366 Each of the following two data sets represents a straight line. 1. Draw a graph (plot the data points and draw the best-fit-straight-line) for each data set (first line vs. second line for each data set). 2. Find the slope of the line-of-best-fit in if plot is linear. 3. Show the caleulation of the slope of graph for the corresponding case in the space below. 4. Determine the equations of the curve of best fit for the data. Data Set 1: Force (N) 8.4 15.3 23.8 21.5 34.7 40.8 Distance (em) 2.1 3.5 6.3 5.0 8.2 9.9 Data Set 2: Velocity (m/s) 0.65 1.31 1.87 2.56 3.7 0.9 Time (s) 2.34 3.98 6.10 7.81 10.2 0.8 Data Set 3: Time 0.017 0.0340.051 0.068 0.085 0.102 0.119 0.136 0.153 0.170o 0.341 0.686 1.033 1.383 1.735 2.091 2.449 2.811 3.175 3.542 Distance 0.187 0.204 0.221 0.238 0.255 0.272 0.289 0.306 0.323 0.340 3.911 4.284 4.659 5.038 5.419 5.803 6.189 6.579 6.971 7.366
Expert Answer:
Related Book For
Finite Mathematics and Its Applications
ISBN: 978-0134768632
12th edition
Authors: Larry J. Goldstein, David I. Schneider, Martha J. Siegel, Steven Hair
Posted Date:
Students also viewed these accounting questions
-
Plot each pair of points, draw the straight line through them, and find its slope. 1. (3, 4), (7, 9) 2. (- 2, 1), (3, - 3)
-
A back-to-back stem-and-leaf plot compares two data sets by using the same stems for each data set. Leaves for the first data set are on one side while leaves for the second data set are on the other...
-
Fit a straight line to the observed values given in Table 11.1 so that the sum of the squares of the horizontal deviations of the points from the line is a minimum. Sketch on the same graph both this...
-
Chris Co. purchased a piece of equipment and incurred the following costs. Which of these costs is properly capitalized and recorded as part of the cost of the equipment? I. Freight charges to...
-
A random variable has the following exponential PDF: Where and are constants. (a) Determine the required relationship between a and b. (b) Determine the corresponding CDF. 26. 0, otherwise,
-
(a) Use the equation of state for an ideal gas and the definition of the coefficient of volume expansion, in the form = (1/V) dV/dT, to show that the coefficient of volume expansion for an ideal gas...
-
The activity of a component depends on (a) Temperature only (c) Temperature, pressure and composition (b) Temperature and pressure only (d) None of these.
-
Karen Swift is president of an accounting firm that has 10 employees. The only employee benefit provided by the firm is a paid two-week vacation for employees with one or more years of service. The...
-
What are the key differences between monolithic and microkernel architectures in operating systems, and how do they impact system performance, scalability, and reliability ?
-
You will need to adapt the configuration on both Newton and Einstein and configure the Heisenberg and Schrodinger switches to complete this task. You will need to VLSM the network, to ensure that...
-
Consumers benefit from advertising: A) only when they gain information. B) if the advertising is not persuasive. C) because it leads to lower prices for some products. D) only when the advertising is...
-
Do customers find it easy to transact with your company? If not, what initiatives are underway to make this easier?
-
What is the expected monetary value (EMV) criterion? Briefly explain how this criterion is applied.
-
What role should value play in pricing considerations and conversations throughout the customer journey?
-
What is the key difference between cost-based and value-based digital pricing strategies?
-
Describe why good decisions sometimes result in bad outcomes.
-
The purchase and sale agreement is contingent upon the?
-
Why is the national security argument for tariffs questionable?
-
Determine whether or not the given matrix is stochastic. If so, determine if it is regular, absorbing, or neither. 1. 2. 3. 4. .1 2 3 .6. .1 2 .2 2 .2 3 3 3 3 L.4 .4 4 4
-
The incidence of color blindness among the men in a certain country is 20%. Find the expected number of color-blind men in a random sample of 70 men. What is the probability of finding exactly that...
-
person claims to have ESP (extrasensory perception). A coin is tossed 16 times, and each time, the person is asked to predict in advance whether the coin will land heads or tails. The person predicts...
-
Explain the principle of hit-and-run entry in the context of a perfectly contestable market.
-
Is it possible for a firm or firms operating in a natural monopoly to be subject to contestability? Explain.
-
Firms like Google, Facebook, Amazon, Apple and Netflix are relatively new players in their respective markets, albeit that all are basically part of the tech industry. They can all be seen as having...
Study smarter with the SolutionInn App