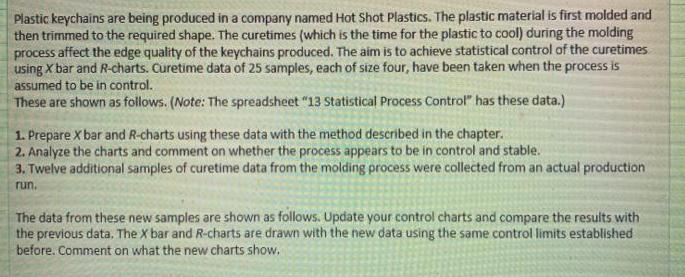
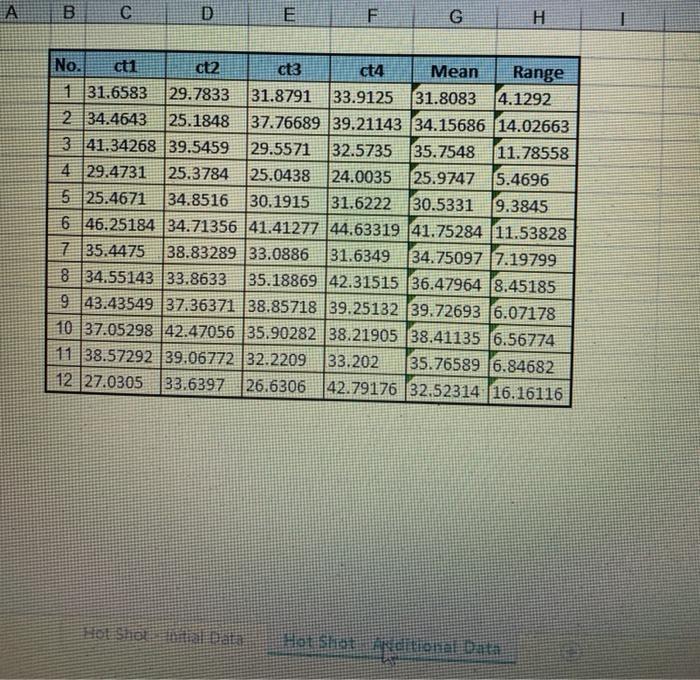
Plastic keychains are being produced in a company named Hot Shot Plastics. The plastic material is...
Fantastic news! We've Found the answer you've been seeking!
Transcribed Image Text:
Plastic keychains are being produced in a company named Hot Shot Plastics. The plastic material is first molded and then trimmed to the required shape. The curetimes (which is the time for the plastic to cool) during the molding process affect the edge quality of the keychains produced. The aim is to achieve statistical control of the curetimes using X bar and R-charts. Curetime data of 25 samples, each of size four, have been taken when the process is assumed to be in control. These are shown as follows. (Note: The spreadsheet "13 Statistical Process Control" has these data.) 1. Prepare X bar and R-charts using these data with the method described in the chapter. 2. Analyze the charts and comment on whether the process appears to be in control and stable. 3. Twelve additional samples of curetime data from the molding process were collected from an actual production. run. The data from these new samples are shown as follows. Update your control charts and compare the results with the previous data, The X bar and R-charts are drawn with the new data using the same control limits established before. Comment on what the new charts show. A No. B. ct3 ct4 Mean Range ctl ct2 27.34667 27. 50085 29.94412 28.21249 28.25103 2.59745 27.79695 26.15006 31.21295 31.33272 29.12317 5.18266 31.053 30.90497 4.20284 8.5413 5.44605 33.53255 29.32971 29.7046 4 37.98409 32.26942 31.91741 29.44279 32.90343 33.82722 30.32543 28.38117 33.70124 31.55877 29.68356 29.56677 27.23077 34.00417 30.12132 6.7734 9.85168 6.09553 3.99227 7. 32.6264 26.3203 32.07892| 36.17198 31.7994 30.29575 30.52868 24.43315| 26.85241 28.0275 28.43856 30.48251 32.43083 30.76162 30.52838 28.2779 33.94916 30.47406 28.87447 11 26.91885 27.66133 31.46936 29.66928 28.92971 4.55051 12 28.46547 28.29937 28.99441 31.14511 29.22609 13 32.42677 10 30.3939 5.67126 2.84574 26.1041 29.47718| 37.20079 31.30221 11.09669 14 28.84273 30.51801 32.23614 30.47104 30.51698 15 30.75136 32.99922 28.08452 26.19981 29.50873 16 31.25754 24.29473 35.46477 28.41126 29.85708 11.17004 17 31.24921 28.57954| 35.00865 31.23591 31.51833 18 31.41554 35.80049| 33.60909 27.82131 32.16161 19 3.39341 6.79941 6.42911 7.97918 3.33398 7.01093 32.2023 32.02005 32.71018 20 26.91603 29.77775 33.92696 33.78366 21 35.05322 32.93284 31.51641 27.73615 31.80966 22 32.12483 29.32853 30 99709 31.39641 30.96172 23 30.09172 32.43938 27 84725 30.70726 24 30.04835 27.23709 22.01801 28.69624 26.99992 25 29.30273 30.83735 30.82735 31.90733 30.71869 29.3762 31.57718 31.1011 7.31707 2.7963 30.2714 4.59213 8.03034 2.6046 23 5. 6, A D E G H Range 4.1292 No. ct1 ct2 ct3 ct4 Мean 1 31.6583 29.7833 31.8791 33.9125 31.8083 2 34.4643 25.1848 37.76689 39.21143 34.15686 14.02663 3 41.34268 39.5459 4 29.4731 29.5571 32.5735 35.7548 11.78558 24.0035 25.9747 5.4696 25.3784 25.0438 30.5331 9.3845 5 25.4671 6 46.25184 34.71356 41.41277 44.63319 [41.75284 [11.53828 735.4475 34.8516 30.1915 31.6222 38.83289 33.0886 31.6349 34.75097 7.19799 8 34.55143 33.8633 35.18869 42.31515 [36.47964 8.45185 9 43.43549 37.36371 38.85718 |39.25132 39.72693 [6.07178 10 37.05298 42.47056 35.90282 38.21905 38.41135 6.56774 11 38.57292 39.06772 |32.2209 33.202 35.76589 6.84682 12 27.0305 33.6397 26.6306 42.79176 32.52314 16.16116 Hor Shat enal Data Plastic keychains are being produced in a company named Hot Shot Plastics. The plastic material is first molded and then trimmed to the required shape. The curetimes (which is the time for the plastic to cool) during the molding process affect the edge quality of the keychains produced. The aim is to achieve statistical control of the curetimes using X bar and R-charts. Curetime data of 25 samples, each of size four, have been taken when the process is assumed to be in control. These are shown as follows. (Note: The spreadsheet "13 Statistical Process Control" has these data.) 1. Prepare X bar and R-charts using these data with the method described in the chapter. 2. Analyze the charts and comment on whether the process appears to be in control and stable. 3. Twelve additional samples of curetime data from the molding process were collected from an actual production. run. The data from these new samples are shown as follows. Update your control charts and compare the results with the previous data, The X bar and R-charts are drawn with the new data using the same control limits established before. Comment on what the new charts show. A No. B. ct3 ct4 Mean Range ctl ct2 27.34667 27. 50085 29.94412 28.21249 28.25103 2.59745 27.79695 26.15006 31.21295 31.33272 29.12317 5.18266 31.053 30.90497 4.20284 8.5413 5.44605 33.53255 29.32971 29.7046 4 37.98409 32.26942 31.91741 29.44279 32.90343 33.82722 30.32543 28.38117 33.70124 31.55877 29.68356 29.56677 27.23077 34.00417 30.12132 6.7734 9.85168 6.09553 3.99227 7. 32.6264 26.3203 32.07892| 36.17198 31.7994 30.29575 30.52868 24.43315| 26.85241 28.0275 28.43856 30.48251 32.43083 30.76162 30.52838 28.2779 33.94916 30.47406 28.87447 11 26.91885 27.66133 31.46936 29.66928 28.92971 4.55051 12 28.46547 28.29937 28.99441 31.14511 29.22609 13 32.42677 10 30.3939 5.67126 2.84574 26.1041 29.47718| 37.20079 31.30221 11.09669 14 28.84273 30.51801 32.23614 30.47104 30.51698 15 30.75136 32.99922 28.08452 26.19981 29.50873 16 31.25754 24.29473 35.46477 28.41126 29.85708 11.17004 17 31.24921 28.57954| 35.00865 31.23591 31.51833 18 31.41554 35.80049| 33.60909 27.82131 32.16161 19 3.39341 6.79941 6.42911 7.97918 3.33398 7.01093 32.2023 32.02005 32.71018 20 26.91603 29.77775 33.92696 33.78366 21 35.05322 32.93284 31.51641 27.73615 31.80966 22 32.12483 29.32853 30 99709 31.39641 30.96172 23 30.09172 32.43938 27 84725 30.70726 24 30.04835 27.23709 22.01801 28.69624 26.99992 25 29.30273 30.83735 30.82735 31.90733 30.71869 29.3762 31.57718 31.1011 7.31707 2.7963 30.2714 4.59213 8.03034 2.6046 23 5. 6, A D E G H Range 4.1292 No. ct1 ct2 ct3 ct4 Мean 1 31.6583 29.7833 31.8791 33.9125 31.8083 2 34.4643 25.1848 37.76689 39.21143 34.15686 14.02663 3 41.34268 39.5459 4 29.4731 29.5571 32.5735 35.7548 11.78558 24.0035 25.9747 5.4696 25.3784 25.0438 30.5331 9.3845 5 25.4671 6 46.25184 34.71356 41.41277 44.63319 [41.75284 [11.53828 735.4475 34.8516 30.1915 31.6222 38.83289 33.0886 31.6349 34.75097 7.19799 8 34.55143 33.8633 35.18869 42.31515 [36.47964 8.45185 9 43.43549 37.36371 38.85718 |39.25132 39.72693 [6.07178 10 37.05298 42.47056 35.90282 38.21905 38.41135 6.56774 11 38.57292 39.06772 |32.2209 33.202 35.76589 6.84682 12 27.0305 33.6397 26.6306 42.79176 32.52314 16.16116 Hor Shat enal Data
Expert Answer:
Answer rating: 100% (QA)
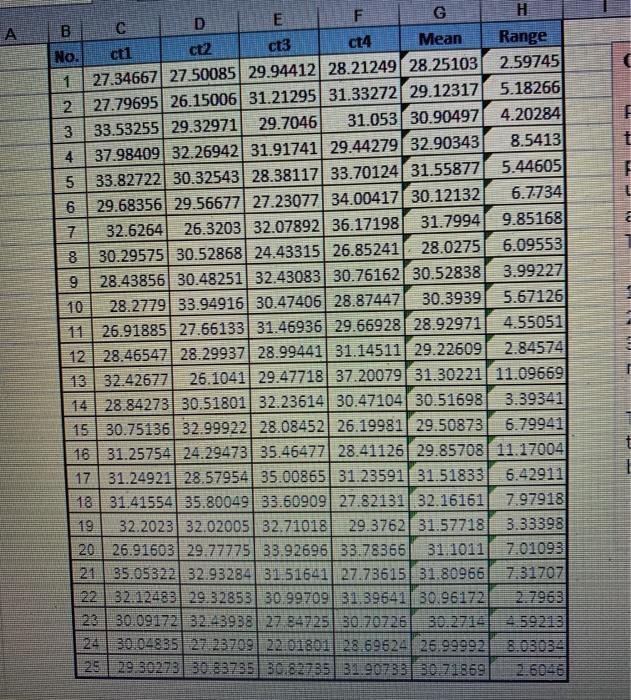
Step 1 of 4 Following data shows the Mean and range for 25 samples as well as the values of the aver... View the full answer
Related Book For
Fundamentals of Analytical Chemistry
ISBN: 978-0495558286
9th edition
Authors: Douglas A. Skoog,Donald M. West, F. James Holler, Stanley R. Crouch
Posted Date:
Students also viewed these accounting questions
-
The method described in Problem 5-8 is to be used for the analysis of ores that assay about 1.2% gold. What minimum sample mass should be taken if the relative error resulting from a 0.4-mg loss is...
-
Estimate process capability using the x and R charts for the power supply voltage data in Exercise 6.8 (note that early printings of the 7th edition indicate Exercise 6.2). If specifications are at...
-
Consider the following: Activity A ano Lu - 2200 2400 500 2200 E 600 3600 F G 4 1100 What is the cost for crashing the project by 6 days? B C Normal time 4 D 2380 03 + Crash time Normal cost Crash...
-
What is the result of executing the Clownfish program? A. The code compiles and prints swim! B. The code compiles and prints fish! C. The code compiles and prints a stack trace. D. One line of the...
-
Last year, consumers increasingly bought fleece (industry jargon for hot selling jogging suits, which now rival jeans as the uniform for casual attire). A New York designer of jogging suits is...
-
Using Program8 . m, find the steady-state response of a three-degree-of-freedom system with the following data: W == 25.076 rad/s, Si = 0.001, i = = w2 53.578 rad/s, 1,2,3 = w3 110.907 rad/s
-
What aspects of an organization's activities could be measured in a social audit?
-
A firm whose shares traded at three times their book value on December 31, 2008, had the accompanying financial statements. Amounts are in millions of dollars. The firm's marginal tax rate is 33...
-
Sketch the graph of f(x,y)=4x+y-4. State the domain and range of the function. ITH (0,0,4) (1,0,0) (0-4,0) (0.4.0) (1,0,0) (0,0,-4) y (4,0,0) (0,-1,0) Find the domain of the function. Select the...
-
Find horizontal and Vertical components of zipline, Enter your answer in terms of T, theta_ R for Right theta angle; theta_ L for Left theta angle, v_x, v_y, c, m and g. Modeling the rider as a point...
-
The Lumber Yard has projected the sales below for the next four months. The company collects 43 percent of its sales in the month of sale, 46 percent in the month following the month of sale. 8...
-
The following data pertain to costs at Upside Company: Total fixed costs Total variable costs $330,000 $77,000 Production level The variable cost per unit is OA. $15.00 OB. $18.50 C. $11.50 OD. $3.50...
-
Tesla How effective has the company been in using its assets? How effective has the company been in generating returns to its shareholders? What has been the main driver of the returns to...
-
1.What is FASB and what role do they have with financial statements? 2.What is the purpose of this institution in relation to the accounting profession? 3.What has been their trajectory over the...
-
2. Given a function f such that f(3) = 1 and f(n) (3) = (-1)"n! (2n+1)2n a. Write the first four non-zero terms and the general term of the Taylor series for f about x = 3.
-
What are the strategic advantages of a forward vertical integration strategy. Explain in details.
-
1. Which of the following would be classified as a current liability? a. Mortgage Payable b. Bonds Payable c. Five-year Notes Payable d. Wages Payable
-
What are some of the features of the Unified Process (UP)?
-
Describe the preparation of (a) 1.00 L of 0.150 M KMnO4 from the solid reagent.
-
Why are multidentate ligands preferable to unidentate ligands for complexometric titrations?
-
Describe at least three ways in which a systematic error might occur while using a pipet to transfer a known volume of liquid.
-
Jon Alden is puzzled. His company had a profit margin of 10% in 2002. He feels that this is an indication that the company is doing well. Anna Weis, his accountant, says that more information is...
-
(a) If Nick Flach Company had net income of \($540,000\) in 2001 and it experienced a 24.5% in- crease in net income for 2002, what is its net in- come for 2002? (b) If six cents of every dollar of...
-
Brian Tanaka Company, a retail store, has a receivables turnover ratio of 4.5 times. The industry aver- age is 12.5 times. Does Tanaka have a collection problem with its receivables?
Study smarter with the SolutionInn App