

Problem 1: Choose a publicly traded company from the Australian Securities Exchange (ASX). Provide the following...
Fantastic news! We've Found the answer you've been seeking!
Question:

Transcribed Image Text:
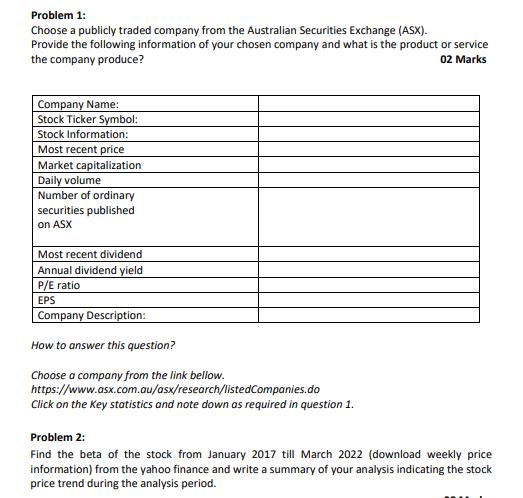
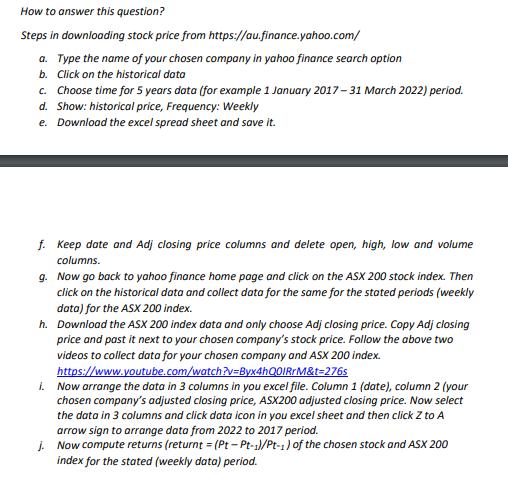
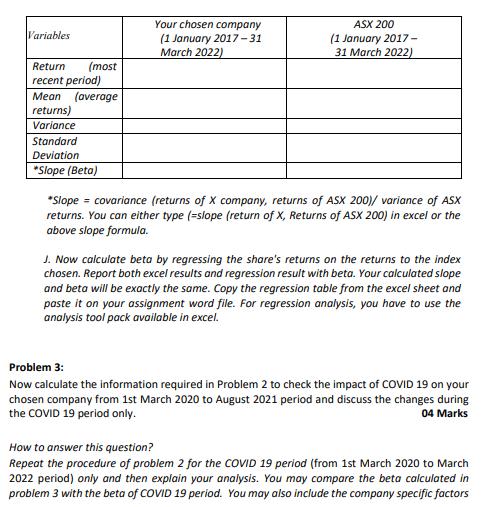
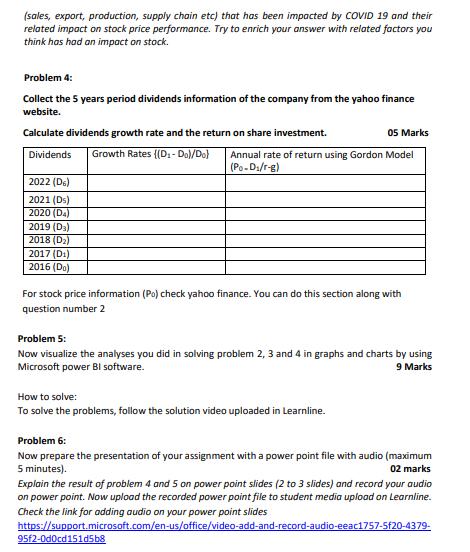
Problem 1: Choose a publicly traded company from the Australian Securities Exchange (ASX). Provide the following information of your chosen company and what is the product or service the company produce? 02 Marks Company Name: Stock Ticker Symbol: Stock Information: Most recent price Market capitalization Daily volume Number of ordinary securities published on ASX Most recent dividend Annual dividend yield P/E ratio EPS Company Description: How to answer this question? Choose a company from the link bellow. https://www.asx.com.au/asx/research/listedCompanies.do Click on the key statistics and note down as required in question 1. Problem 2: Find the beta of the stock from January 2017 till March 2022 (download weekly price information) from the yahoo finance and write a summary of your analysis indicating the stock price trend during the analysis period. How to answer this question? Steps in downloading stock price from https://au.finance.yahoo.com/ a. Type the name of your chosen company in yahoo finance search option b. Click on the historical data c. Choose time for 5 years data (for example 1 January 2017-31 March 2022) period. d. Show: historical price, Frequency: Weekly e. Download the excel spread sheet and save it. f. Keep date and Adj closing price columns and delete open, high, low and volume columns. g. Now go back to yahoo finance home page and click on the ASX 200 stock index. Then click on the historical data and collect data for the same for the stated periods (weekly data) for the ASX 200 index. h. Download the ASX 200 index data and only choose Adj closing price. Copy Adj closing price and past it next to your chosen company's stock price. Follow the above two videos to collect data for your chosen company and ASX 200 index. https://www.youtube.com/watch?v=Byx4hQOIRrM&t=276s i. Now arrange the data in 3 columns in you excel file. Column 1 (date), column 2 (your chosen company's adjusted closing price, ASX200 adjusted closing price. Now select the data in 3 columns and click data icon in you excel sheet and then click Z to A arrow sign to arrange data from 2022 to 2017 period. j. Now compute returns (returnt = (Pt-Pt-1)/Pt-1) of the chosen stock and ASX 200 index for the stated (weekly data) period. Variables Your chosen company (1 January 2017-31 March 2022) ASX 200 (1 January 2017- 31 March 2022) Return (most recent period) Mean (average returns) Variance Standard Deviation *Slope (Beta) *Slope = covariance (returns of X company, returns of ASX 200)/ variance of ASX returns. You can either type (=slope (return of X, Returns of ASX 200) in excel or the above slope formula. J. Now calculate beta by regressing the share's returns on the returns to the index chosen. Report both excel results and regression result with beta. Your calculated slope and beta will be exactly the same. Copy the regression table from the excel sheet and paste it on your assignment word file. For regression analysis, you have to use the analysis tool pack available in excel. Problem 3: Now calculate the information required in Problem 2 to check the impact of COVID 19 on your chosen company from 1st March 2020 to August 2021 period and discuss the changes during the COVID 19 period only. 04 Marks How to answer this question? Repeat the procedure of problem 2 for the COVID 19 period (from 1st March 2020 to March 2022 period) only and then explain your analysis. You may compare the beta calculated in problem 3 with the beta of COVID 19 period. You may also include the company specific factors (sales, export, production, supply chain etc) that has been impacted by COVID 19 and their related impact on stock price performance. Try to enrich your answer with related factors you think has had an impact on stock. Problem 4: Collect the 5 years period dividends information of the company from the yahoo finance website. Calculate dividends growth rate and the return on share investment. 05 Marks Dividends Growth Rates ((D₁-Do)/Do} Annual rate of return using Gordon Model (Po-D₁/r-g) 2022 (DG) 2021 (DS) 2020 (D₂) 2019 (D₂) 2018 (D₂) 2017 (D₁) 2016 (Do) For stock price information (Po) check yahoo finance. You can do this section along with question number 2 Problem 5: Now visualize the analyses you did in solving problem 2, 3 and 4 in graphs and charts by using Microsoft power Bl software. 9 Marks How to solve: To solve the problems, follow the solution video uploaded in Learnline. Problem 6: Now prepare the presentation of your assignment with a power point file with audio (maximum 5 minutes). 02 marks Explain the result of problem 4 and 5 on power point slides (2 to 3 slides) and record your audio on power point. Now upload the recorded power point file to student media upload on Learnline. Check the link for adding audio on your power point slides https://support.microsoft.com/en-us/office/video-add-and-record-audio-eeac1757-5f20-4379- 95f2-0d0cd151d5b8 Strategies for finishing the assignment on time: 1 Choose a company following the selection criteria. Once you have selected a company, declare the company name in the FIN 510/FIN 205 forum with your student ID (in the forum write student ID and name of your selected company) so that other students do not select the same company. Before choosing a company check the FIN 510/ FIN 205 assignment forum whether your chosen company has been selected by others. 2. Read about the company from ASX and company's website. 3. Complete assignment questions step by step and check if you are in right direction according the requirements of the questions. Make sure you practice excel while doing this assignment. 4. Finalize word file (12 font, calibri (body), line spacing single). 5. Finalize excel file with regression results. Upload both the excel file and the assignment file via assignment submission point. (Please keep a copy of yours excel sheet as a future reference. I might ask you to send me a copy of yours excel file). 6. Proof-read your assignment prior to the submission. 7. Submit the assignment prior to the submission deadline. Make sure you have submitted the assignment on time, as there will be penalty for late submission. & Attend or listen to the recorded session on how to prepare your assignment. Problem 1: Choose a publicly traded company from the Australian Securities Exchange (ASX). Provide the following information of your chosen company and what is the product or service the company produce? 02 Marks Company Name: Stock Ticker Symbol: Stock Information: Most recent price Market capitalization Daily volume Number of ordinary securities published on ASX Most recent dividend Annual dividend yield P/E ratio EPS Company Description: How to answer this question? Choose a company from the link bellow. https://www.asx.com.au/asx/research/listedCompanies.do Click on the key statistics and note down as required in question 1. Problem 2: Find the beta of the stock from January 2017 till March 2022 (download weekly price information) from the yahoo finance and write a summary of your analysis indicating the stock price trend during the analysis period. How to answer this question? Steps in downloading stock price from https://au.finance.yahoo.com/ a. Type the name of your chosen company in yahoo finance search option b. Click on the historical data c. Choose time for 5 years data (for example 1 January 2017-31 March 2022) period. d. Show: historical price, Frequency: Weekly e. Download the excel spread sheet and save it. f. Keep date and Adj closing price columns and delete open, high, low and volume columns. g. Now go back to yahoo finance home page and click on the ASX 200 stock index. Then click on the historical data and collect data for the same for the stated periods (weekly data) for the ASX 200 index. h. Download the ASX 200 index data and only choose Adj closing price. Copy Adj closing price and past it next to your chosen company's stock price. Follow the above two videos to collect data for your chosen company and ASX 200 index. https://www.youtube.com/watch?v=Byx4hQOIRrM&t=276s i. Now arrange the data in 3 columns in you excel file. Column 1 (date), column 2 (your chosen company's adjusted closing price, ASX200 adjusted closing price. Now select the data in 3 columns and click data icon in you excel sheet and then click Z to A arrow sign to arrange data from 2022 to 2017 period. j. Now compute returns (returnt = (Pt-Pt-1)/Pt-1) of the chosen stock and ASX 200 index for the stated (weekly data) period. Variables Your chosen company (1 January 2017-31 March 2022) ASX 200 (1 January 2017- 31 March 2022) Return (most recent period) Mean (average returns) Variance Standard Deviation *Slope (Beta) *Slope = covariance (returns of X company, returns of ASX 200)/ variance of ASX returns. You can either type (=slope (return of X, Returns of ASX 200) in excel or the above slope formula. J. Now calculate beta by regressing the share's returns on the returns to the index chosen. Report both excel results and regression result with beta. Your calculated slope and beta will be exactly the same. Copy the regression table from the excel sheet and paste it on your assignment word file. For regression analysis, you have to use the analysis tool pack available in excel. Problem 3: Now calculate the information required in Problem 2 to check the impact of COVID 19 on your chosen company from 1st March 2020 to August 2021 period and discuss the changes during the COVID 19 period only. 04 Marks How to answer this question? Repeat the procedure of problem 2 for the COVID 19 period (from 1st March 2020 to March 2022 period) only and then explain your analysis. You may compare the beta calculated in problem 3 with the beta of COVID 19 period. You may also include the company specific factors (sales, export, production, supply chain etc) that has been impacted by COVID 19 and their related impact on stock price performance. Try to enrich your answer with related factors you think has had an impact on stock. Problem 4: Collect the 5 years period dividends information of the company from the yahoo finance website. Calculate dividends growth rate and the return on share investment. 05 Marks Dividends Growth Rates ((D₁-Do)/Do} Annual rate of return using Gordon Model (Po-D₁/r-g) 2022 (DG) 2021 (DS) 2020 (D₂) 2019 (D₂) 2018 (D₂) 2017 (D₁) 2016 (Do) For stock price information (Po) check yahoo finance. You can do this section along with question number 2 Problem 5: Now visualize the analyses you did in solving problem 2, 3 and 4 in graphs and charts by using Microsoft power Bl software. 9 Marks How to solve: To solve the problems, follow the solution video uploaded in Learnline. Problem 6: Now prepare the presentation of your assignment with a power point file with audio (maximum 5 minutes). 02 marks Explain the result of problem 4 and 5 on power point slides (2 to 3 slides) and record your audio on power point. Now upload the recorded power point file to student media upload on Learnline. Check the link for adding audio on your power point slides https://support.microsoft.com/en-us/office/video-add-and-record-audio-eeac1757-5f20-4379- 95f2-0d0cd151d5b8 Strategies for finishing the assignment on time: 1 Choose a company following the selection criteria. Once you have selected a company, declare the company name in the FIN 510/FIN 205 forum with your student ID (in the forum write student ID and name of your selected company) so that other students do not select the same company. Before choosing a company check the FIN 510/ FIN 205 assignment forum whether your chosen company has been selected by others. 2. Read about the company from ASX and company's website. 3. Complete assignment questions step by step and check if you are in right direction according the requirements of the questions. Make sure you practice excel while doing this assignment. 4. Finalize word file (12 font, calibri (body), line spacing single). 5. Finalize excel file with regression results. Upload both the excel file and the assignment file via assignment submission point. (Please keep a copy of yours excel sheet as a future reference. I might ask you to send me a copy of yours excel file). 6. Proof-read your assignment prior to the submission. 7. Submit the assignment prior to the submission deadline. Make sure you have submitted the assignment on time, as there will be penalty for late submission. & Attend or listen to the recorded session on how to prepare your assignment.
Expert Answer:
Answer rating: 100% (QA)
Problem 1 Company Profile I chose to work on Abacus Property Group for this assignment ABP incorporated in 1996 deals in investment activities in selfstorage industrial properties retail and office It ... View the full answer

Related Book For 
Business Analytics and Statistics
ISBN: 978-0730363330
1st edition
Authors: Ken Black, John Asafu Adjaye, Paul Burke, Nelson Perera, Carl Sherwood, Saleh A. Wasimi
Posted Date:
Students also viewed these economics questions
-
What is a product or service value proposition? How does it affect customer purchase decisions?
-
1.How does the primary processing of mRNA differ between bacteria and eukaryotes? 2.What are the main post-transcriptional modifications in eukaryotic mRNA and state their functions 3.Discuss the...
-
Choose a publicly traded company and calculate its cash flow ratios. Demonstrate your calculations in your post, and explain what the cash flow ratios indicate about the company.
-
Evaluate the limit or state that it does not exist. lim (x,y) (1,-3) In(3x + y)
-
Fores Construction Company reported a pretax operating loss of $135 million for financial reporting purposes in 2011. Contributing to the loss were (a) A penalty of $5 million assessed by the...
-
Suppose that (2f is identically zero in a region S. Show that? as = || IV/P |Vfl dV f Df dS as
-
Review each of the following items, a through \(f\), and determine whether the item supports a (1) production view of quality or a (2) customer view of quality. a. Applying management-by-exception...
-
Duo Company reports the following information for the current year, which is its first year of operations. Direct materials . . . . . . . . . . . . . . . . . . . . . . . . $15 per unit Direct labor ....
-
1. Ratio analysis - Who am I? A Financial Ratio Analysis of Global Products Inc. Who Does It and Why Do They Care? A variety of interested parties-including existing and prospective creditors (such...
-
An entrepreneur owns six corporations, each with more than $10 million in assets. The entrepreneur consults the U.S. Internal Revenue Data Book and discovers that the IRS audits 15.3% of businesses...
-
Question 28 of 40 View Policies < > R -/2.5 ! Current Attempt in Progress Ivanhoe Company sells product 1976NLC for $30.00 per unit. The cost of one unit of 1976NLC is $27, and the replacement cost...
-
Find the first three terms of the sequence, Classify the sequence as arithmetic (give d value ), geometric (give r value), both, or neither..... Sn = 10n
-
In each case, sketch the set of points determined by the given conditions: (c) Im (z-i) = 2; (a) |2z+4-3i| 4; (b) |z+ 3i|+|z3i| = 10;
-
Wireless Tools, Inc., Inc is a calendar year, accrual basis corporation (book and tax). The company has total assets of $5,000,125. The company reported $390,000 in net income after federal income...
-
Rustafson Corporation is a diversified manufacturer of consumer goods. The company's act the following seven activity cost pools: Activity Cost Pool Labor-related Estimated Overhead Cost $ 17,200...
-
Prove that if f [a, b] (a,b) - R is a differentiable function on (the interior of) its domain, then f': R satisfies the intermediate value theorem: for any c
-
1. Conduct a hypothesis test showing all of your steps. Give two reasons for your decision based on: 1) if the test statistic falls in the critical rejection region 2) if the P-value is sa The claim:...
-
Tarick Toys Company manufactures video game consoles and accounts for product costs using process costing. The following information is available regarding its June inventories. The following...
-
A study reveals that the average amount withdrawn at automatic teller machines (ATMs) is $160 per withdrawal. This figure was determined using a random sample of 91 withdrawals at ATMs. The sample...
-
The table summarises the unit sales and prices for a food manufacturer from 2017 to 2020. Using 2017 as the base year, construct an unweighted price index, a Laspeyres index and a Paasche index....
-
A hire car company is interested in summary statistics that are useful in describing travel times between the CBD and the domestic terminal at Sydney Airport. The company locates a report that...
-
How has the London Stock Exchange kept its position as one of the leading markets?
-
What is Mifid and what were its aims?
-
What are multilateral trading platforms?

Study smarter with the SolutionInn App