Problem 1: Use R to write a for-loop that prints the following output: 1 3 5 7
Question:
Problem 1: Use R to write a for-loop that prints the following output:
1
3
5
7
9
11
Write a while loop that prints the same output as the for-loop for Problem 1.
Write an if-statement nested inside your for-loop from Problem 1 that prints "three" instead of the output "3", so that the output becomes:
1
“three”
5
7
9
11
Write a function called summarystat, which returns the mean, median, and standard deviation for both of these vectors, with labels. For example, using this function on the Tail_wags vector should have similar output to:
> summarystat(Tail_wags)
[1] "Mean" = 8.7273"
[2] "Median = 12"
[3] "Standard Deviation = 6.4976"
Run the function on both the Tail_wags and Dog_biscuits vectors. Try to enhance the output if you can, making it easier to read. (Example: round the calculations to a few decimal places, etc.)
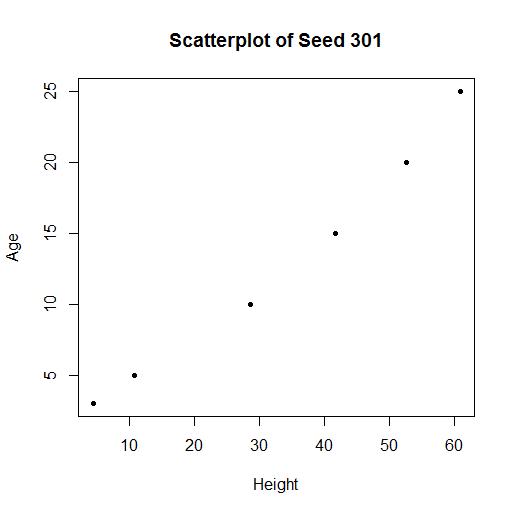
Use the Loblolly dataset to write a function that creates a scatterplot of height and age based on a specified seed number.
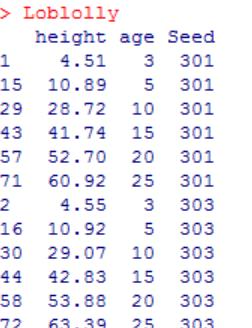
An example of what the output should look like is below:
Expert Answer: