

Question: Problem 3 3,500 - - - 0 Australia a Canada 3.000 moJapan 0 UK 0 US 2,500 2.000 1,500 1,000 Year The figure shows the

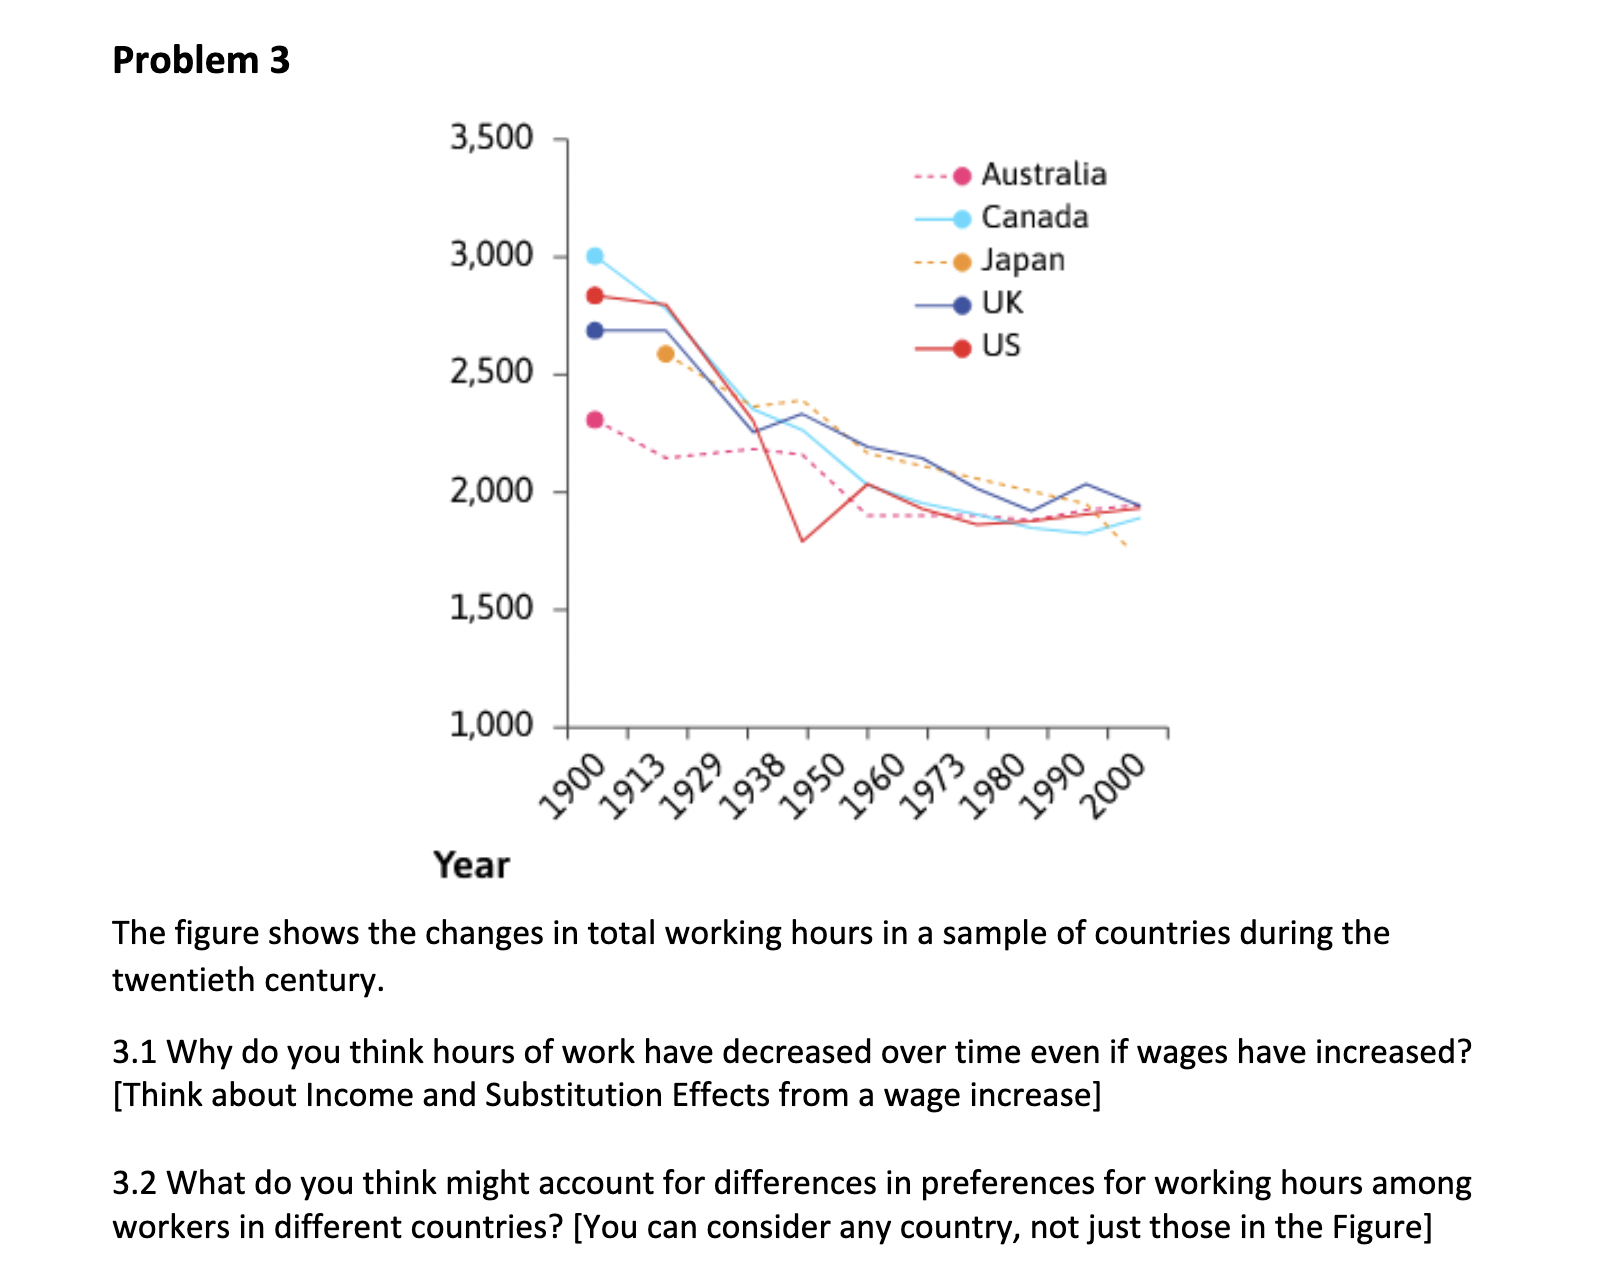
Problem 3 3,500 - - - 0 Australia a Canada 3.000 moJapan 0 UK 0 US 2,500 2.000 1,500 1,000 Year The figure shows the changes in total working hours in a sample of countries during the twentieth century. 3.1 Why do you think hours of work have decreased over time even if wages have increased? [Think about Income and Substitution Effects from a wage increase] 3.2 What do you think might account for differences in preferences for working hours among workers in different countries? [You can consider any country, not just those in the Figure]
Step by Step Solution
There are 3 Steps involved in it
1 Expert Approved Answer
Step: 1 Unlock

Question Has Been Solved by an Expert!
Get step-by-step solutions from verified subject matter experts
Step: 2 Unlock
Step: 3 Unlock