

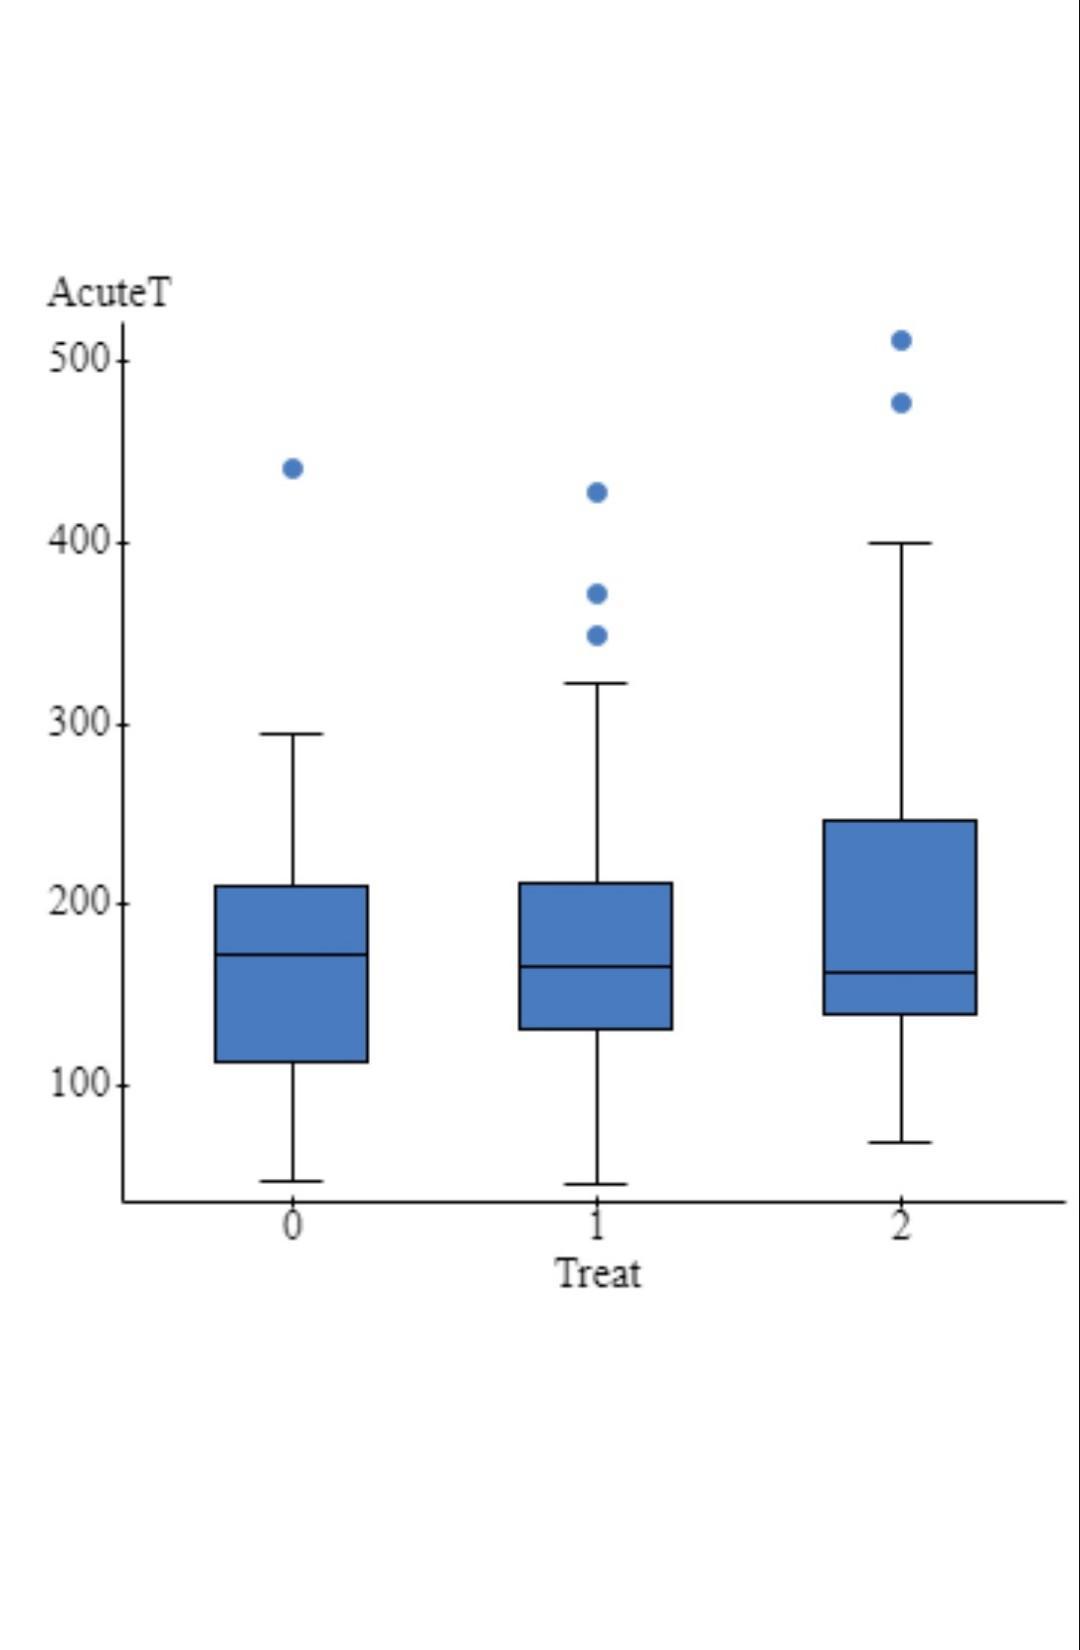
Prompt We will analyze the data to answer the second research question: Which of the drugs...
Fantastic news! We've Found the answer you've been seeking!
Question:
Transcribed Image Text:
Prompt We will analyze the data to answer the second research question: Which of the drugs (if either) delayed the recurrence of depression longer relative to the placebo? In the previous lab-preparation activity, we identified Treat as the explanatory variable and Time as the response variable. We also determined that we will analyze the data using side-by-side boxplots and descriptive statistics (i.e. 5-number summaries since. the graphs are boxplots). 1. Make graphs and tables. a. Use StatCrunch to produce side-by-side boxplots. (directions) Embed your graphs with your initial post. b. Use StatCrunch to produce the descriptive statistics (a table containing the 5-number summaries for each comparison group). (directions) Copy and paste the StatCrunch output table into your initial post. 2. Analyze the data: Compare the distributions for the treatment groups as demonstrated in Unit 2. For example, compare medians and intervals of typical values. Describe the shape and any outliers. Be sure to write your comparisons so the reader can understand the context of the numbers. For example, don't just say the median is 30; instead, say something like this: on average patients taking the placebo relapsed in 30 days (Q2-30 days). 2. Analyze the data: Compare the distributions for the treatment groups as demonstrated in Unit 2. For example, compare medians and intervals of typical values. Describe the shape and any outliers. Be sure to write your comparisons so the reader can understand the context of the numbers. For example, don't just say the median is 30; instead, say something like this: on average patients taking the placebo relapsed in 30 days (Q2-30 days). 3. Draw a conclusion: What can we conclude from your analysis? Did one drug successfully delay a relapse of depression better than the others? What evidence supports your conclusion? 4. Summarize your conclusions in response to both research questions: In this lab you compared three treatments (two drugs and the placebo) using two different variables. In Part 1 you compared whether or not a relapse into depression occurred for each of the two drugs and the placebo. In Part 2 you compared the length of time until the next relapse for the two drugs and the placebo. What can you conclude in light of both analyses? Is one treatment better than the other? How does the data support your conclusion? List of StatCrunch Directions Each link will open in a new window. To return to this discussion, either close the new tab or select the tab for this discussion. AcuteT 5001 400- 300 200- 100 Treat Prompt We will analyze the data to answer the second research question: Which of the drugs (if either) delayed the recurrence of depression longer relative to the placebo? In the previous lab-preparation activity, we identified Treat as the explanatory variable and Time as the response variable. We also determined that we will analyze the data using side-by-side boxplots and descriptive statistics (i.e. 5-number summaries since. the graphs are boxplots). 1. Make graphs and tables. a. Use StatCrunch to produce side-by-side boxplots. (directions) Embed your graphs with your initial post. b. Use StatCrunch to produce the descriptive statistics (a table containing the 5-number summaries for each comparison group). (directions) Copy and paste the StatCrunch output table into your initial post. 2. Analyze the data: Compare the distributions for the treatment groups as demonstrated in Unit 2. For example, compare medians and intervals of typical values. Describe the shape and any outliers. Be sure to write your comparisons so the reader can understand the context of the numbers. For example, don't just say the median is 30; instead, say something like this: on average patients taking the placebo relapsed in 30 days (Q2-30 days). 2. Analyze the data: Compare the distributions for the treatment groups as demonstrated in Unit 2. For example, compare medians and intervals of typical values. Describe the shape and any outliers. Be sure to write your comparisons so the reader can understand the context of the numbers. For example, don't just say the median is 30; instead, say something like this: on average patients taking the placebo relapsed in 30 days (Q2-30 days). 3. Draw a conclusion: What can we conclude from your analysis? Did one drug successfully delay a relapse of depression better than the others? What evidence supports your conclusion? 4. Summarize your conclusions in response to both research questions: In this lab you compared three treatments (two drugs and the placebo) using two different variables. In Part 1 you compared whether or not a relapse into depression occurred for each of the two drugs and the placebo. In Part 2 you compared the length of time until the next relapse for the two drugs and the placebo. What can you conclude in light of both analyses? Is one treatment better than the other? How does the data support your conclusion? List of StatCrunch Directions Each link will open in a new window. To return to this discussion, either close the new tab or select the tab for this discussion. AcuteT 5001 400- 300 200- 100 Treat
Expert Answer:
Answer rating: 100% (QA)
Sidebyside boxplots A sidebyside boxplot visually compares the distribution of a quantitative variable across different categories This visual representation allows to compare the distributions of the ... View the full answer

Posted Date:
Students also viewed these accounting questions
-
Using Python, In this assignment, we will analyze the HURDAT2 dataset for Atlantic hurricane data from 1851 through 2017. This dataset is provided by the National Hurricane Center and is documented...
-
Using Python, In this assignment, we will analyze the HURDAT2 dataset for Atlantic hurricane data from 1851 through 2017. This dataset is provided by the National Hurricane Center and is documented...
-
In this discussion, we will analyze the case of Starting Right, a hypothetical company created by Julia Day after quitting a successful corporate career to start a high-quality baby food company....
-
The P04_18.xlsx file contains a single-table Data Model on a companys sales and a single blank worksheet. The goal is to create a pivot table that shows the ratio of average revenue per transaction...
-
In Appendix D, what is the probability that a male will have an ADDSC score greater than 50?
-
The unit cost of normal spoilage is the same as the unit cost of abnormal spoilage. Do you agree? Explain.
-
We will use the Minitab macro NormNP, or the R function normnp, to nd the posterior distribution of the normal mean when we have a random sample of size n from a normal( , 2 ) distribution with...
-
Discuss the advantages and disadvantages of using divisional profit as the basis of incentive compensation for division managers compared to using company profit as the basis.
-
15. 16. What is the final product (major) 'A' in the given reaction? CH3 OH CH CH3 HCI + 'A' (major product) CH3 CH3 Cl CH (B) CH3 CH2-CH3 (A) CH3 CH (C) shiks CH=CH2 (D) Which of the following...
-
Subpump Limited is an active business corporation owned 100% by George Simpson, who has been attempting to sell the company for several years and have recently received an offer from a serious buyer....
-
You are currently bearish on Naspers (JSE: NPN) believing that it is overvalued while you hold Prosus (JSE: PRX) in your portfolio. Since Naspers and Prosus are highly correlated, you would like to...
-
Environ Ltd requests you to evaluate two new capital budgeting proposals and provide your recommendations. You are required to submit a report by responding to the underlisted questions. In your...
-
Among the following, who would impair their firm's independence by owning a single share of stock in an audit client? Group of answer choices a newly hired auditor in the office performing the...
-
/+1 +/ 1+2+/ 1+ 3+1 1+ 4 +1 15 +/ 1+ 6 +/ } 1+7 +1 double inverse (int x) { // This method returns 1 divided by the value passed into it. double result; result 1.0/ x; return result; public static...
-
If 4(1) is a strictly positive supermartingale, then zero-coupon bond prices can be modelled using the formula Bt.T)- Ep(4(T)F), where P is a suitably-chosen A(1) probability measure. (i) (a) Express...
-
*Harry Consulting is a consulting firm owned and operated by Harry Smith. The end-of-period spreadsheet shown below was prepared for the year ended July 31, 2015: Unadjusted Trial Balance Account...
-
For this lab, we are evolving our Banking System of Lab4 so we can make it more robust and a bit richer in its services. The purpose is to apply further the concepts of inheritance, composition,...
-
TRUE-FALSE QUESTIONS 1. In terms of preliminary analytical procedures, assume that the company has introduced a new product with a low price point and significant customer demand. The auditor would...
-
Nestls financial statements are presented in Appendix B. Financial statements of Delfi Limited are presented in Appendix C. Instructions Refer to the financial statements and answer the following...
-
Writing Financial statement information about four different companies is as follows. Instructions a. Determine the missing amounts. (Hint: For example, to solve for (a), Assets Liabilities = Equity...
-
The financial statements of TSMC are presented in Appendix A. The complete annual report, including the notes to the financial statements, is available at the companys website. Instructions Refer to...

Study smarter with the SolutionInn App