Answered step by step
Verified Expert Solution
Question
1 Approved Answer
Q1: Normalize your transfer function (gain) data using the analytical equation for the gain of a low-pass filter such that the quantity plotted on

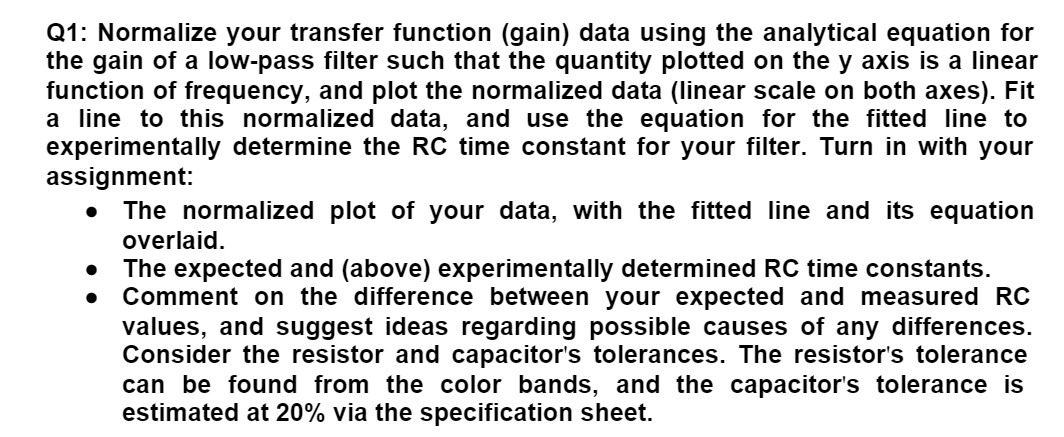
Q1: Normalize your transfer function (gain) data using the analytical equation for the gain of a low-pass filter such that the quantity plotted on the y axis is a linear function of frequency, and plot the normalized data (linear scale on both axes). Fit a line to this normalized data, and use the equation for the fitted line to experimentally determine the RC time constant for your filter. Turn in with your assignment: The normalized plot of your data, with the fitted line and its equation overlaid. The expected and (above) experimentally determined RC time constants. Comment on the difference between your expected and measured RC values, and suggest ideas regarding possible causes of any differences. Consider the resistor and capacitor's tolerances. The resistor's tolerance can be found from the color bands, and the capacitor's tolerance is estimated at 20% via the specification sheet.
Step by Step Solution
There are 3 Steps involved in it
Step: 1
To normalize the transfer function gain data and plot it on a linear scale you need the original gain values and corresponding frequencies Once you ha...
Get Instant Access to Expert-Tailored Solutions
See step-by-step solutions with expert insights and AI powered tools for academic success
Step: 2

Step: 3

Ace Your Homework with AI
Get the answers you need in no time with our AI-driven, step-by-step assistance
Get Started


