

Q2 - Financial Statement Analysis (50 min) Calculate at least 4 ratios for EACH of the...
Fantastic news! We've Found the answer you've been seeking!
Question:
Transcribed Image Text:
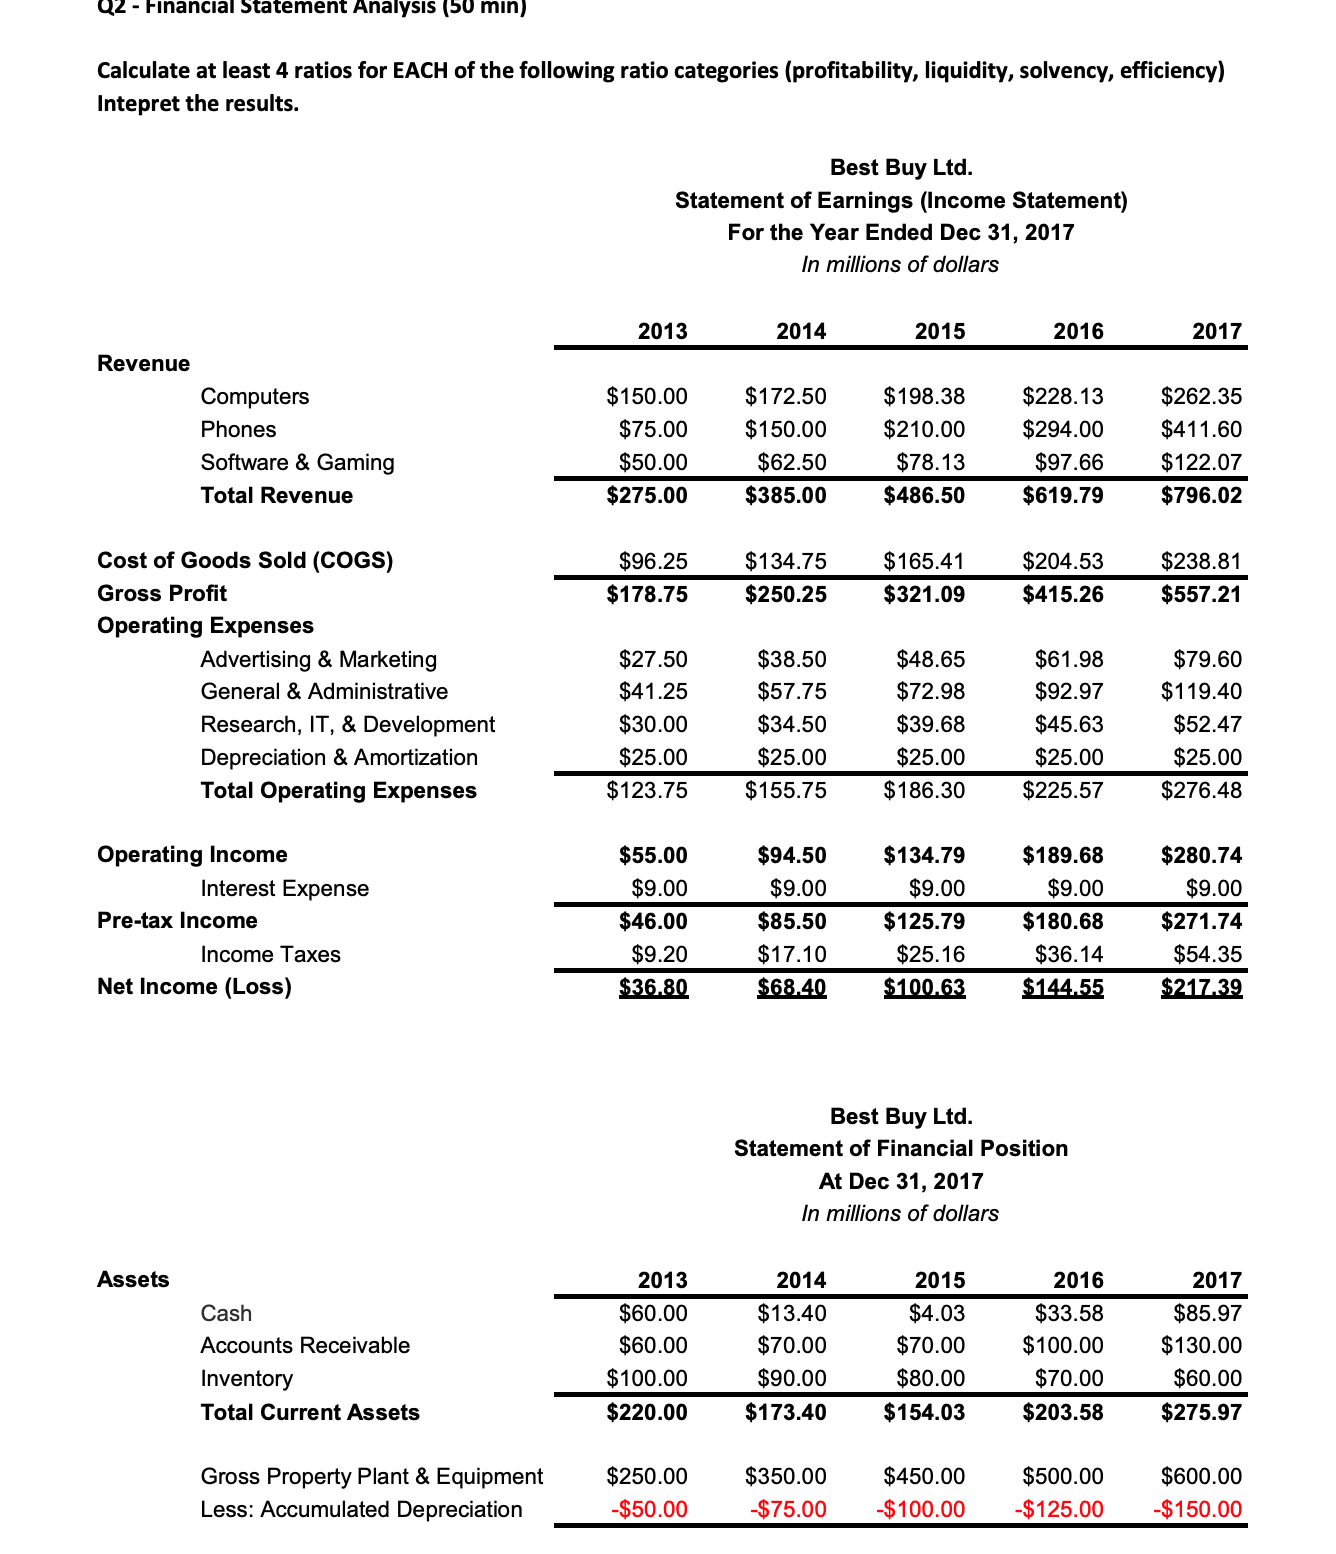
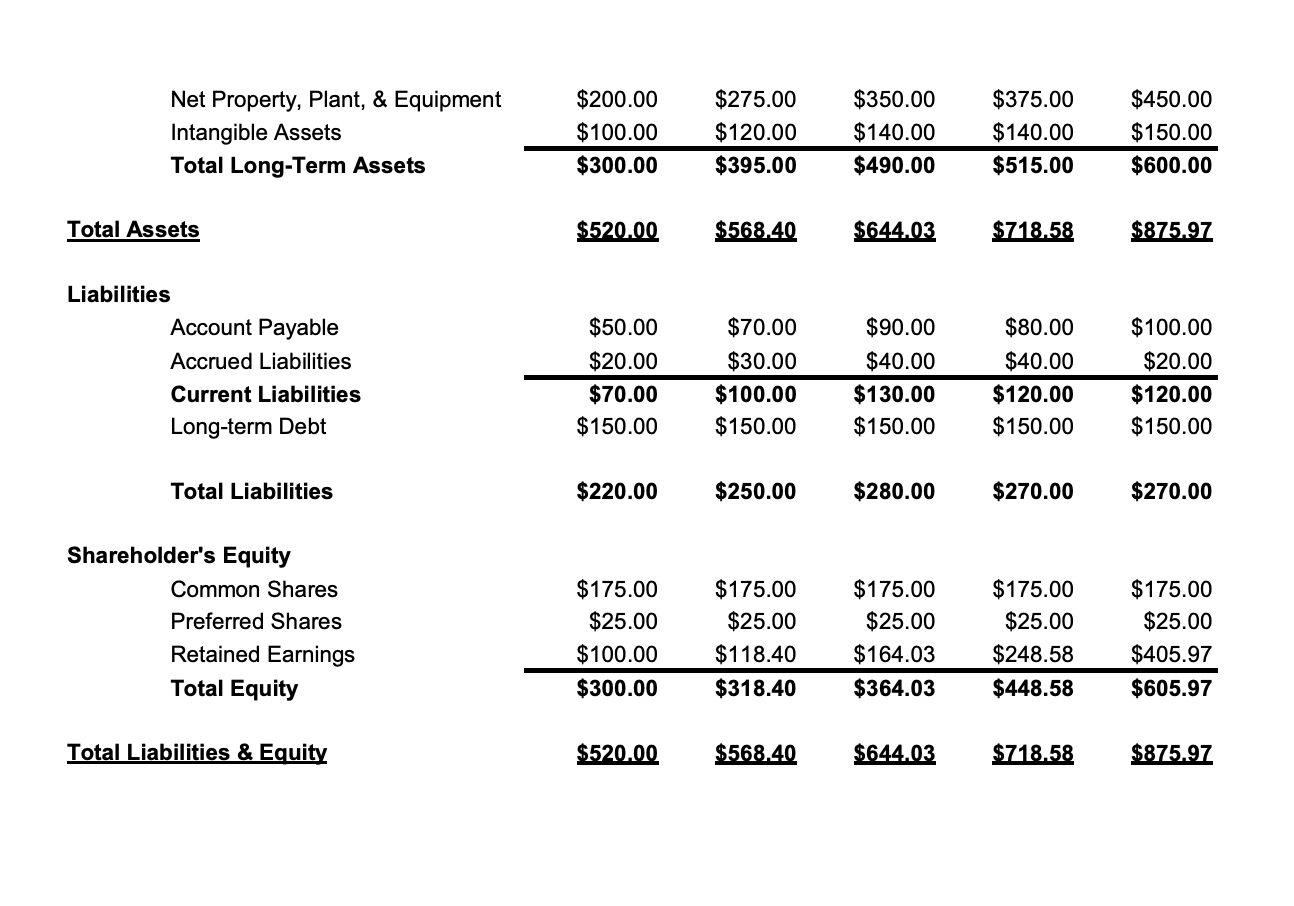
Q2 - Financial Statement Analysis (50 min) Calculate at least 4 ratios for EACH of the following ratio categories (profitability, liquidity, solvency, efficiency) Intepret the results. Best Buy Ltd. Statement of Earnings (Income Statement) For the Year Ended Dec 31, 2017 In millions of dollars 2013 2014 2015 2016 2017 Revenue Computers $150.00 $172.50 $198.38 $228.13 $262.35 Phones $75.00 $150.00 $210.00 $294.00 $411.60 Software & Gaming $50.00 $62.50 $78.13 $97.66 $122.07 Total Revenue $275.00 $385.00 $486.50 $619.79 $796.02 Cost of Goods Sold (COGS) $96.25 $134.75 $165.41 $204.53 $238.81 Gross Profit $178.75 $250.25 $321.09 $415.26 $557.21 Operating Expenses Advertising & Marketing $27.50 $38.50 $48.65 $61.98 $79.60 General & Administrative $41.25 $57.75 $72.98 $92.97 $119.40 Research, IT, & Development $30.00 $34.50 $39.68 $45.63 $52.47 Depreciation & Amortization $25.00 $25.00 $25.00 $25.00 $25.00 Total Operating Expenses $123.75 $155.75 $186.30 $225.57 $276.48 Operating Income $55.00 $94.50 $134.79 $189.68 $280.74 Interest Expense $9.00 $9.00 $9.00 $9.00 $9.00 Pre-tax Income $46.00 $85.50 $125.79 $180.68 $271.74 Income Taxes $9.20 $17.10 $25.16 $36.14 $54.35 Net Income (Loss) $36.80 $68.40 $100.63 $144.55 $217.39 Best Buy Ltd. Statement of Financial Position At Dec 31, 2017 In millions of dollars Assets Cash Accounts Receivable Inventory Total Current Assets 2013 2014 2015 2016 2017 $60.00 $13.40 $4.03 $33.58 $85.97 $60.00 $70.00 $70.00 $100.00 $130.00 $100.00 $90.00 $80.00 $70.00 $60.00 $220.00 $173.40 $154.03 $203.58 $275.97 Gross Property Plant & Equipment $250.00 $350.00 $450.00 $500.00 $600.00 Less: Accumulated Depreciation -$50.00 -$75.00 -$100.00 -$125.00 -$150.00 Net Property, Plant, & Equipment $200.00 $275.00 $350.00 $375.00 $450.00 Intangible Assets $100.00 $120.00 $140.00 $140.00 $150.00 Total Long-Term Assets $300.00 $395.00 $490.00 $515.00 $600.00 Total Assets $520.00 $568.40 $644.03 $718.58 $875.97 Liabilities Account Payable $50.00 $70.00 $90.00 $80.00 $100.00 Accrued Liabilities $20.00 $30.00 $40.00 $40.00 $20.00 Current Liabilities $70.00 $100.00 $130.00 $120.00 $120.00 Long-term Debt $150.00 $150.00 $150.00 $150.00 $150.00 Total Liabilities $220.00 $250.00 $280.00 $270.00 $270.00 Shareholder's Equity Common Shares $175.00 $175.00 $175.00 $175.00 $175.00 Preferred Shares $25.00 $25.00 $25.00 $25.00 $25.00 Retained Earnings $100.00 $118.40 $164.03 $248.58 $405.97 Total Equity $300.00 $318.40 $364.03 $448.58 $605.97 Total Liabilities & Equity $520.00 $568.40 $644.03 $718.58 $875.97 Q2 - Financial Statement Analysis (50 min) Calculate at least 4 ratios for EACH of the following ratio categories (profitability, liquidity, solvency, efficiency) Intepret the results. Best Buy Ltd. Statement of Earnings (Income Statement) For the Year Ended Dec 31, 2017 In millions of dollars 2013 2014 2015 2016 2017 Revenue Computers $150.00 $172.50 $198.38 $228.13 $262.35 Phones $75.00 $150.00 $210.00 $294.00 $411.60 Software & Gaming $50.00 $62.50 $78.13 $97.66 $122.07 Total Revenue $275.00 $385.00 $486.50 $619.79 $796.02 Cost of Goods Sold (COGS) $96.25 $134.75 $165.41 $204.53 $238.81 Gross Profit $178.75 $250.25 $321.09 $415.26 $557.21 Operating Expenses Advertising & Marketing $27.50 $38.50 $48.65 $61.98 $79.60 General & Administrative $41.25 $57.75 $72.98 $92.97 $119.40 Research, IT, & Development $30.00 $34.50 $39.68 $45.63 $52.47 Depreciation & Amortization $25.00 $25.00 $25.00 $25.00 $25.00 Total Operating Expenses $123.75 $155.75 $186.30 $225.57 $276.48 Operating Income $55.00 $94.50 $134.79 $189.68 $280.74 Interest Expense $9.00 $9.00 $9.00 $9.00 $9.00 Pre-tax Income $46.00 $85.50 $125.79 $180.68 $271.74 Income Taxes $9.20 $17.10 $25.16 $36.14 $54.35 Net Income (Loss) $36.80 $68.40 $100.63 $144.55 $217.39 Best Buy Ltd. Statement of Financial Position At Dec 31, 2017 In millions of dollars Assets Cash Accounts Receivable Inventory Total Current Assets 2013 2014 2015 2016 2017 $60.00 $13.40 $4.03 $33.58 $85.97 $60.00 $70.00 $70.00 $100.00 $130.00 $100.00 $90.00 $80.00 $70.00 $60.00 $220.00 $173.40 $154.03 $203.58 $275.97 Gross Property Plant & Equipment $250.00 $350.00 $450.00 $500.00 $600.00 Less: Accumulated Depreciation -$50.00 -$75.00 -$100.00 -$125.00 -$150.00 Net Property, Plant, & Equipment $200.00 $275.00 $350.00 $375.00 $450.00 Intangible Assets $100.00 $120.00 $140.00 $140.00 $150.00 Total Long-Term Assets $300.00 $395.00 $490.00 $515.00 $600.00 Total Assets $520.00 $568.40 $644.03 $718.58 $875.97 Liabilities Account Payable $50.00 $70.00 $90.00 $80.00 $100.00 Accrued Liabilities $20.00 $30.00 $40.00 $40.00 $20.00 Current Liabilities $70.00 $100.00 $130.00 $120.00 $120.00 Long-term Debt $150.00 $150.00 $150.00 $150.00 $150.00 Total Liabilities $220.00 $250.00 $280.00 $270.00 $270.00 Shareholder's Equity Common Shares $175.00 $175.00 $175.00 $175.00 $175.00 Preferred Shares $25.00 $25.00 $25.00 $25.00 $25.00 Retained Earnings $100.00 $118.40 $164.03 $248.58 $405.97 Total Equity $300.00 $318.40 $364.03 $448.58 $605.97 Total Liabilities & Equity $520.00 $568.40 $644.03 $718.58 $875.97
Expert Answer:

Related Book For 
Introductory Financial Accounting for Business
ISBN: 978-1260299441
1st edition
Authors: Thomas Edmonds, Christopher Edmonds
Posted Date:
Students also viewed these finance questions
-
Using your financial calculator, calculate the value of the following bonds: The value of the bond with a required rate of return of 5% is $1000. (Round to the nearest cent.) The value of the bond...
-
Question: Old MathJax webview Old MathJax webview i need ans of these question but the source is alot Old MathJax webviewOld MathJax webview i need ans of these question but the source is alot these...
-
"I'm not sure we should lay out $300,000 for that automated welding machine," said Jim Alder, president of the Superior Equipment Company. "That's a lot of money, and it would cost us $84,000 for...
-
Timco is considering the construction of a new retail outlet. The construction cost will be 400000. Net working capital will increase by 10000. The depreciation is 10 year MACRS. The new location...
-
Refer to Figure 2 on page 691 of Original Source 11, linked to the companion website, Driving impairment due to sleepiness is exacerbated by low alcohol intake. a. What type of picture is in the...
-
1. Compute earnings per share (EPS) for 2018 for Accel's. Round to the nearest cent. 2. Compute Accel's Companies' price/earnings ratio for 2018. The market price per share of Accel's stock is...
-
Cross Rates and Intermarket Arbitrage. Why are cross currency rates of special interest when discussing intermarket arbitrage?
-
The data from exercise 2 follow. a. Estimate the standard deviation of y* when x = 8. b. Develop a 95% confidence interval for the expected value of y when x = 8. c. Estimate the standard deviation...
-
For a recent year, McDugal's company-owned restaurants had the following sales and expenses (in millions): Sales $39,400 Food and packaging $13,992 Payroll 10,400 Occupancy (rent, depreciation, etc.)...
-
Internal Rate of Return A project is estimated to cost $217,350 and provide annual net cash flows of $35,000 for eight years. Present Value of an Annulty of $1 at Compound Interest Year 6% 10% 12%...
-
According to anthropologist Edward T . Hall, which social interaction zone describes communication that usually occurs at approximately 1 . 5 to 4 feet? Explain
-
Summers corporation recently used $75,000 of direct materials and $9,000 of indirect materials in production activities. What would be the journal entries reflecting these transactions?
-
It is January 1 of Year 2 . Company sales for January, February, and March are forecasted as follows: January: $ 2 0 , 0 0 0 February: $ 4 0 , 0 0 0 March: $ 5 0 , 0 0 0 Seventy percent of sales are...
-
Eight years ago, Raj Hapi launched Hapi's Petting Zoo & Caf (Hapi's). Hapi's is a not-for-profit zoo located in the Annapolis Valley in Nova Scotia. It is a place where people can interact with...
-
Let f ( x ) = 3 x ^ 2 and g ( x ) = x ^ 2 + 2 . Find the area of the region enclosed by f ( x ) and g ( x
-
Question 15 (1 point) Sadiah ____ believe that she was selected as employee of the year. Question 15 options: a) could hardly b) couldn't hardly c) could not hardly Question 16 (1 point) Your...
-
Selected condensed data taken from a recent statement of financial position of Morino Ltd. are as follows. MORINO LTD. Statement of Financial Position (partial) Other current assets...
-
Construct a combined common-size and common-base year balance sheet for 2007. What will be the common-base year value for the 2007 net fixed assets? a. 0.89 b. 0.92 c. 1.12 d. 1.32 AHS INC. 2007...
-
What will be the value of AHS' equity multiplier during 2007? a. 0.44 b. 0.56 c. 1.78 d. 1.82 AHS INC. 2007 Income Statement (S in millions) Net sales S 9625 Cost of goods sold 5225 Depreciation 1890...
-
What will be the value of AHS' current ratio during 2007? a. 1.14 b. 1.42 c. 1.49 d. 1.53 AHS INC. 2007 Income Statement (S in millions) Net sales S 9625 Cost of goods sold 5225 Depreciation 1890...

Study smarter with the SolutionInn App