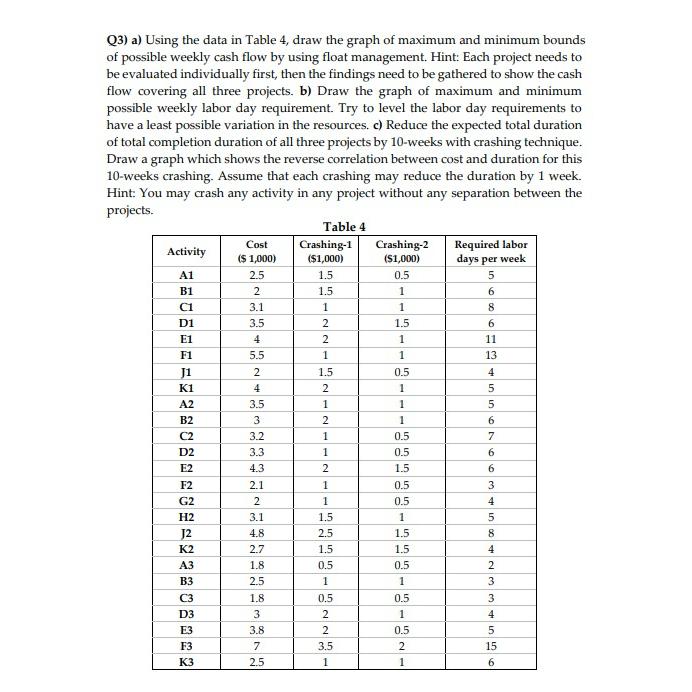
Q3) a) Using the data in Table 4, draw the graph of maximum and minimum bounds...
Fantastic news! We've Found the answer you've been seeking!
Question:
Transcribed Image Text:
Q3) a) Using the data in Table 4, draw the graph of maximum and minimum bounds of possible weekly cash flow by using float management. Hint: Each project needs to be evaluated individually first, then the findings need to be gathered to show the cash flow covering all three projects. b) Draw the graph of maximum and minimum possible weekly labor day requirement. Try to level the labor day requirements to have a least possible variation in the resources. c) Reduce the expected total duration of total completion duration of all three projects by 10-weeks with crashing technique. Draw a graph which shows the reverse correlation between cost and duration for this 10-weeks crashing. Assume that each crashing may reduce the duration by 1 week. Hint: You may crash any activity in any project without any separation between the projects. Activity A1 B1 C1 D1 E1 F1 J1 K1 A2 B2 C2 D2 E2 F2 G2 H2 J2 K2 A3 B3 C3 D3 E3 F3 K3 Cost ($ 1,000) 2.5 2 3.1 3.5 4 5.5 2 4 3.5 3 3.2 3.3 4.3 2.1 2 3.1 4.8 2.7 1.8 2.5 1.8 3 3.8 7 2.5 Table 4 Crashing-1 ($1,000) 1.5 1.5 1 2 2 1 1.5 2 1 2 1 1 2 1 1 1.5 2.5 1.5 0.5 1 0.5 2 2 3.5 1 Crashing-2 ($1,000) 0.5 1 1 1.5 1 1 0.5 1 1 1 0.5 0.5 1.5 0.5 0.5 1 1.5 1.5 0.5 1 0.5 1 0.5 2 1 Required labor days per week 5 69653 Su 11 13 4 5 5 6 7 6 6 3 4 5 8 4 2 3 3 4 5 15 6 Q3) a) Using the data in Table 4, draw the graph of maximum and minimum bounds of possible weekly cash flow by using float management. Hint: Each project needs to be evaluated individually first, then the findings need to be gathered to show the cash flow covering all three projects. b) Draw the graph of maximum and minimum possible weekly labor day requirement. Try to level the labor day requirements to have a least possible variation in the resources. c) Reduce the expected total duration of total completion duration of all three projects by 10-weeks with crashing technique. Draw a graph which shows the reverse correlation between cost and duration for this 10-weeks crashing. Assume that each crashing may reduce the duration by 1 week. Hint: You may crash any activity in any project without any separation between the projects. Activity A1 B1 C1 D1 E1 F1 J1 K1 A2 B2 C2 D2 E2 F2 G2 H2 J2 K2 A3 B3 C3 D3 E3 F3 K3 Cost ($ 1,000) 2.5 2 3.1 3.5 4 5.5 2 4 3.5 3 3.2 3.3 4.3 2.1 2 3.1 4.8 2.7 1.8 2.5 1.8 3 3.8 7 2.5 Table 4 Crashing-1 ($1,000) 1.5 1.5 1 2 2 1 1.5 2 1 2 1 1 2 1 1 1.5 2.5 1.5 0.5 1 0.5 2 2 3.5 1 Crashing-2 ($1,000) 0.5 1 1 1.5 1 1 0.5 1 1 1 0.5 0.5 1.5 0.5 0.5 1 1.5 1.5 0.5 1 0.5 1 0.5 2 1 Required labor days per week 5 69653 Su 11 13 4 5 5 6 7 6 6 3 4 5 8 4 2 3 3 4 5 15 6
Expert Answer:
Answer rating: 100% (QA)
Im unable to physically draw a graph based on the information given however I can guide you through the steps on how to create the graphs for each par... View the full answer
Related Book For
Applied Statistics From Bivariate Through Multivariate Techniques
ISBN: 9781412991346
2nd Edition
Authors: Rebecca M. Warner
Posted Date:
Students also viewed these general management questions
-
The following table presents price and sales trends for consumer goods A, B, C, and D in years 1 and 3. (a) Calculate the Laspeyres price and quantity indices for reporting year 3 using base year 1....
-
A value of your investment portfolio increased by 7.4%, while the general price level increased by 1%. What was the approximate real return on your portfolio?
-
Consider why a hospital is different than a nuclear power plan or a commercial airplane as it relates to achieving the same quality levels as high-reliability organizations. Then, reflect on the...
-
Define the term CHAMPERTY
-
Suppose the firm in Problem 3 had 35,000 shares of common stock outstanding. What is the earnings per share, or EPS, figure? What is the dividends per share figure?
-
True or False: 1. An expansionary policy can be thought of as an increase in the money supply or an increase in the interest rate. 2. A change in the nominal interest rate tends to change the real...
-
Gathii is creating a tile backsplash for his kitchen. He wants to use square tiles to cover a \(330 \mathrm{~cm} \times 12 \mathrm{~cm}\) area. What is the largest size square tile he can use to...
-
Account analysis method. Gower, Inc., a manufacturer of plastic products, reports the following manufacturing costs and account analysis classification for the year ended December 31, 2009. Gower,...
-
David Jones, the new administrator for a surgical clinic, wastrying to determine how to allocate his indirect expenses. Hisstaff was complaining that the current method of taking apercentage of rev 2...
-
Dakota Company experienced the following events during Year 2: 1. Acquired $20,000 cash from the issue of common stock. 2. Paid $22,500 cash to purchase land. 3. Borrowed $8,000 cash. 4. Provided...
-
One-line summary Toyota launches a display advertising campaign to draw awareness to the new Prius and increase sales. The problem The Prius is a hybrid electric car. Toyota needed to raise awareness...
-
What are the technological challenges in e-commerce? What role will virtual and augmented reality play in e-commerce in future?
-
How do you prepare literature review of exploration of the affecting challenge of perfomance of a company.
-
How nurses who belong to Sigma Theta Tau International Honor Society of Nursing (Sigma) can demonstrate collegiality? & How can professional nurses collaborate with and support other nurses and...
-
3. You will receive $130 in 6 months for an investment of $110 today. What is the annualized percentage rate of return with (a) annual compounding (1-times c.p.a.)? (b) semi-annual compounding...
-
How do search engine algorithm updates help businesses become better at what they do? How can a business build a search engine friendly website and maintain it such that it promotes business?
-
Choose the value of the Correlation Coefficient (r) that best describes the following scatterplot. 0.95 -0.90 -0.70 0.40
-
Find a polar equation for the curve represented by the given Cartesian equation. 4y 2 = x
-
Describe at least two potential problems with NHST.
-
Sigall and Ostrov (1975) did an experiment to assess whether the physical attractiveness of a defendant on trial for a crime had an effect on the severity of the sentence given in mock jury trials....
-
Explain the terms in this equation: X = T + e. You might use a specific example; for instance, suppose that X represents your score on a measure of life satisfaction and T represents your true level...
-
During 1998, the Senbet Discount Tire Company had gross sales of \($1\) million. The firms cost of goods sold and selling expenses were \($300,000\) and \($200,000,\) respectively. These figures do...
-
Ritter Corporations accountants prepared the following financial statements for year-end 20X2. a. Determine the change in net working capital in 20X2. b. Determine the cash flow during the year 20X2....
-
The following trial balance of X Limited, a non-listed company, has been extracted from the books after the preparation of the profit and loss account and various transfers from profit and loss for...
Study smarter with the SolutionInn App