

Question
Quarterly data for Nvidia Inc. for the most recent 10 quarters follows ($ millions). Cost of Fiscal Year Fiscal Quarter Total Assets Goods Sold
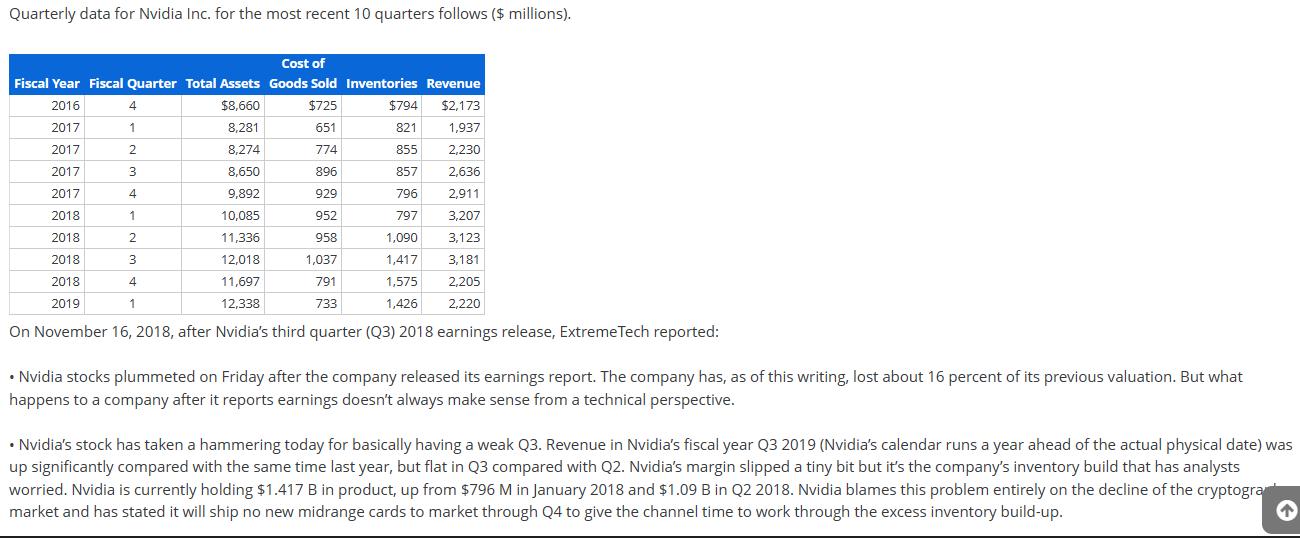
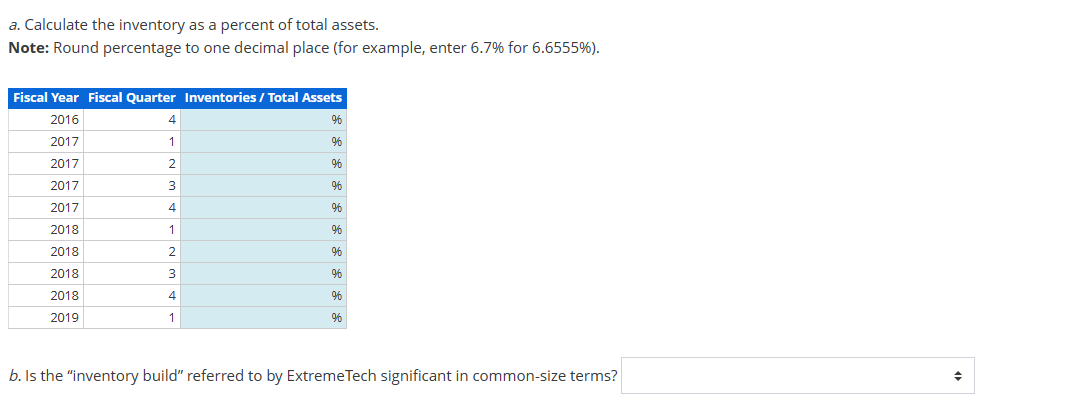
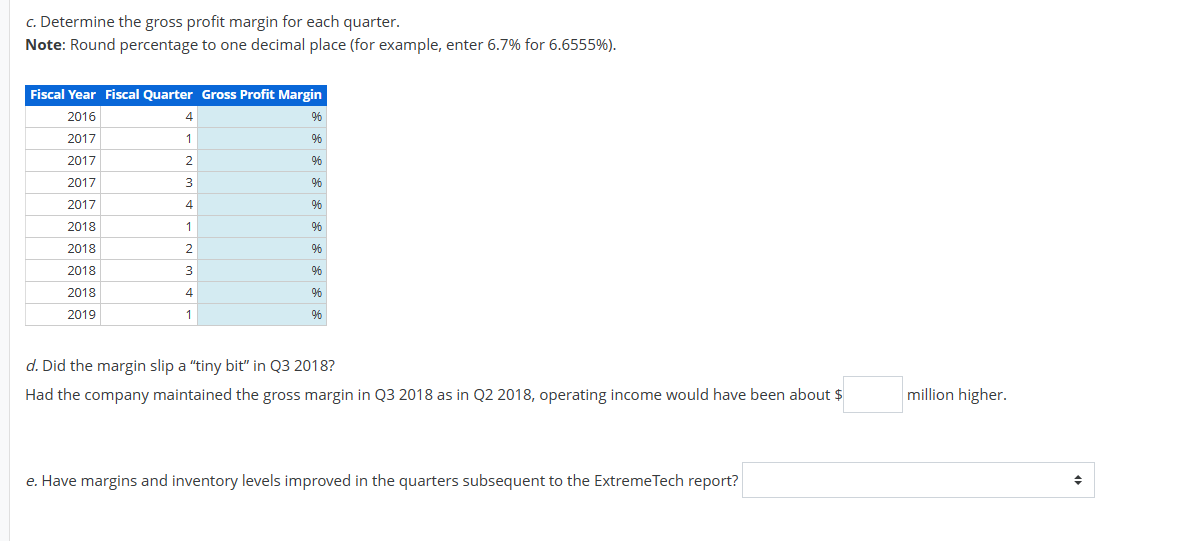
Quarterly data for Nvidia Inc. for the most recent 10 quarters follows ($ millions). Cost of Fiscal Year Fiscal Quarter Total Assets Goods Sold Inventories Revenue 2016 $725 $794 $2,173 2017 $8,660 8,281 8,274 821 1,937 651 774 2017 855 2,230 2017 8,650 896 857 2,636 2017 9,892 929 796 2,911 2018 797 3,207 2018 10,085 11,336 12,018 952 958 1,037 1,090 3,123 2018 1,417 3,181 2018 11,697 791 1,575 2,205 2019 1 12,338 733 1,426 2,220 On November 16, 2018, after Nvidia's third quarter (Q3) 2018 earnings release, ExtremeTech reported: 4 1 2 3 4 1 2 3 4 Nvidia stocks plummeted on Friday after the company released its earnings report. The company has, as of this writing, lost about 16 percent of its previous valuation. But what happens to a company after it reports earnings doesn't always make sense from a technical perspective. Nvidia's stock has taken a hammering today for basically having a weak Q3. Revenue in Nvidia's fiscal year Q3 2019 (Nvidia's calendar runs a year ahead of the actual physical date) was up significantly compared with the same time last year, but flat in Q3 compared with Q2. Nvidia's margin slipped a tiny bit but it's the company's inventory build that has analysts worried. Nvidia is currently holding $1.417 B in product, up from $796 M in January 2018 and $1.09 B in Q2 2018. Nvidia blames this problem entirely on the decline of the cryptogra market and has stated it will ship no new midrange cards to market through Q4 to give the channel time to work through the excess inventory build-up. a. Calculate the inventory as a percent of total assets. Note: Round percentage to one decimal place (for example, enter 6.7% for 6.6555%). Fiscal Year Fiscal Quarter Inventories/Total Assets 2016 2017 2017 2017 2017 2018 2018 2018 2018 2019 4 1 2 3 4 1 2 3 4 1 % % %6 %6 %6 96 96 %6 %6 % 96 b. Is the "inventory build" referred to by ExtremeTech significant in common-size terms? c. Determine the gross profit margin for each quarter. Note: Round percentage to one decimal place (for example, enter 6.7% for 6.6555%). Fiscal Year Fiscal Quarter Gross Profit Margin 2016 2017 2017 2017 2017 2018 2018 2018 2018 2019 4 1 2 3 4 1 2 3 4 1 % % % %6 % %6 %6 96 % 96 % d. Did the margin slip a "tiny bit" in Q3 2018? Had the company maintained the gross margin in Q3 2018 as in Q2 2018, operating income would have been about $ e. Have margins and inventory levels improved in the quarters subsequent to the ExtremeTech report? million higher. +
Step by Step Solution
There are 3 Steps involved in it
Step: 1
Answer Heres the calculation Fiscal Year Fiscal Quarter Inventories millions Total Assets millions I...
Get Instant Access with AI-Powered Solutions
See step-by-step solutions with expert insights and AI powered tools for academic success
Step: 2

Step: 3
Ace Your Homework with AI
Get the answers you need in no time with our AI-driven, step-by-step assistance
Get Started
Horngrens Financial and Managerial Accounting
Authors: Tracie L. Nobles, Brenda L. Mattison, Ella Mae Matsumura
5th edition
9780133851281, 013385129x, 9780134077321, 133866297, 133851281, 9780133851298, 134077326, 978-0133866292