

Question 1 Consider the Analytics Exercise: Forecasting Supply Chain Demand-Starbucks Corporation at the end of Chapter18 in
Question:
Question 1
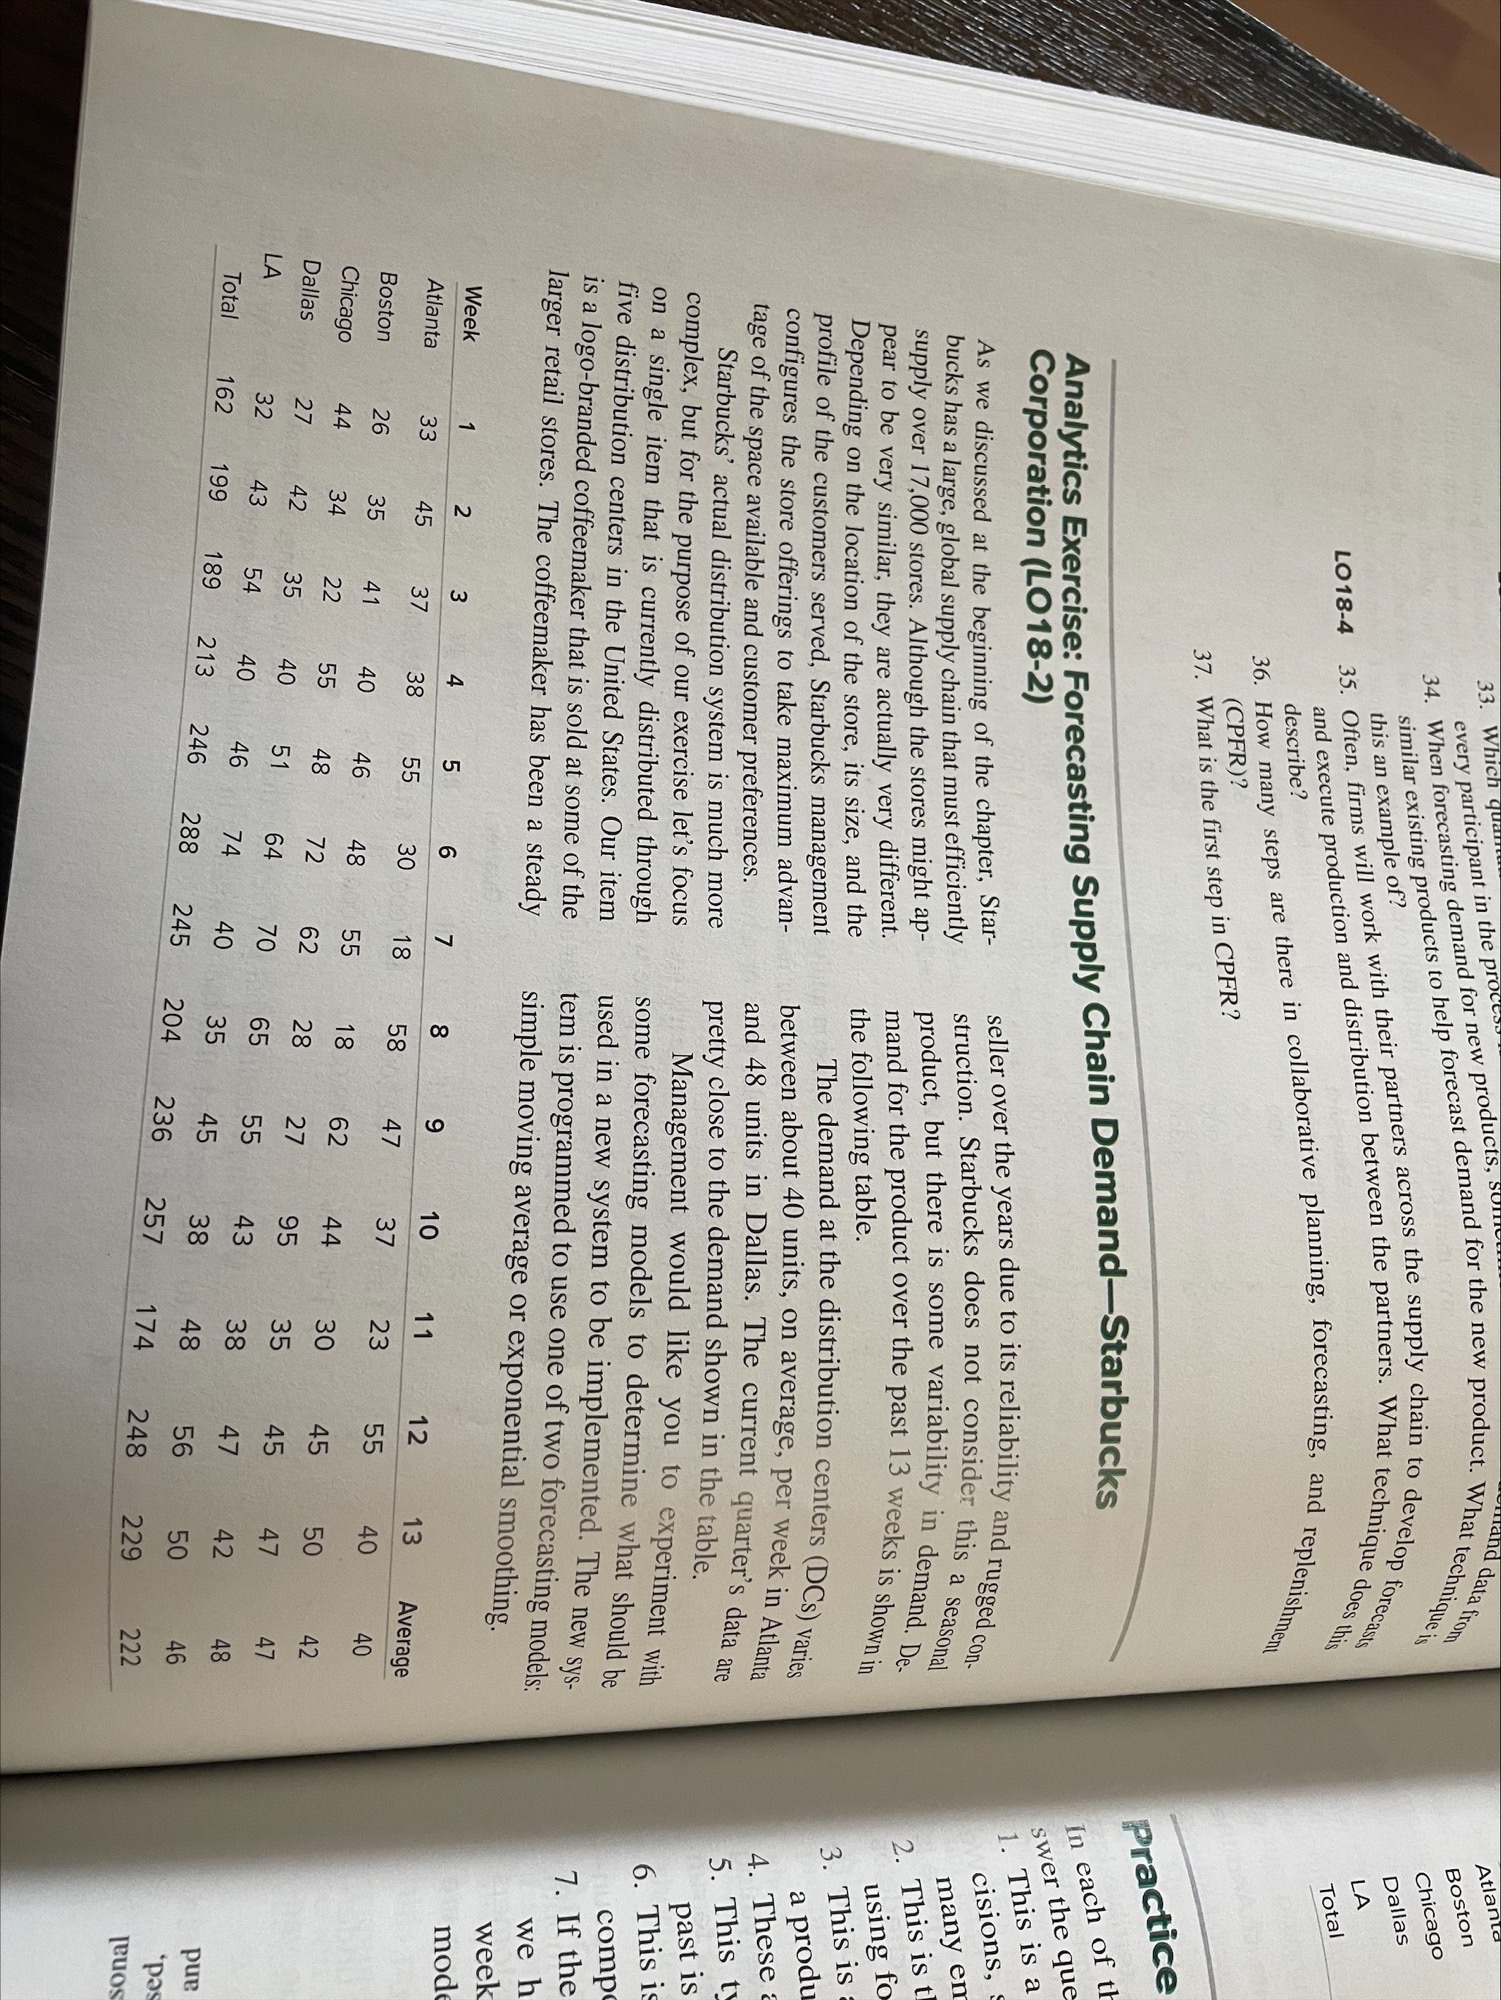
Consider the "Analytics Exercise: Forecasting Supply Chain Demand-Starbucks Corporation" at the end of Chapter18 in your course textbook. Open a blank Excel workbook, and rename the second tab as Q1starbuck-partA. The remaining tabs should be renamed as Q1starbuck-partB, Q1starbuck-partC, Q1starbuck-partD, Q1starbuck-partE, and Q1starbuck-partF. The following questions should be analyzed in Excel and answered using textboxes in the same tab.
Part A
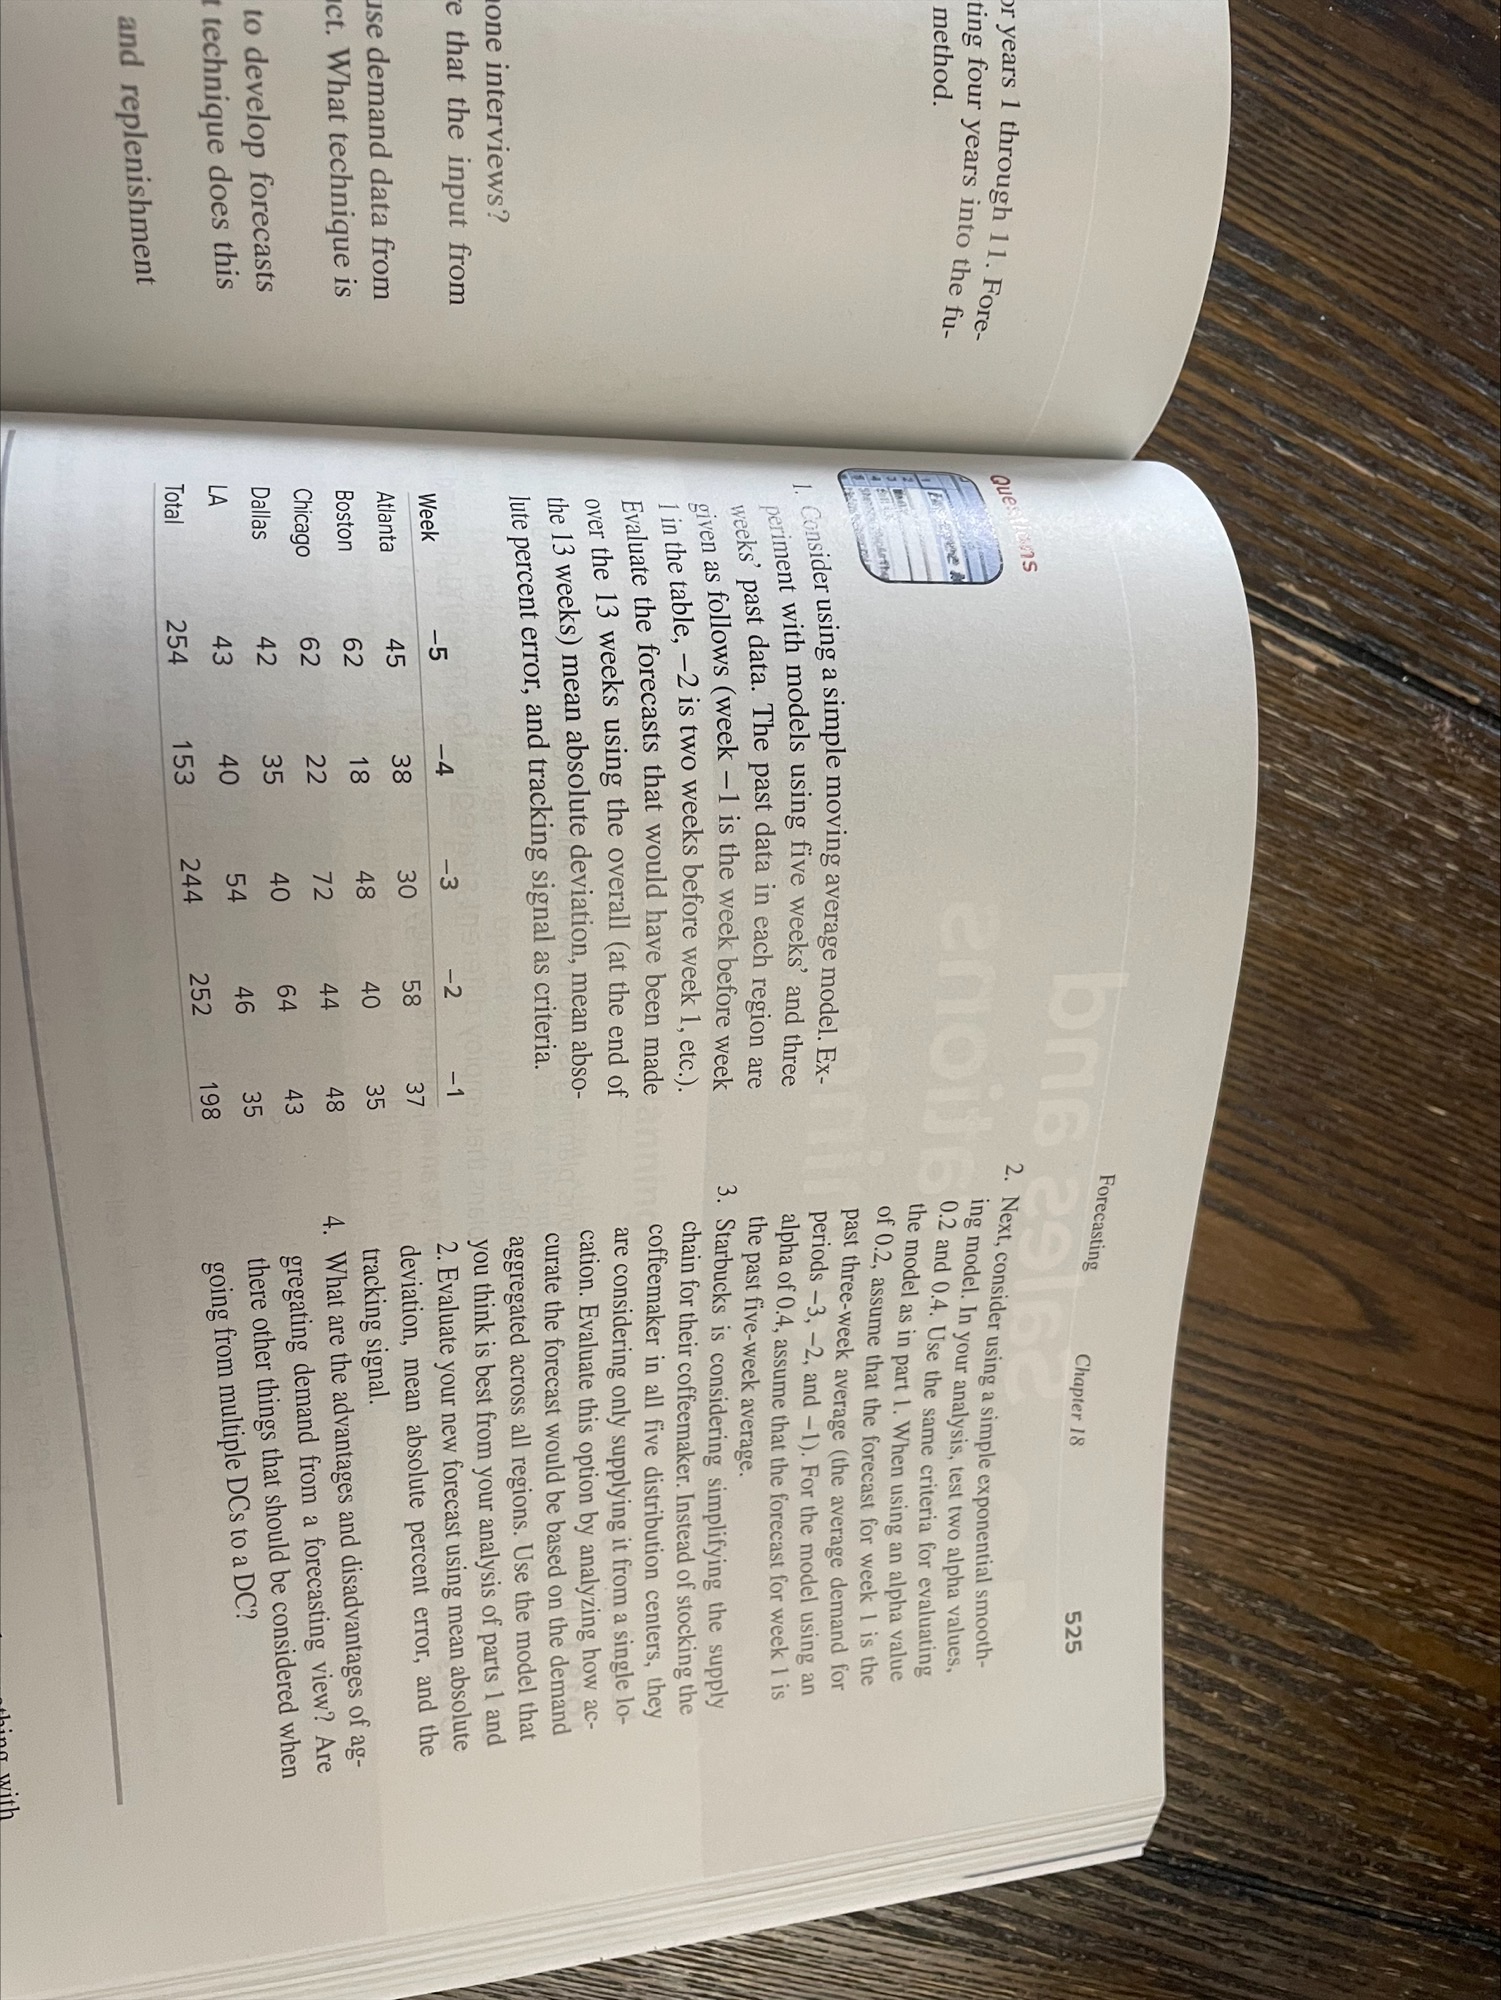
You will develop simple moving average forecast based on the past 5 weeks and the past 3 weeks of data and find the MAD, MSE, MAPE, and tracking signal of your forecast. Which forecast, the 5-week or the 3-week, is more accurate for each of the distribution centres? Provide a rationale for its better accuracy for that particular warehouse using a text box.
Part B
Following the question on the next page of the exercise in your textbook, you will develop exponential smoothing forecast based on alpha = 0.2 and alpha = 0.4 and find the MAD, MSE, MAPE, and tracking signal of your forecast. Which forecast, alpha=0.2 or alpha =0.4, is more accurate for each of the distribution centres? Which value of alpha emphasizes more on the past data?
Part C
Starbucks is planning to consolidate the five distribution centres into one with the aggregated demand represented by the total row. Perform forecasts for the 3-week moving average, 5-week moving average, 0.2 alpha exponential smoothing, and 0.4 alpha exponential smoothing on the aggregated total demand. After comparing the results and accuracy measures, provide a rationale on which of these four forecasting methods you would recommend to Starbucks.
Part D
Starbucks also wants you to develop a linear regression model based on the total demand data for Week -1 to -5. Use this model to predict the total aggregated demand for Week 1 to Week 13, and find the forecast accuracy in terms of MAD, MSE, and MAPE. Does linear regression outperform your suggested method in Part C of this question in terms of accuracy measures?
Part E
Discuss any two pros and two cons of aggregating demand of these five distribution centres.
Part F
Expert Answer:
To address the questions presented lets break down each part and outline the steps needed to analyze and answer them in Excel Part A Simple Moving Average Forecast Open an Excel workbook and create a ... View the full answer


Computer Architecture A Quantitative Approach
ISBN: 978-0123704900
4th edition
Authors: John L. Hennessy, David A. Patterson
