

Question 1 The data below resulted from selecting a sample of 15 batches of 500 computer...
Fantastic news! We've Found the answer you've been seeking!
Question:

Transcribed Image Text:
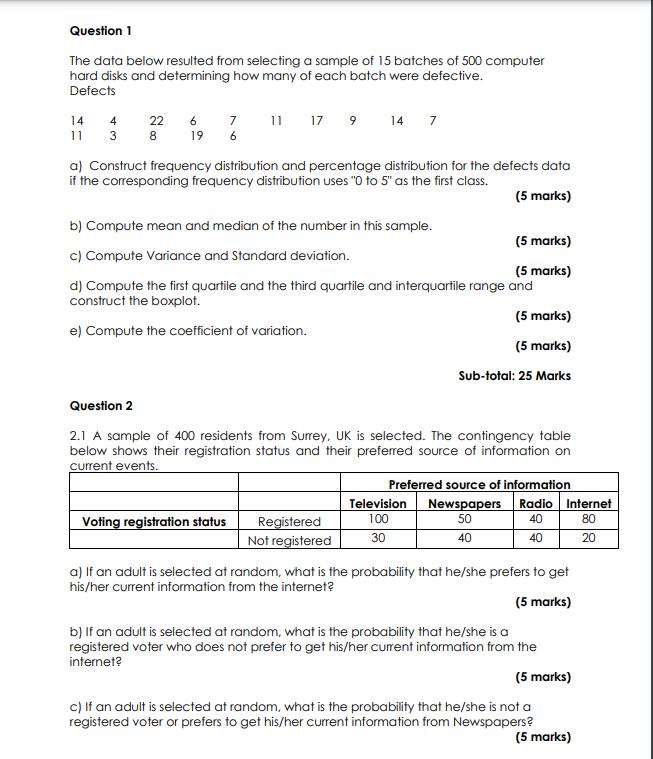
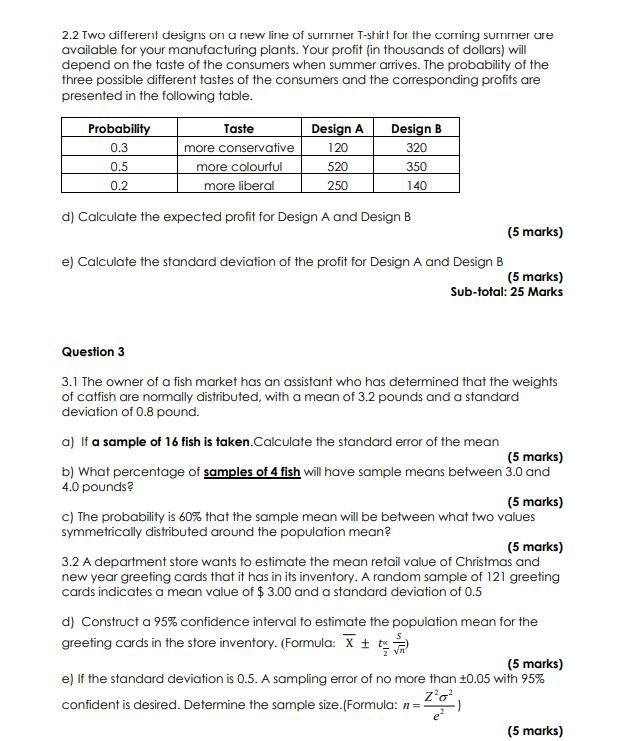
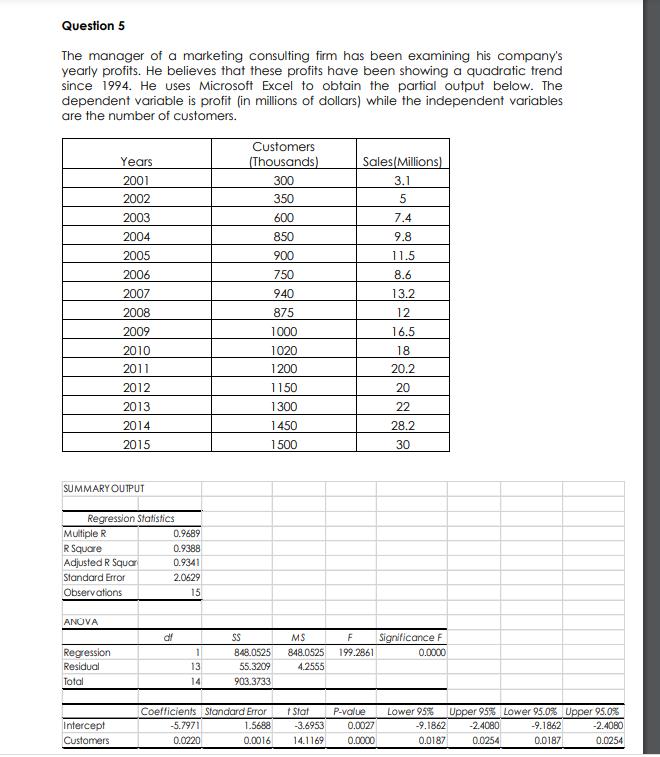
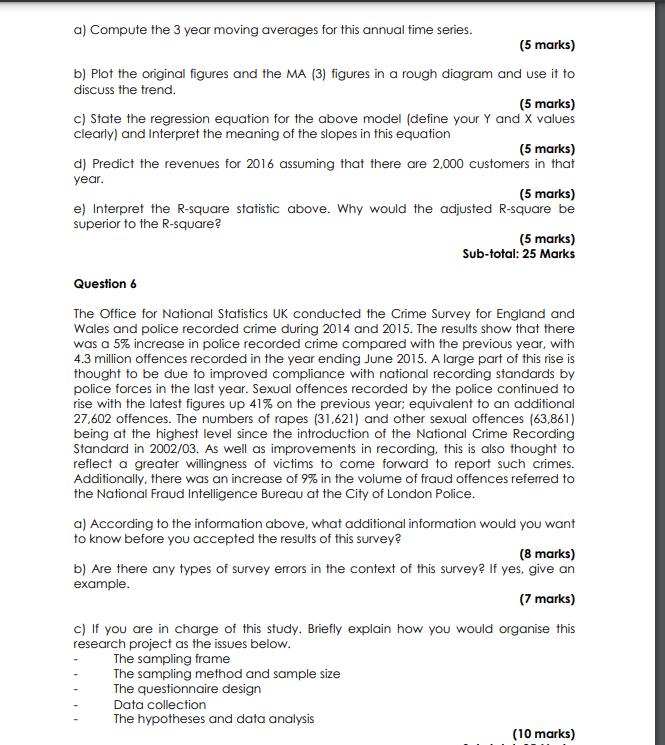
Question 1 The data below resulted from selecting a sample of 15 batches of 500 computer hard disks and determining how many of each batch were defective. Defects 14 11 4 22 3 8 19 6 6 7 11 17 9 a) Construct frequency distribution and percentage distribution for the defects data if the corresponding frequency distribution uses "0 to 5" as the first class. (5 marks) 14 7 b) Compute mean and median of the number in this sample. (5 marks) c) Compute Variance and Standard deviation. (5 marks) d) Compute the first quartile and the third quartile and interquartile range and construct the boxplot. (5 marks) e) Compute the coefficient of variation. (5 marks) Sub-total: 25 Marks Question 2 2.1 A sample of 400 residents from Surrey, UK is selected. The contingency table below shows their registration status and their preferred source of information on current events. Voting registration status Registered Not registered Preferred source of information Television Newspapers Radio Internet 100 50 40 80 30 40 40 20 a) If an adult is selected at random, what is the probability that he/she prefers to get his/her current information from the internet? (5 marks) b) If an adult is selected at random, what is the probability that he/she is a registered voter who does not prefer to get his/her current information from the internet? (5 marks) c) If an adult is selected at random, what is the probability that he/she is not a registered voter or prefers to get his/her current information from Newspapers? (5 marks) 2.2 Two different designs on a new line of summer T-shirt for the coming summer are available for your manufacturing plants. Your profit (in thousands of dollars) will depend on the taste of the consumers when summer arrives. The probability of the three possible different tastes of the consumers and the corresponding profits are presented in the following table. Probability 0.3 0.5 0.2 Design A 120 520 250 Design B 320 350 140 Taste more conservative more colourful more liberal d) Calculate the expected profit for Design A and Design B e) Calculate the standard deviation of the profit for Design A and Design B (5 marks) (5 marks) Sub-total: 25 Marks Question 3 3.1 The owner of a fish market has an assistant who has determined that the weights of catfish are normally distributed, with a mean of 3.2 pounds and a standard deviation of 0.8 pound. a) If a sample of 16 fish is taken.Calculate the standard error of the mean (5 marks) b) What percentage of samples of 4 fish will have sample means between 3.0 and 4.0 pounds? (5 marks) c) The probability is 60% that the sample mean will be between what two values symmetrically distributed around the population mean? (5 marks) 3.2 A department store wants to estimate the mean retail value of Christmas and new year greeting cards that it has in its inventory. A random sample of 121 greeting cards indicates a mean value of $ 3.00 and a standard deviation of 0.5 d) Construct a 95% confidence interval to estimate the population mean for the greeting cards in the store inventory. (Formula: X + t = (5 marks) e) If the standard deviation is 0.5. A sampling error of no more than ±0.05 with 95% Z²o² confident is desired. Determine the sample size. (Formula: n= (5 marks) Question 4 Suppose that 5,000 sales orders of a stationery store are separated into four strata. A sample of 200 invoices is needed. Stratum 1 1000 Stratum 2 500 a) What type of sampling method should you do and why? (5 marks) b) Explain how you would carry out the sampling according to the method stated in a). ANOVA Source of Variation Between Groups Within Groups (5 marks) c) What are the differences between a Type I and a Type Il error? Give an example. (5 marks) d) What is the p-value? Explain how to use the p-value approach as the decision rule for rejecting the null hypothesis? Total Stratum 3 2,300 (5 marks) e) Referring the table below, at the 0.01 level of significance, is there a difference in the mean strength between groups? What is your statistical decision? Stratum 4 1200 df SS 5.086538 1 144.0569 24 149.1435 25 MS F P-value F crit 5.086538 0.847421 0.366444 4.259677 6.002372 Question 5 The manager of a marketing consulting firm has been examining his company's yearly profits. He believes that these profits have been showing a quadratic trend since 1994. He uses Microsoft Excel to obtain the partial output below. The dependent variable is profit (in millions of dollars) while the independent variables are the number of customers. SUMMARY OUTPUT Multiple R R Square Regression Statistics Years 2001 2002 2003 2004 2005 2006 2007 2008 2009 2010 2011 ANOVA 2012 2013 2014 2015 Adjusted R Squar Standard Error Observations Regression Residual Total Intercept Customers 0.9689 0.9388 0.9341 2.0629 15 df 1 13 14 Customers (Thousands) 300 350 600 850 900 750 -5.7971 0.0220 940 875 1000 1020 1200 1150 1300 1450 1500 Sales (Millions) 3.1 5 7.4 9.8 11.5 8.6 SS MS F 848.0525 848.0525 199.2861 4.2555 55.3209 903.3733 Coefficients Standard Error t Stat P-value 0.0027 1.5688 -3.6953 0.0016 14.1169 0.0000 13.2 12 16.5 18 20.2 20 22 28.2 30 Significance F 0.0000 Lower 95% -9.1862 0.0187 Upper 95% Lower 95.0% Upper 95.0% -2.4080 -9.1862 -2.4080 0.0254 0.0187 0.0254 a) Compute the 3 year moving averages for this annual time series. (5 marks) b) Plot the original figures and the MA (3) figures in a rough diagram and use it to discuss the trend. (5 marks) c) State the regression equation for the above model (define your Y and X values clearly) and Interpret the meaning of the slopes in this equation (5 marks) d) Predict the revenues for 2016 assuming that there are 2,000 customers in that year. (5 marks) e) Interpret the R-square statistic above. Why would the adjusted R-square be superior to the R-square? (5 marks) Sub-total: 25 Marks Question 6 The Office for National Statistics UK conducted the Crime Survey for England and Wales and police recorded crime during 2014 and 2015. The results show that there was a 5% increase in police recorded crime compared with the previous year, with 4.3 million offences recorded in the year ending June 2015. A large part of this rise is thought to be due to improved compliance with national recording standards by police forces in the last year. Sexual offences recorded by the police continued to rise with the latest figures up 41% on the previous year; equivalent to an additional 27,602 offences. The numbers of rapes (31,621) and other sexual offences (63,861) being at the highest level since the introduction of the National Crime Recording Standard in 2002/03. As well as improvements in recording, this is also thought to reflect a greater willingness of victims to come forward to report such crimes. Additionally, there was an increase of 9% in the volume of fraud offences referred to the National Fraud Intelligence Bureau at the City of London Police. a) According to the information above, what additional information would you want to know before you accepted the results of this survey? (8 marks) b) Are there any types of survey errors in the context of this survey? If yes, give an example. (7 marks) c) If you are in charge of this study. Briefly explain how you would organise this research project as the issues below. The sampling frame The sampling method and sample size The questionnaire design Data collection The hypotheses and data analysis (10 marks) Question 1 The data below resulted from selecting a sample of 15 batches of 500 computer hard disks and determining how many of each batch were defective. Defects 14 11 4 22 3 8 19 6 6 7 11 17 9 a) Construct frequency distribution and percentage distribution for the defects data if the corresponding frequency distribution uses "0 to 5" as the first class. (5 marks) 14 7 b) Compute mean and median of the number in this sample. (5 marks) c) Compute Variance and Standard deviation. (5 marks) d) Compute the first quartile and the third quartile and interquartile range and construct the boxplot. (5 marks) e) Compute the coefficient of variation. (5 marks) Sub-total: 25 Marks Question 2 2.1 A sample of 400 residents from Surrey, UK is selected. The contingency table below shows their registration status and their preferred source of information on current events. Voting registration status Registered Not registered Preferred source of information Television Newspapers Radio Internet 100 50 40 80 30 40 40 20 a) If an adult is selected at random, what is the probability that he/she prefers to get his/her current information from the internet? (5 marks) b) If an adult is selected at random, what is the probability that he/she is a registered voter who does not prefer to get his/her current information from the internet? (5 marks) c) If an adult is selected at random, what is the probability that he/she is not a registered voter or prefers to get his/her current information from Newspapers? (5 marks) 2.2 Two different designs on a new line of summer T-shirt for the coming summer are available for your manufacturing plants. Your profit (in thousands of dollars) will depend on the taste of the consumers when summer arrives. The probability of the three possible different tastes of the consumers and the corresponding profits are presented in the following table. Probability 0.3 0.5 0.2 Design A 120 520 250 Design B 320 350 140 Taste more conservative more colourful more liberal d) Calculate the expected profit for Design A and Design B e) Calculate the standard deviation of the profit for Design A and Design B (5 marks) (5 marks) Sub-total: 25 Marks Question 3 3.1 The owner of a fish market has an assistant who has determined that the weights of catfish are normally distributed, with a mean of 3.2 pounds and a standard deviation of 0.8 pound. a) If a sample of 16 fish is taken.Calculate the standard error of the mean (5 marks) b) What percentage of samples of 4 fish will have sample means between 3.0 and 4.0 pounds? (5 marks) c) The probability is 60% that the sample mean will be between what two values symmetrically distributed around the population mean? (5 marks) 3.2 A department store wants to estimate the mean retail value of Christmas and new year greeting cards that it has in its inventory. A random sample of 121 greeting cards indicates a mean value of $ 3.00 and a standard deviation of 0.5 d) Construct a 95% confidence interval to estimate the population mean for the greeting cards in the store inventory. (Formula: X + t = (5 marks) e) If the standard deviation is 0.5. A sampling error of no more than ±0.05 with 95% Z²o² confident is desired. Determine the sample size. (Formula: n= (5 marks) Question 4 Suppose that 5,000 sales orders of a stationery store are separated into four strata. A sample of 200 invoices is needed. Stratum 1 1000 Stratum 2 500 a) What type of sampling method should you do and why? (5 marks) b) Explain how you would carry out the sampling according to the method stated in a). ANOVA Source of Variation Between Groups Within Groups (5 marks) c) What are the differences between a Type I and a Type Il error? Give an example. (5 marks) d) What is the p-value? Explain how to use the p-value approach as the decision rule for rejecting the null hypothesis? Total Stratum 3 2,300 (5 marks) e) Referring the table below, at the 0.01 level of significance, is there a difference in the mean strength between groups? What is your statistical decision? Stratum 4 1200 df SS 5.086538 1 144.0569 24 149.1435 25 MS F P-value F crit 5.086538 0.847421 0.366444 4.259677 6.002372 Question 5 The manager of a marketing consulting firm has been examining his company's yearly profits. He believes that these profits have been showing a quadratic trend since 1994. He uses Microsoft Excel to obtain the partial output below. The dependent variable is profit (in millions of dollars) while the independent variables are the number of customers. SUMMARY OUTPUT Multiple R R Square Regression Statistics Years 2001 2002 2003 2004 2005 2006 2007 2008 2009 2010 2011 ANOVA 2012 2013 2014 2015 Adjusted R Squar Standard Error Observations Regression Residual Total Intercept Customers 0.9689 0.9388 0.9341 2.0629 15 df 1 13 14 Customers (Thousands) 300 350 600 850 900 750 -5.7971 0.0220 940 875 1000 1020 1200 1150 1300 1450 1500 Sales (Millions) 3.1 5 7.4 9.8 11.5 8.6 SS MS F 848.0525 848.0525 199.2861 4.2555 55.3209 903.3733 Coefficients Standard Error t Stat P-value 0.0027 1.5688 -3.6953 0.0016 14.1169 0.0000 13.2 12 16.5 18 20.2 20 22 28.2 30 Significance F 0.0000 Lower 95% -9.1862 0.0187 Upper 95% Lower 95.0% Upper 95.0% -2.4080 -9.1862 -2.4080 0.0254 0.0187 0.0254 a) Compute the 3 year moving averages for this annual time series. (5 marks) b) Plot the original figures and the MA (3) figures in a rough diagram and use it to discuss the trend. (5 marks) c) State the regression equation for the above model (define your Y and X values clearly) and Interpret the meaning of the slopes in this equation (5 marks) d) Predict the revenues for 2016 assuming that there are 2,000 customers in that year. (5 marks) e) Interpret the R-square statistic above. Why would the adjusted R-square be superior to the R-square? (5 marks) Sub-total: 25 Marks Question 6 The Office for National Statistics UK conducted the Crime Survey for England and Wales and police recorded crime during 2014 and 2015. The results show that there was a 5% increase in police recorded crime compared with the previous year, with 4.3 million offences recorded in the year ending June 2015. A large part of this rise is thought to be due to improved compliance with national recording standards by police forces in the last year. Sexual offences recorded by the police continued to rise with the latest figures up 41% on the previous year; equivalent to an additional 27,602 offences. The numbers of rapes (31,621) and other sexual offences (63,861) being at the highest level since the introduction of the National Crime Recording Standard in 2002/03. As well as improvements in recording, this is also thought to reflect a greater willingness of victims to come forward to report such crimes. Additionally, there was an increase of 9% in the volume of fraud offences referred to the National Fraud Intelligence Bureau at the City of London Police. a) According to the information above, what additional information would you want to know before you accepted the results of this survey? (8 marks) b) Are there any types of survey errors in the context of this survey? If yes, give an example. (7 marks) c) If you are in charge of this study. Briefly explain how you would organise this research project as the issues below. The sampling frame The sampling method and sample size The questionnaire design Data collection The hypotheses and data analysis (10 marks)
Expert Answer:
Answer rating: 100% (QA)
For constructing histogram we have to find frequencies The Frequ... View the full answer

Related Book For 

Income Tax Fundamentals 2013
ISBN: 9781285586618
31st Edition
Authors: Gerald E. Whittenburg, Martha Altus Buller, Steven L Gill
Posted Date:
Students also viewed these accounting questions
-
Managing Scope Changes Case Study Scope changes on a project can occur regardless of how well the project is planned or executed. Scope changes can be the result of something that was omitted during...
-
The following additional information is available for the Dr. Ivan and Irene Incisor family from Chapters 1-5. Ivan's grandfather died and left a portfolio of municipal bonds. In 2012, they pay Ivan...
-
Planning is one of the most important management functions in any business. A front office managers first step in planning should involve determine the departments goals. Planning also includes...
-
The following summarized statement of profit or loss has been extracted from the financial statements of Gwembe Mining Corporation, a Zambian resident company which engaged in open cast mining...
-
You will be starting a new fast food company .You will record the beginning journal entries. You will list at least 6 journal entries including issuing stock to start the company, a lease, accounting...
-
Ben, Bev, and Ron are partners in a business that is in the process of liquidation. On January 1, 2011, the ledger accounts show the balances indicated: Cash .....................................
-
The accounting records of Compass Bookstores, Inc., include the following: Requirement Report these liabilities on Compass Bookstores' balance sheet, including headings and totals for current...
-
Enter the following data into a spreadsheet and then perform the following tasks: a. Calculate examples of these batch totals: A has total A financial total A record count b. Assume the following...
-
JD Hub is a national retailer company specialized in selling electronics products. The CEO of JD Hub wants to increase their sales on Boxing Day. This year (2022), he plans to give more discounts to...
-
Richard McCarthy (born 2/14/64; Social Security number 100-10-9090) and Christine McCarthy (born 6/1/1966; Social security number 101-21- 3434) have a 19-year-old son (born 10/2/99 Social Security...
-
Which properly declares a variable of struct foo? O struct foo; O foo var; O foo; O int foo;
-
Which scrum event supports the following Agile principle: At regular intervals, the team reflects on how to become more effective, then tunes and adjusts its behaviour accordingly? 1- Sprint...
-
Week 8 Discussion: Inventory Management CO9: Evaluate the impact of Inventory management systems on a supply chain network's effectiveness Discussion Prompt: For this week's Discussion, chose one of...
-
Share the primary, secondary, and tertiary packaging of a specific product that is either exported or imported. What sorts of risks does this product encounter with being shipped, and how do these...
-
what are some various strategic functions that could impact the Marketing business plan?
-
Critically evaluate the best practices implemented by Microsoft to compensate and motivate their employees and discuss discretionary benefits that you would recommend the organization to implement...
-
Why should people care about password security? 2. Can computer hacking be justified under extraordinary circumstances. Imagine that you will have to break into a neighbor's car in order to drive a...
-
President Lee Coone has asked you to continue planning for an integrated corporate NDAS network. Ultimately, this network will link all the offices with the Tampa head office and become the...
-
Professor Patricia (Patty) Pate is retired from the PalmSprings Culinary Arts Academy (PSCAA). She is a single taxpayer and is 68 years old. Patty lives at 98 Colander Street, Henderson, NV 89052....
-
Leslie is a single taxpayer who is under age 65 and in good health. For 2012, she has a salary of $23,000 and itemized deductions of $1,000. Leslie is entitled to one exemption on her tax return. a....
-
While preparing Massie Miller's 2012 Schedule A, you review the following list of possible charitable deductions provided by Massie: Cash contribution to a family whose house burned...
-
Assume that Boardmaster sold skateboards to a department store for \($35,000\) cash. How would this transaction affect Boardmasters accounting equation? a. Increase both assets and stockholders...
-
Generally Accepted Accounting Principles (GAAP) are created by the a. Securities and Exchange Commission (SEC). b. Financial Accounting Standards Board (FASB). C. Institute of Management Accountants...
-
Boardmaster is famous for custom skateboards. At the end of a recent year, Boardmasters total assets added up to \($622\) million, and stockholders equity was \($487\) million. How much did...

Study smarter with the SolutionInn App