

Question 2 (20 points). The market supply and demand curves for a product are: Qs-0.5P (supply...
Fantastic news! We've Found the answer you've been seeking!
Question:
Transcribed Image Text:
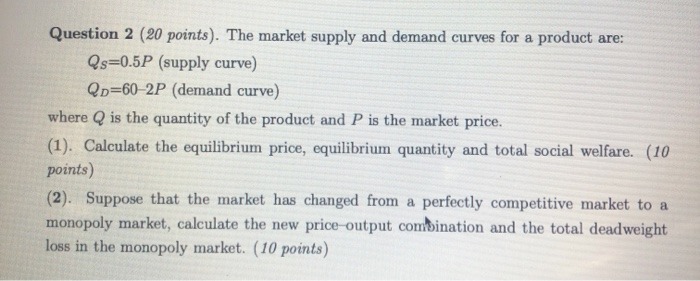
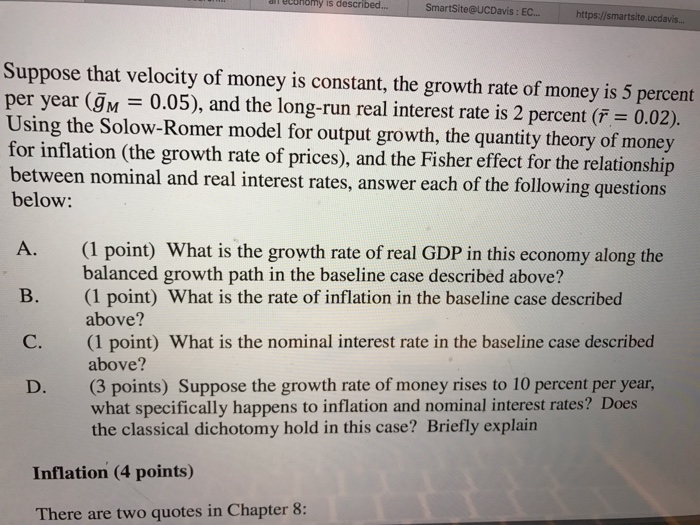
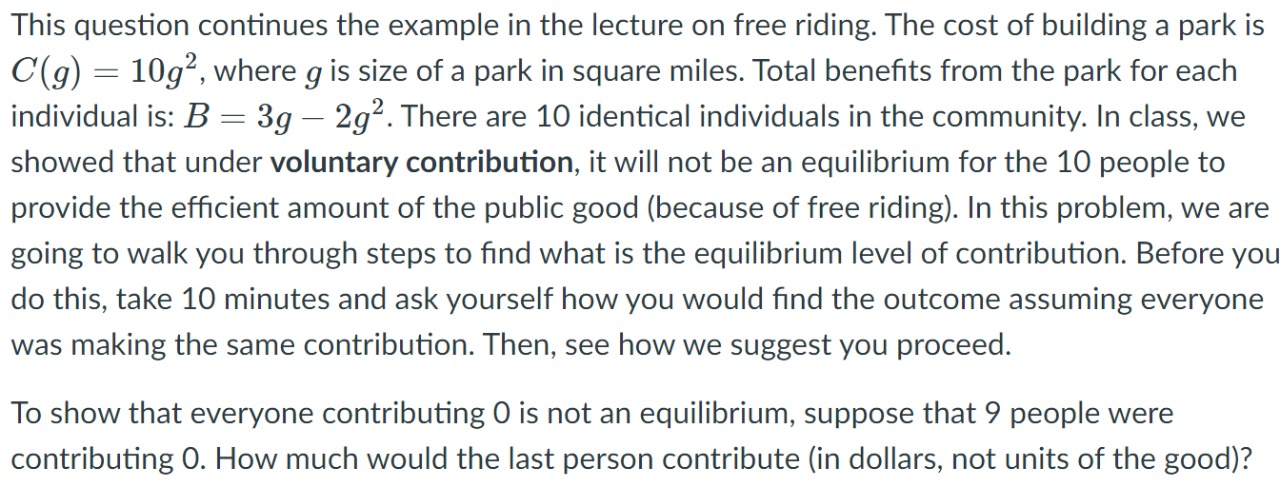
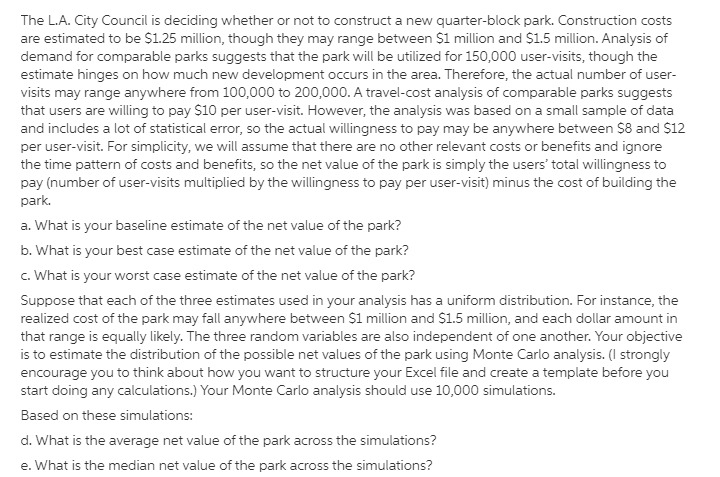
Question 2 (20 points). The market supply and demand curves for a product are: Qs-0.5P (supply curve) QD-60-2P (demand curve) where Q is the quantity of the product and P is the market price. (1). Calculate the equilibrium price, equilibrium quantity and total social welfare. (10 points) (2). Suppose that the market has changed from a perfectly competitive market to a monopoly market, calculate the new price output combination and the total deadweight loss in the monopoly market. (10 points) onomy is described... SmartSite@UCDavis: EC... https://smartsite.ucdavis... Suppose that velocity of money is constant, the growth rate of money is 5 percent per year (M = 0.05), and the long-run real interest rate is 2 percent (r = 0.02). Using the Solow-Romer model for output growth, the quantity theory of money for inflation (the growth rate of prices), and the Fisher effect for the relationship between nominal and real interest rates, answer each of the following questions below: A. B. C. D. (1 point) What is the growth rate of real GDP in this economy along the balanced growth path in the baseline case described above? (1 point) What is the rate of inflation in the baseline case described above? (1 point) What is the nominal interest rate in the baseline case described above? (3 points) Suppose the growth rate of money rises to 10 percent per year, what specifically happens to inflation and nominal interest rates? Does the classical dichotomy hold in this case? Briefly explain Inflation (4 points) There are two quotes in Chapter 8: This question continues the example in the lecture on free riding. The cost of building a park is C(g) = 10g², where g is size of a park in square miles. Total benefits from the park for each individual is: B = 3g - 2g². There are 10 identical individuals in the community. In class, we showed that under voluntary contribution, it will not be an equilibrium for the 10 people to provide the efficient amount of the public good (because of free riding). In this problem, we are going to walk you through steps to find what is the equilibrium level of contribution. Before you do this, take 10 minutes and ask yourself how you would find the outcome assuming everyone was making the same contribution. Then, see how we suggest you proceed. To show that everyone contributing O is not an equilibrium, suppose that 9 people were contributing O. How much would the last person contribute (in dollars, not units of the good)? The L.A. City Council is deciding whether or not to construct a new quarter-block park. Construction costs are estimated to be $1.25 million, though they may range between $1 million and $1.5 million. Analysis of demand for comparable parks suggests that the park will be utilized for 150,000 user-visits, though the estimate hinges on how much new development occurs in the area. Therefore, the actual number of user- visits may range anywhere from 100,000 to 200,000. A travel-cost analysis of comparable parks suggests that users are willing to pay $10 per user-visit. However, the analysis was based on a small sample of data and includes a lot of statistical error, so the actual willingness to pay may be anywhere between $8 and $12 per user-visit. For simplicity, we will assume that there are no other relevant costs or benefits and ignore the time pattern of costs and benefits, so the net value of the park is simply the users' total willingness to pay (number of user-visits multiplied by the willingness to pay per user-visit) minus the cost of building the park. a. What is your baseline estimate of the net value of the park? b. What is your best case estimate of the net value of the park? c. What is your worst case estimate of the net value of the park? Suppose that each of the three estimates used in your analysis has a uniform distribution. For instance, the realized cost of the park may fall anywhere between $1 million and $1.5 million, and each dollar amount in that range is equally likely. The three random variables are also independent of one another. Your objective is to estimate the distribution of the possible net values of the park using Monte Carlo analysis. (I strongly encourage you to think about how you want to structure your Excel file and create a template before you start doing any calculations.) Your Monte Carlo analysis should use 10,000 simulations. Based on these simulations: d. What is the average net value of the park across the simulations? e. What is the median net value of the park across the simulations? Question 2 (20 points). The market supply and demand curves for a product are: Qs-0.5P (supply curve) QD-60-2P (demand curve) where Q is the quantity of the product and P is the market price. (1). Calculate the equilibrium price, equilibrium quantity and total social welfare. (10 points) (2). Suppose that the market has changed from a perfectly competitive market to a monopoly market, calculate the new price output combination and the total deadweight loss in the monopoly market. (10 points) onomy is described... SmartSite@UCDavis: EC... https://smartsite.ucdavis... Suppose that velocity of money is constant, the growth rate of money is 5 percent per year (M = 0.05), and the long-run real interest rate is 2 percent (r = 0.02). Using the Solow-Romer model for output growth, the quantity theory of money for inflation (the growth rate of prices), and the Fisher effect for the relationship between nominal and real interest rates, answer each of the following questions below: A. B. C. D. (1 point) What is the growth rate of real GDP in this economy along the balanced growth path in the baseline case described above? (1 point) What is the rate of inflation in the baseline case described above? (1 point) What is the nominal interest rate in the baseline case described above? (3 points) Suppose the growth rate of money rises to 10 percent per year, what specifically happens to inflation and nominal interest rates? Does the classical dichotomy hold in this case? Briefly explain Inflation (4 points) There are two quotes in Chapter 8: This question continues the example in the lecture on free riding. The cost of building a park is C(g) = 10g², where g is size of a park in square miles. Total benefits from the park for each individual is: B = 3g - 2g². There are 10 identical individuals in the community. In class, we showed that under voluntary contribution, it will not be an equilibrium for the 10 people to provide the efficient amount of the public good (because of free riding). In this problem, we are going to walk you through steps to find what is the equilibrium level of contribution. Before you do this, take 10 minutes and ask yourself how you would find the outcome assuming everyone was making the same contribution. Then, see how we suggest you proceed. To show that everyone contributing O is not an equilibrium, suppose that 9 people were contributing O. How much would the last person contribute (in dollars, not units of the good)? The L.A. City Council is deciding whether or not to construct a new quarter-block park. Construction costs are estimated to be $1.25 million, though they may range between $1 million and $1.5 million. Analysis of demand for comparable parks suggests that the park will be utilized for 150,000 user-visits, though the estimate hinges on how much new development occurs in the area. Therefore, the actual number of user- visits may range anywhere from 100,000 to 200,000. A travel-cost analysis of comparable parks suggests that users are willing to pay $10 per user-visit. However, the analysis was based on a small sample of data and includes a lot of statistical error, so the actual willingness to pay may be anywhere between $8 and $12 per user-visit. For simplicity, we will assume that there are no other relevant costs or benefits and ignore the time pattern of costs and benefits, so the net value of the park is simply the users' total willingness to pay (number of user-visits multiplied by the willingness to pay per user-visit) minus the cost of building the park. a. What is your baseline estimate of the net value of the park? b. What is your best case estimate of the net value of the park? c. What is your worst case estimate of the net value of the park? Suppose that each of the three estimates used in your analysis has a uniform distribution. For instance, the realized cost of the park may fall anywhere between $1 million and $1.5 million, and each dollar amount in that range is equally likely. The three random variables are also independent of one another. Your objective is to estimate the distribution of the possible net values of the park using Monte Carlo analysis. (I strongly encourage you to think about how you want to structure your Excel file and create a template before you start doing any calculations.) Your Monte Carlo analysis should use 10,000 simulations. Based on these simulations: d. What is the average net value of the park across the simulations? e. What is the median net value of the park across the simulations?
Expert Answer:
Answer rating: 100% (QA)
Here are the answers to the questions with detailed stepbystep calculations A 1 point What is the growth rate of real GDP in this economy along the balanced growth path in the baseline case described ... View the full answer

Related Book For 

Financial Algebra advanced algebra with financial applications
ISBN: 978-0538449670
1st edition
Authors: Robert K. Gerver
Posted Date:
Students also viewed these finance questions
-
Examine changes in price and quantity caused when governments take actions to modify market outcomes. In a perfectly competitive market, the equilibrium price and quantity represent the most...
-
Design a Java payroll program that prompts the user to enter an employee's hourly pay rate and the number of hours worked. Validate the user's input so that only the pay rates in the range of $7.50...
-
Based on Exhibits 5 and 6, the value of the lower one-period forward rate is closest to: A. 3.5122%. B. 3.5400%. C. 4.8037%. Meredith Alvarez is a junior fixed-income analyst with Canzim Asset...
-
A supply of 500 plasma television displays has 6 defective displays. What is the probability that a display picked at random from the supply is not defective?
-
Rolling-ball viscometer, an approximate analysis of the rolling-ball experiment has been given, in which the results of Problem 2B.3 are used? Read the original paper and verify the results.
-
Ki Corp. is in liquidation under Chapter 7 of the Federal Bankruptcy Code. The bankruptcy trustee has established a new set of books for the bankruptcy estate. After assuming custody of the estate,...
-
Selected accounts for Brianna??s Salon are presented below. All June 30 postings are from closing entries.Instructions(a) Prepare the closing entries that were made.(b) Post the closing entries to...
-
10.21 Estimate the hydrogen-burning lifetimes of stars near the lower and upper ends of the main sequence. The lower end of the main sequence 2 occurs near 0.072 Mo, with log10 Te = 3.23 and log 10...
-
2. The Global Tea and Organic Juice companies have merged. The following information has been collected for the "Consolidation Project." Chapter 7 Managing Risk 245 Activity Description Predecessor a...
-
A steel rotating-beam test specimen has an ultimate strength of 1100 MPa. Estimate the fatigue strength corresponding to a life of 141313 cycles of stress reversal. Give your answer to 3 significant...
-
If the price of a good increases 1 percent, and quantity supplied increases 2 percent, then the supply of the good is: a. elastic b. inelastic c. unitary elastic d. cannot tell from the information...
-
The market supply curve is: a. the MC curve above the minimum ATC b. the horizontal summation of all individual firm supply curves c. the vertical summation of all individual firm supply curves d....
-
The Law of Supply states that: a. producers will always maximize profits b. the price of a good and quantity supplied have a positive relationship c. supply equals demand d. the Law of Diminishing...
-
When a system contains regions that differ in physical structure or chemical composition, an overall value can be assigned to its properties. Consider the system, system 1, shown below. It contains...
-
An elasticity measures: a. how prices affect inflation b. the Law of Supply c. how economics influences the stock markets d. how responsive one variable is to another variable
-
Determine whether the one-off lump-sum will be treated as income or capital.
-
Use Allison Shannon's bank statement and check register to reconcile her account. Allison Shannon 3 Honey Drive Dallas, TX 75372 ACCOUNT NUMBER: 76574709A STATEMENT PERIOD: 12101 12/31 STARTING...
-
What was the approximate net change from April 29 to April 30? Express that net change as a monetary amount and as a percent to the nearest tenth. WPO Daily - 695 690 685 680 675 670 665 660 655 650...
-
Maria is a stock broker and has been following transactions for Ford Motor Co (F). On Tuesday, the last trade of the day for Ford was posted on the ticker as $8.11. On Wednesday, the last trade of...
-
What are the values of the feathering parameters for the airfoils given by Examples 8.5 and 8.6? Examples 8.5 Assume an airfoil pitching about its leading edge and plunging with \(k=0.35\) as follows...
-
Obtain the lift and propulsive force coefficients of an airfoil given in Example 8.6, and compare the results with Problem 8.30. Assume the profile pitches about midchord. Example 8.6 The NACA 0012...
-
Find the heat transfer rate \(\mathrm{q}_{\mathrm{w}}\) at \(\mathrm{x}=10 \mathrm{~cm}\) and \(100 \mathrm{~cm}\) for the flat plate given in Problem 7.31. Problem 7.31 A flat plate of \(4...

Study smarter with the SolutionInn App