

Figure 1 provides a Gantt Chart with scheduled activities on a 3-year National Youth Employment Project in
Fantastic news! We've Found the answer you've been seeking!
Question:
Figure 1 provides a Gantt Chart with scheduled activities on a 3-year National Youth Employment Project in Ghana. The project has three major components out of which a detailed schedule has been prepared on a Gantt Chart. You are required to use Figure 1 to address the following questions:
(a) What is the significance of the thick black lines corresponding to the project components in scheduling the National Youth Employment Project?
(b) Critically examine Figure 1 and explain the weakness in the Gantt Chart which can affect the correct determination of critical activities on the National Youth Employment Project.
(c) Explain how you will monitor and control the National Youth Employment Project activities 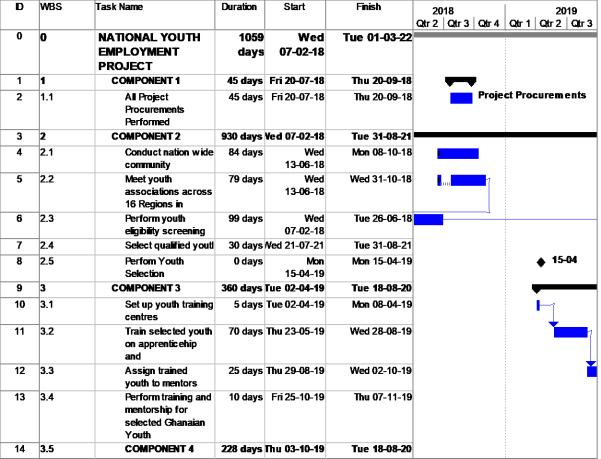
Expert Answer:
a The thick black lines are showing the duration of the individual components As we can see Component 1 has a duration of 45 days Component 2 has a du... View the full answer

Related Book For 

Posted Date:
