

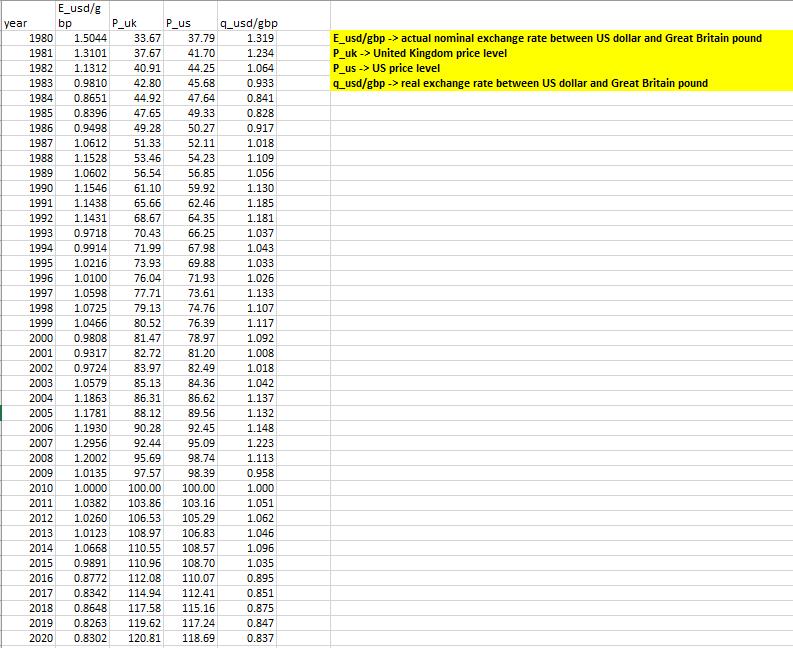
The Excel workbook titled 'nominal_exrate.xlsx' contains the data set on the ac- tual nominal exchange rate...
Fantastic news! We've Found the answer you've been seeking!
Question:
Expert Answer:
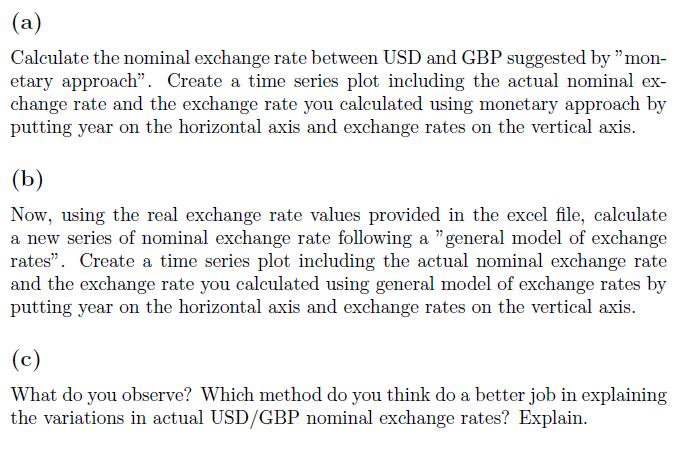
a To calculate the nominal exchange rate between USD and GBP suggested by the monetary approachwe can use the following equation Eusdgbp Musd Puk Mgbp Pus where Eusdgbp is the nominal exchange rate be... View the full answer

Related Book For 

Statistics Unlocking the Power of Data
ISBN: 978-1118583104
1st edition
Authors: Robin H. Lock, Patti Frazer Lock, Kari Lock Morgan, Eric F. Lock, Dennis F. Lock
Posted Date:
