

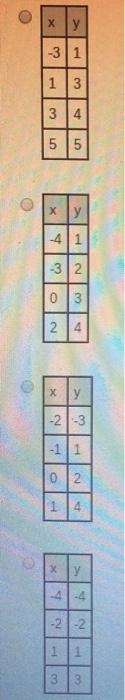
Select the table that represents the following graph. YA 4 3. 22 1. -4 -3 -2...
Fantastic news! We've Found the answer you've been seeking!
Question:

Expert Answer:

Posted Date:
