

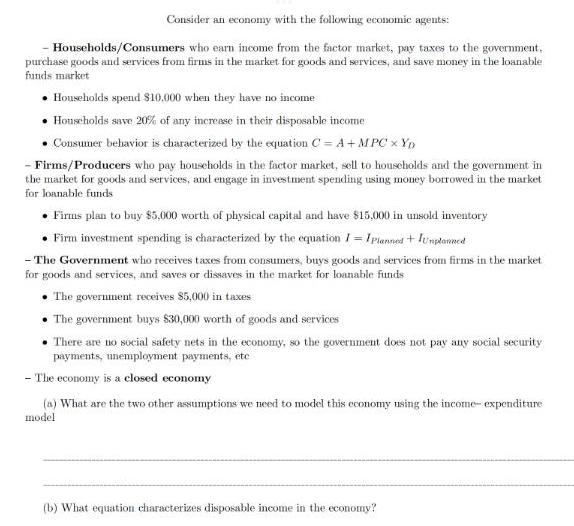
Consider an economy with the following economic agents: -Households/Consumers who earn income from the factor market,...
Fantastic news! We've Found the answer you've been seeking!
Question:
Expert Answer:
a The two other assumptions needed are No importexports the economy is close... View the full answer

Related Book For 
Macroeconomics
ISBN: 978-1464168505
5th Canadian Edition
Authors: N. Gregory Mankiw, William M. Scarth
Posted Date:
