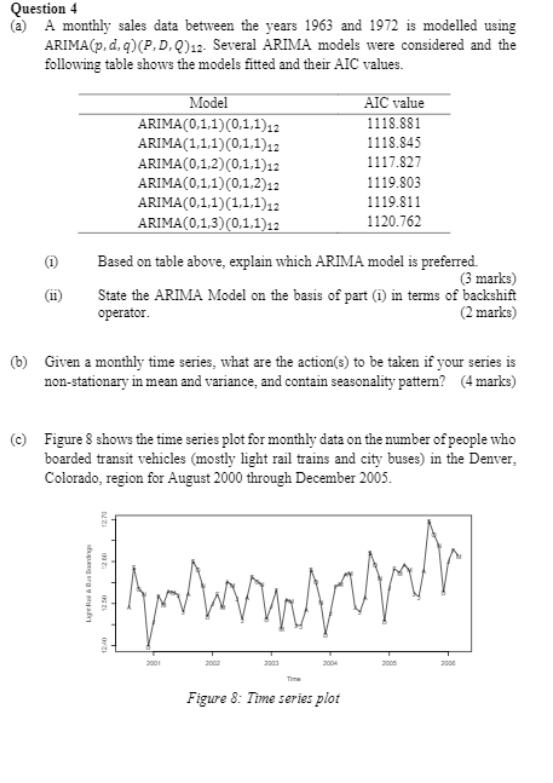
Question 4 (a) A monthly sales data between the years 1963 and 1972 is modelled using...
Fantastic news! We've Found the answer you've been seeking!
Question:
Transcribed Image Text:
Question 4 (a) A monthly sales data between the years 1963 and 1972 is modelled using ARIMA(p, d, q)(P, D, Q)12. Several ARIMA models were considered and the following table shows the models fitted and their AIC values. Model AIC value 1118.881 ARIMA(0,1.1)(0,1,1)12 1118.845 ARIMA(1,1.1)(0,1.1)12 ARIMA(0,1,2)(0,1,1)12 ARIMA(0.1,1)(0,1,2)12 ARIMA(0,1.1)(1,1,1)12 ARIMA(0,1,3)(0,1.1)12 1117.827 1119.803 1119.811 1120.762 Based on table above, explain which ARIMA model is preferred. (3 marks) State the ARIMA Model on the basis of part (i) in terms of backshift (2 marks) operator. (b) Given a monthly time series, what are the action(s) to be taken if your series is non-stationary in mean and variance, and contain seasonality patten? (4 marks) (c) Figure 8 shows the time series plot for monthly data on the number of people who boarded transit vehicles (mostly light rail trains and city buses) in the Denver, Colorado, region for August 2000 through December 2005. 2001 2003 2004 200n 200 Time Figure 8: Time series plot g era a Figure 9: ACF plot call: arina(x- series, order - cco, 0. 3), seasonal - list(order - c(1. 0, o). period - 12)) Coeftictents: sarl intercept 12. 5455 nal ma2 ma 0.7290 0.6116 0. 2950 0.S776 s.e. 0.1186 0.1172 0.1118 0.0507 0.0354 sigra2 estimated as 0.0006542: log 1ikelihood - 143.54, atc - -277.09 na3 7.812049e-10 1.795464e-07 8.315644e-03 0.000000e-00 0.00000e-00 > (1-pnorn(abs (nodelscoef)/sqrt (diag(nodelsvar.coef))))"2 sari nal ma2 intercept Figure 10: Summary output of ARIMA (0,0,3)(1.0.0)12 model fiting Call: arina(x = series, order - cco, o, 4), seasonal - 11stcorder - ca, 0, 0), period - 12)) Coefficients: nal na3 0.7277 0.6686 0.4244 0.1414 0.0918 s.. 0.1212 0. 1327 0. 1681 0. 1228 0.0445 na2 sarl intercept 12.5459 na4 0. 0419 signan2 estinated as 0.0006279: Tog 1ikelihaod = 144.22. sic = -276.45 > (1-pnere(abs (mede125coef)/sqrt(diag(rode125var.coef)))) 2 nal 1.924940e-09 4.718877e-07 1.15738se-02 2.495349e-01i 0.000000e-00 0.000000e-00 nal ma2 ma4 sarl intercept Figure 11: Summary output of ARIMA(0,0.4)(1,0.0)12 model fitting (1) Describe the time plot. Does a stationary model seem reasonable? (4 marks) Figure 9 gives the ACP plot for this series. At which lags do you have (2 marks) ARIMA(0,0,3)(1.0.0)12 model are fitted to these data. The summary output of model fitting is shown in Figure 10. Assess the significance of (2 marks) How to determine that the ARIMA (0,0.3)(1.0.0)42 model is a good (4 marks) Overfit the data with ARIMA (0,0,4)(1,0,0)12 model. The summary output of model fitting is shown in Figure 11. Interpret the results. (4 marks) [Total : 25 Marks] (ii) significant autocorrelation? (ii) the estimated coefficients. (iv) forecasting model? (v) Question 4 (a) A monthly sales data between the years 1963 and 1972 is modelled using ARIMA(p, d, q)(P, D, Q)12. Several ARIMA models were considered and the following table shows the models fitted and their AIC values. Model AIC value 1118.881 ARIMA(0,1.1)(0,1,1)12 1118.845 ARIMA(1,1.1)(0,1.1)12 ARIMA(0,1,2)(0,1,1)12 ARIMA(0.1,1)(0,1,2)12 ARIMA(0,1.1)(1,1,1)12 ARIMA(0,1,3)(0,1.1)12 1117.827 1119.803 1119.811 1120.762 Based on table above, explain which ARIMA model is preferred. (3 marks) State the ARIMA Model on the basis of part (i) in terms of backshift (2 marks) operator. (b) Given a monthly time series, what are the action(s) to be taken if your series is non-stationary in mean and variance, and contain seasonality patten? (4 marks) (c) Figure 8 shows the time series plot for monthly data on the number of people who boarded transit vehicles (mostly light rail trains and city buses) in the Denver, Colorado, region for August 2000 through December 2005. 2001 2003 2004 200n 200 Time Figure 8: Time series plot g era a Figure 9: ACF plot call: arina(x- series, order - cco, 0. 3), seasonal - list(order - c(1. 0, o). period - 12)) Coeftictents: sarl intercept 12. 5455 nal ma2 ma 0.7290 0.6116 0. 2950 0.S776 s.e. 0.1186 0.1172 0.1118 0.0507 0.0354 sigra2 estimated as 0.0006542: log 1ikelihood - 143.54, atc - -277.09 na3 7.812049e-10 1.795464e-07 8.315644e-03 0.000000e-00 0.00000e-00 > (1-pnorn(abs (nodelscoef)/sqrt (diag(nodelsvar.coef))))"2 sari nal ma2 intercept Figure 10: Summary output of ARIMA (0,0,3)(1.0.0)12 model fiting Call: arina(x = series, order - cco, o, 4), seasonal - 11stcorder - ca, 0, 0), period - 12)) Coefficients: nal na3 0.7277 0.6686 0.4244 0.1414 0.0918 s.. 0.1212 0. 1327 0. 1681 0. 1228 0.0445 na2 sarl intercept 12.5459 na4 0. 0419 signan2 estinated as 0.0006279: Tog 1ikelihaod = 144.22. sic = -276.45 > (1-pnere(abs (mede125coef)/sqrt(diag(rode125var.coef)))) 2 nal 1.924940e-09 4.718877e-07 1.15738se-02 2.495349e-01i 0.000000e-00 0.000000e-00 nal ma2 ma4 sarl intercept Figure 11: Summary output of ARIMA(0,0.4)(1,0.0)12 model fitting (1) Describe the time plot. Does a stationary model seem reasonable? (4 marks) Figure 9 gives the ACP plot for this series. At which lags do you have (2 marks) ARIMA(0,0,3)(1.0.0)12 model are fitted to these data. The summary output of model fitting is shown in Figure 10. Assess the significance of (2 marks) How to determine that the ARIMA (0,0.3)(1.0.0)42 model is a good (4 marks) Overfit the data with ARIMA (0,0,4)(1,0,0)12 model. The summary output of model fitting is shown in Figure 11. Interpret the results. (4 marks) [Total : 25 Marks] (ii) significant autocorrelation? (ii) the estimated coefficients. (iv) forecasting model? (v)
Expert Answer:
Answer rating: 100% (QA)
1 Based on table above explain which ARIMA model is preferred The ARIMA model that is preferred is the ARIMA 11101112 model as it has the lowest AIC value at 1117827 The AIC value is used to compare d... View the full answer
Related Book For
Posted Date:
Students also viewed these mathematics questions
-
Table 8.22 shows fitted values for models for four-way tables that have direct estimates. a. Use Birchs results to verify that the entry is correct for (W, X, Y, Z). Verify its residual df. b....
-
The following model was fitted to observations from 1972 to 1979 in an attempt to explain oil-pricing behavior: Where y` = difference between price in the current year and price in the previous year,...
-
Sean has taken over his fathers home loans business, Auzzie Loans Pty Ltd. There are three directors (Sean and his parents), who are also members of the company. When the global financial crisis hit,...
-
North Folk Dairy has an unused bank revolving credit of $50 million. North Folk Dairys vendor provided an invoice in the amount of $100,000 with payment terms of 2/10, net 45. Compute the nominal...
-
Identify the problem(s) in each of the residual plots shown on page 707. a. b. c. d. 3s 0 0 Relative frequency
-
Using the theoretical sampling strategy, how many samples of size 4 (n = 4) can be drawn from a population of size: (a) N = 5? (b) N = 8? (c) N = 16? (d) N = 50?
-
Harnischfeger Corporation was a mining machinery and equipment company based in Wisconsin. The company voluntarily changed its depreciation accounting policy from the accelerated method to the...
-
A firm has experienced an increasing current ratio but a decreasing operating cash flow to current liabilities ratio during the last three years. What is the likely explanation for these results?
-
(5 points) At the 0.05 significance level, test the null hypothesis that 1 is equal to 0 using Wald test in R. What is the value of the test statistic? What's the distribution of the test statistic...
-
Refer to the Bulletin of Marine Science (Apr. 2010) study of teams of fishermen fishing for the red spiny lobster in Baja California Sur, Mexico, Exercise 11.63 (p. 614). Recall that simple linear...
-
Use this chart to take notes from the lesson. You may also research from outside sources, however, be sure to cite these in MLA format. You must choose three different investments, one from each...
-
Snax Ltd. produces Splits Sunflower Seeds. The company held a contest to have customers come up with ideas for new flavours for this product. A winner was chosen, and a new tikka masala flavour is...
-
(1 Mark) Pops Corp manufactures wooden tables.Annual demand for their product is 100,000 units.The annual cost of carrying one unit in inventory is $2.No finished inventory was on hand at the...
-
XYZ is Limited Liability Retailer Company. The following transactions took place during 2019 financial year, ending 31 December 2019: The company injected cash in the company in the amount of...
-
If you purchase $1000 of goods and the terms are 2/10 Net 30. What is the discount amount if you pay before the end of the discount period?
-
The management accountant of a manufacturing company has been tasked to cost a one-off project for a customer. He is recommending to purchase a component part of the product rather than manufacture...
-
You may need to use the appropriate technology to answer this question. In an experiment designed to test the output levels of three different treatments, the following results were obtained: SST =...
-
Repeat the previous problem, but close the positions on September 20. Use the spreadsheet to find the profits for the possible stock prices on September 20. Generate a graph and use it to identify...
-
Conduct the analyses of Problem 4.6 on defects in the fabrication of computer chips, but use a negative binomial GLM. Compare results to those for the Poisson GLM. Indicate why results are similar....
-
Refer to the logit model in Problem 5.24. Let A = opinion on abortion. a. Give the symbol for the loglinear model that is equivalent to this logit model. b. Which logit model corresponds to loglinear...
-
Refer to Section 1.5.6. Using the likelihood function to obtain the information, find the approximate standard error of .
-
During 2019, Evans \& Sons, Inc., issued \(\$ 400\) million of zero-coupon bonds, due in 2026. The proceeds from the bond issuance were \(\$ 184.2\) million. Calculate the total interest expense that...
-
The Petaluma Daily Times Corporation (CDT) publishes a daily newspaper. A 52 -week subscription sells for \(\$ 260\). Assume that CDT sells 100 subscriptions on January 1. None of the subscriptions...
-
Clifford Company has just billed a customer for \(\$ 1,100\), an amount that includes an eight percent excise tax and a two percent state sales tax. a. What amount of revenue is recorded? b. Prepare...
Study smarter with the SolutionInn App