

Question: QUESTION 9 What effect will a decrease in demand combined with a increase in supply have on equiibrium price? The equilibrium price will increase. The


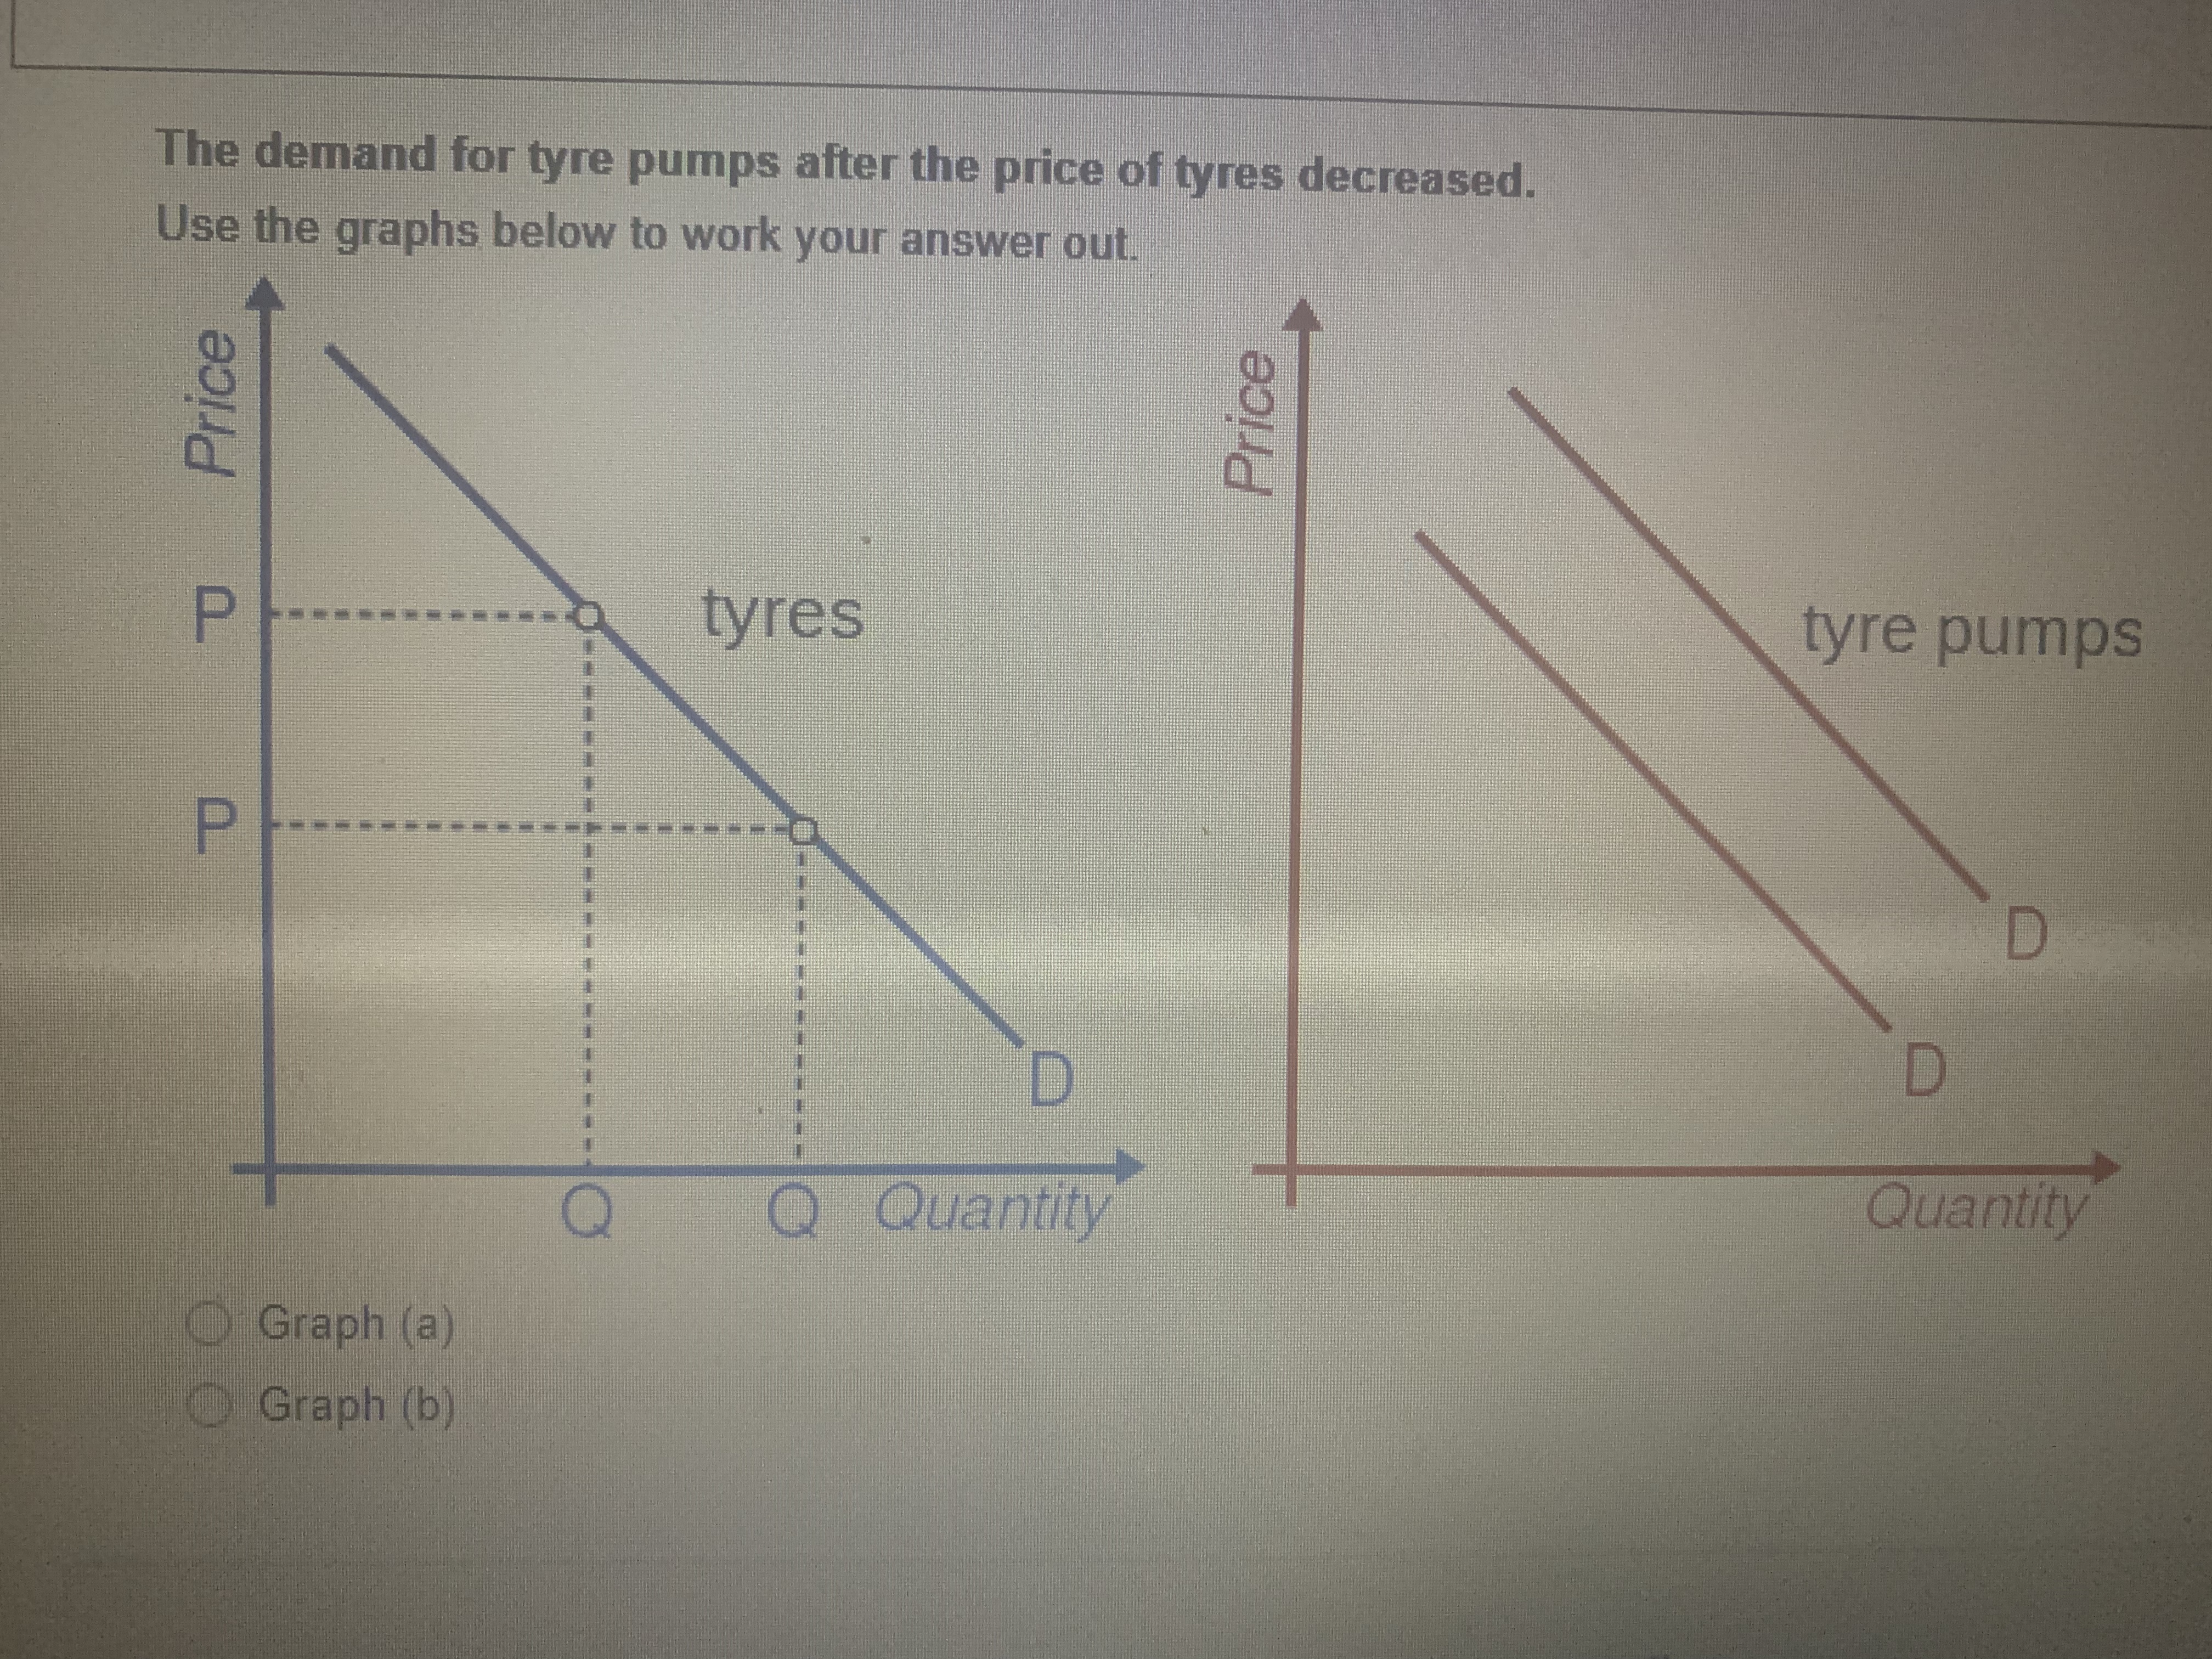
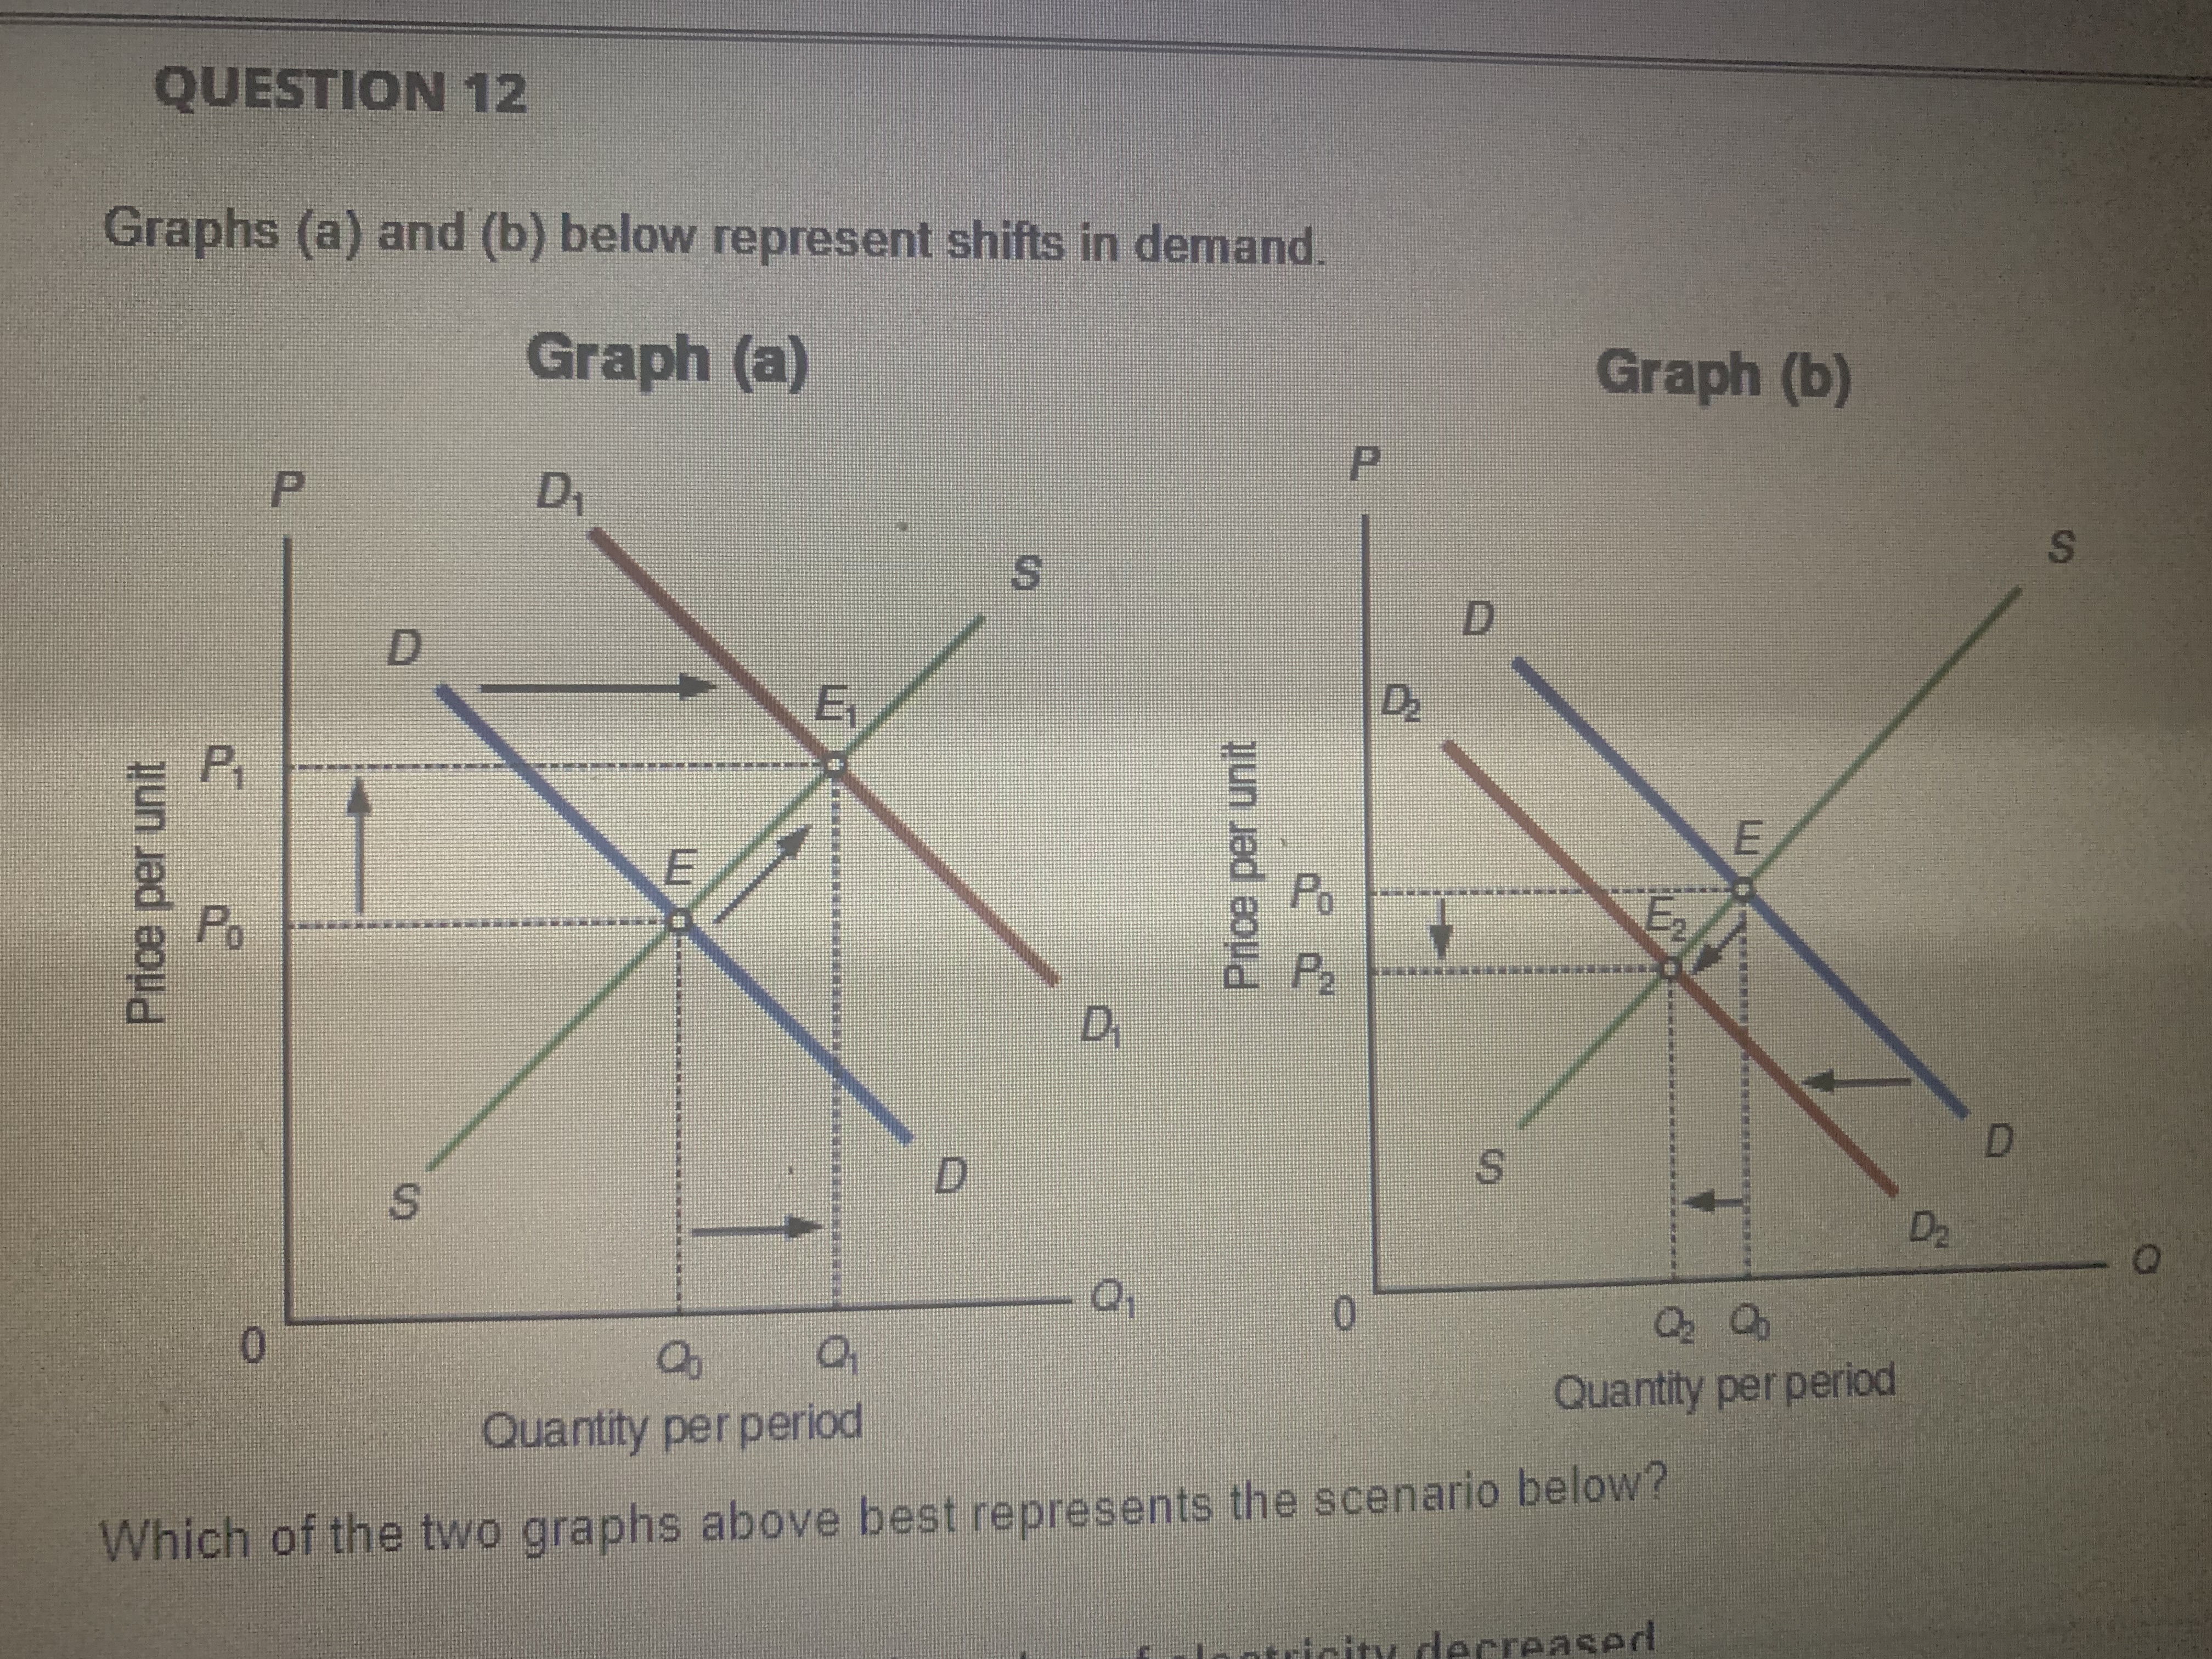


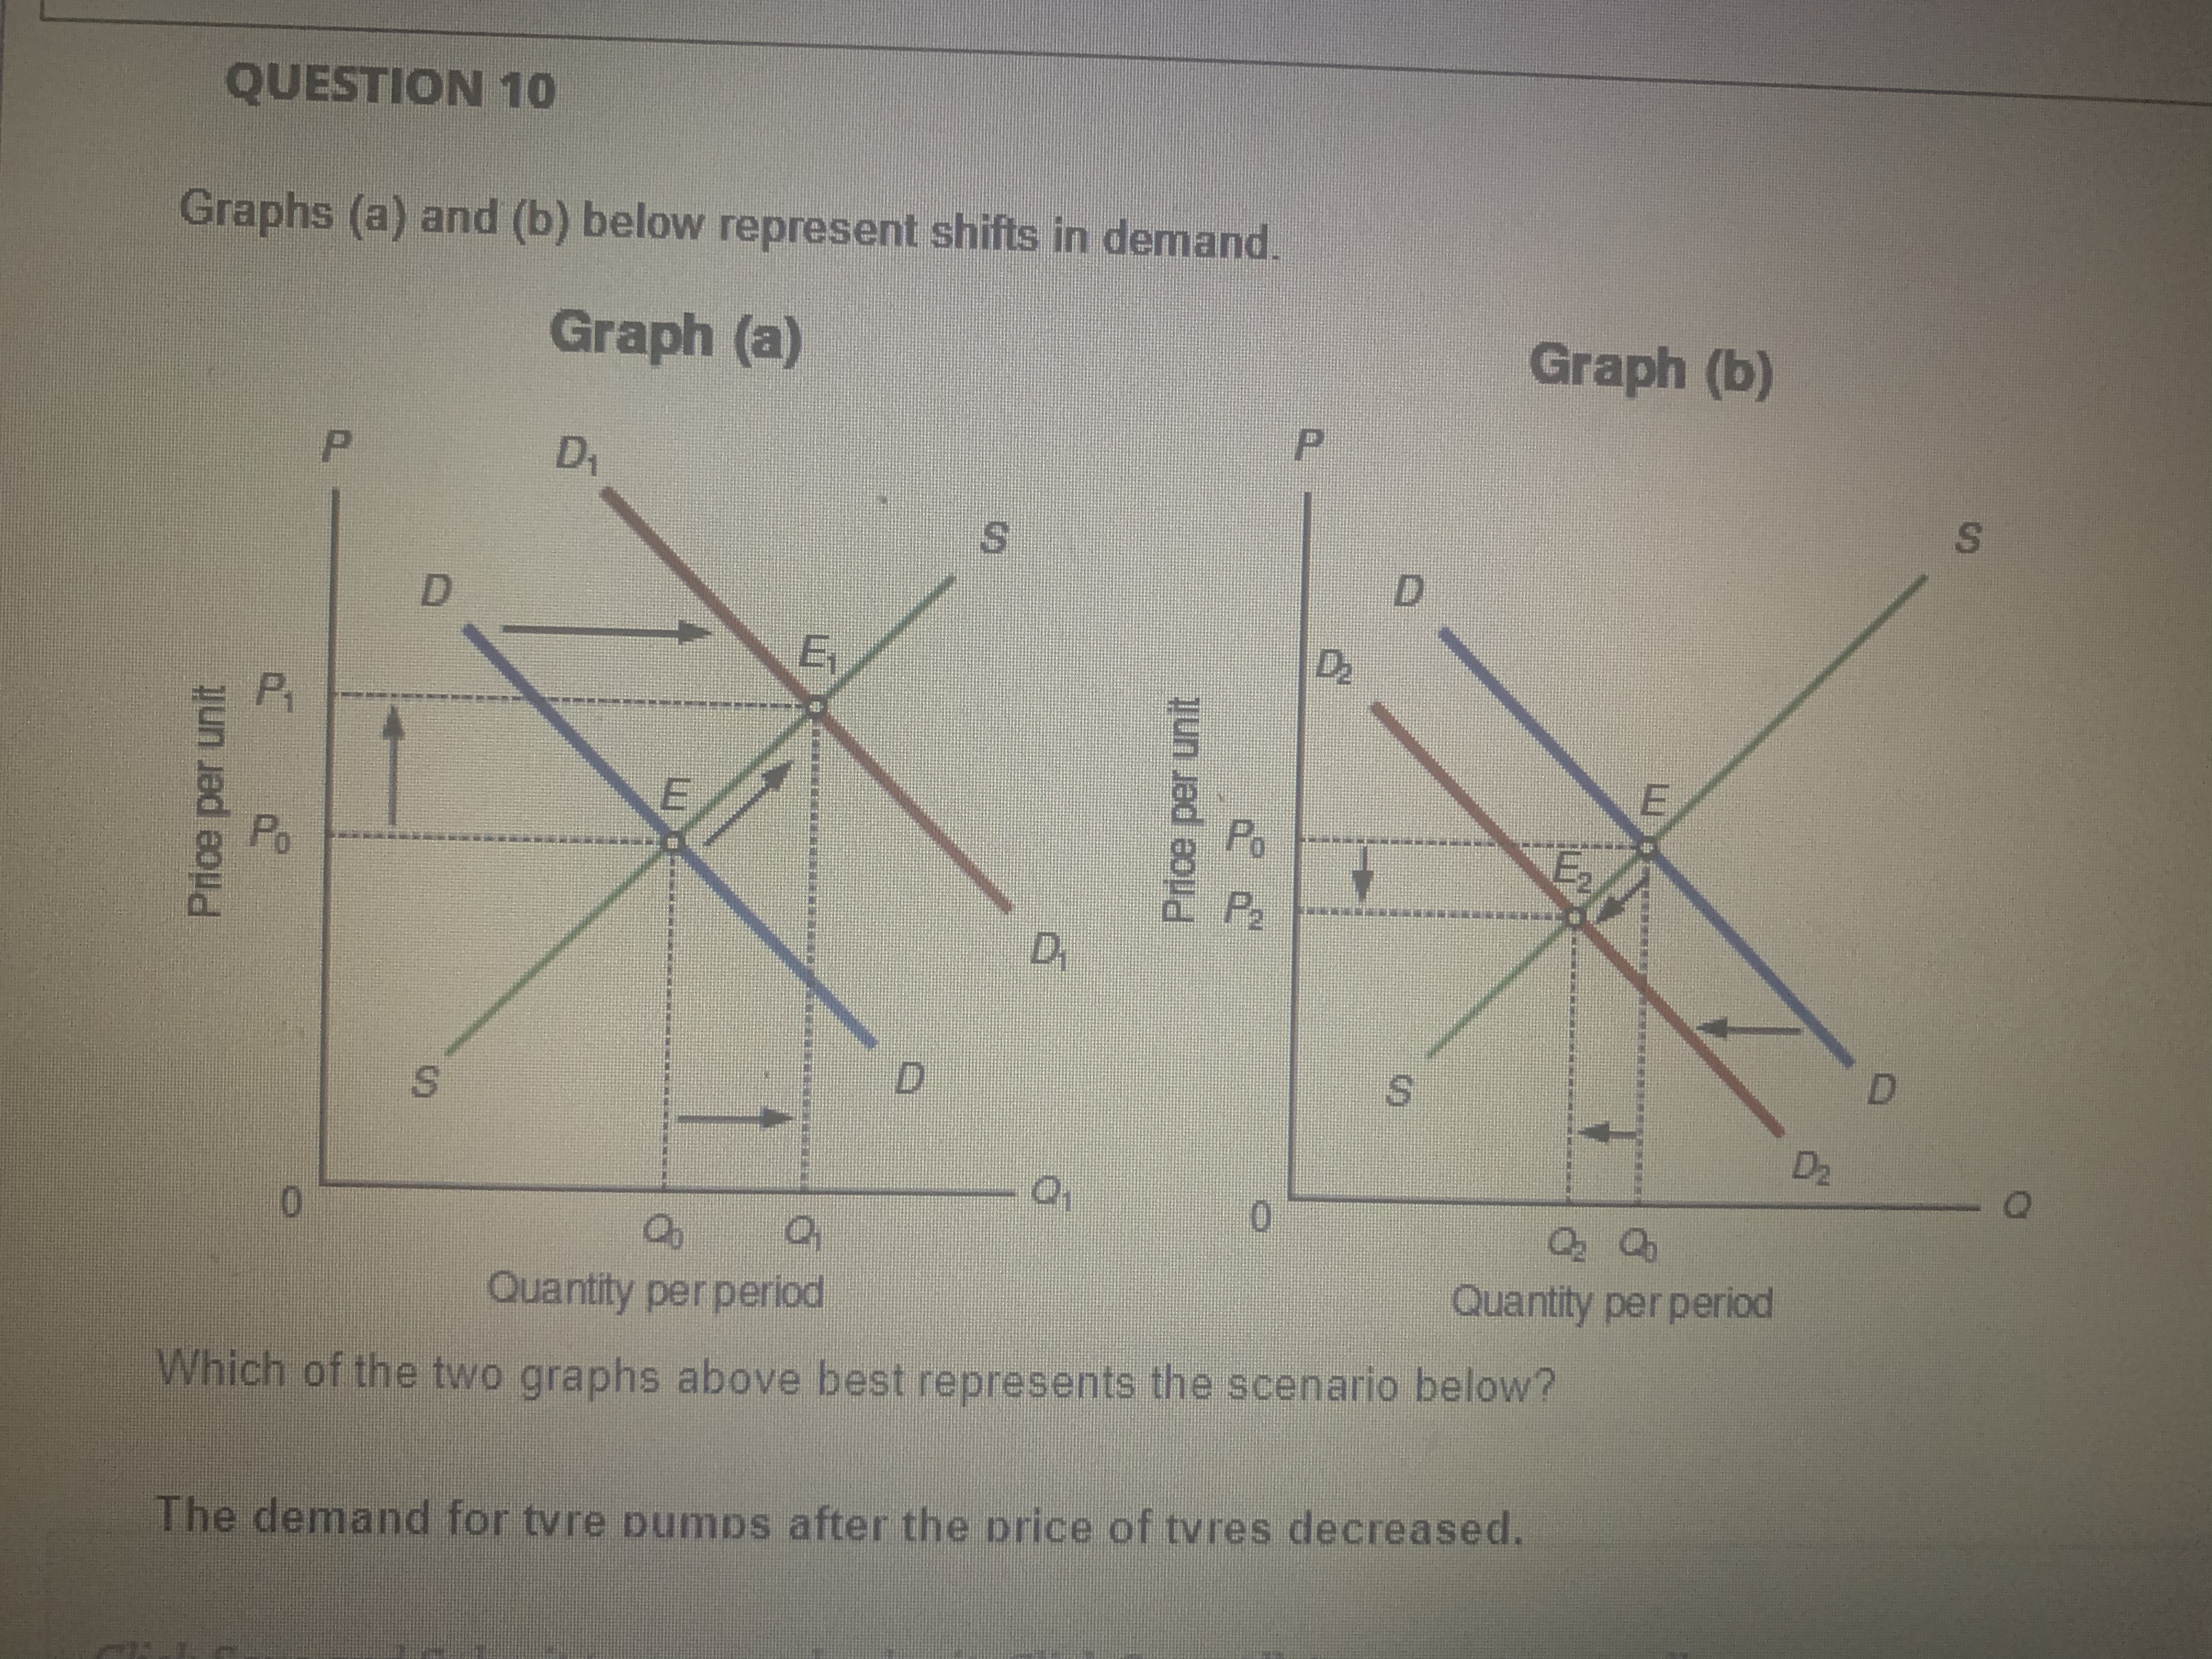
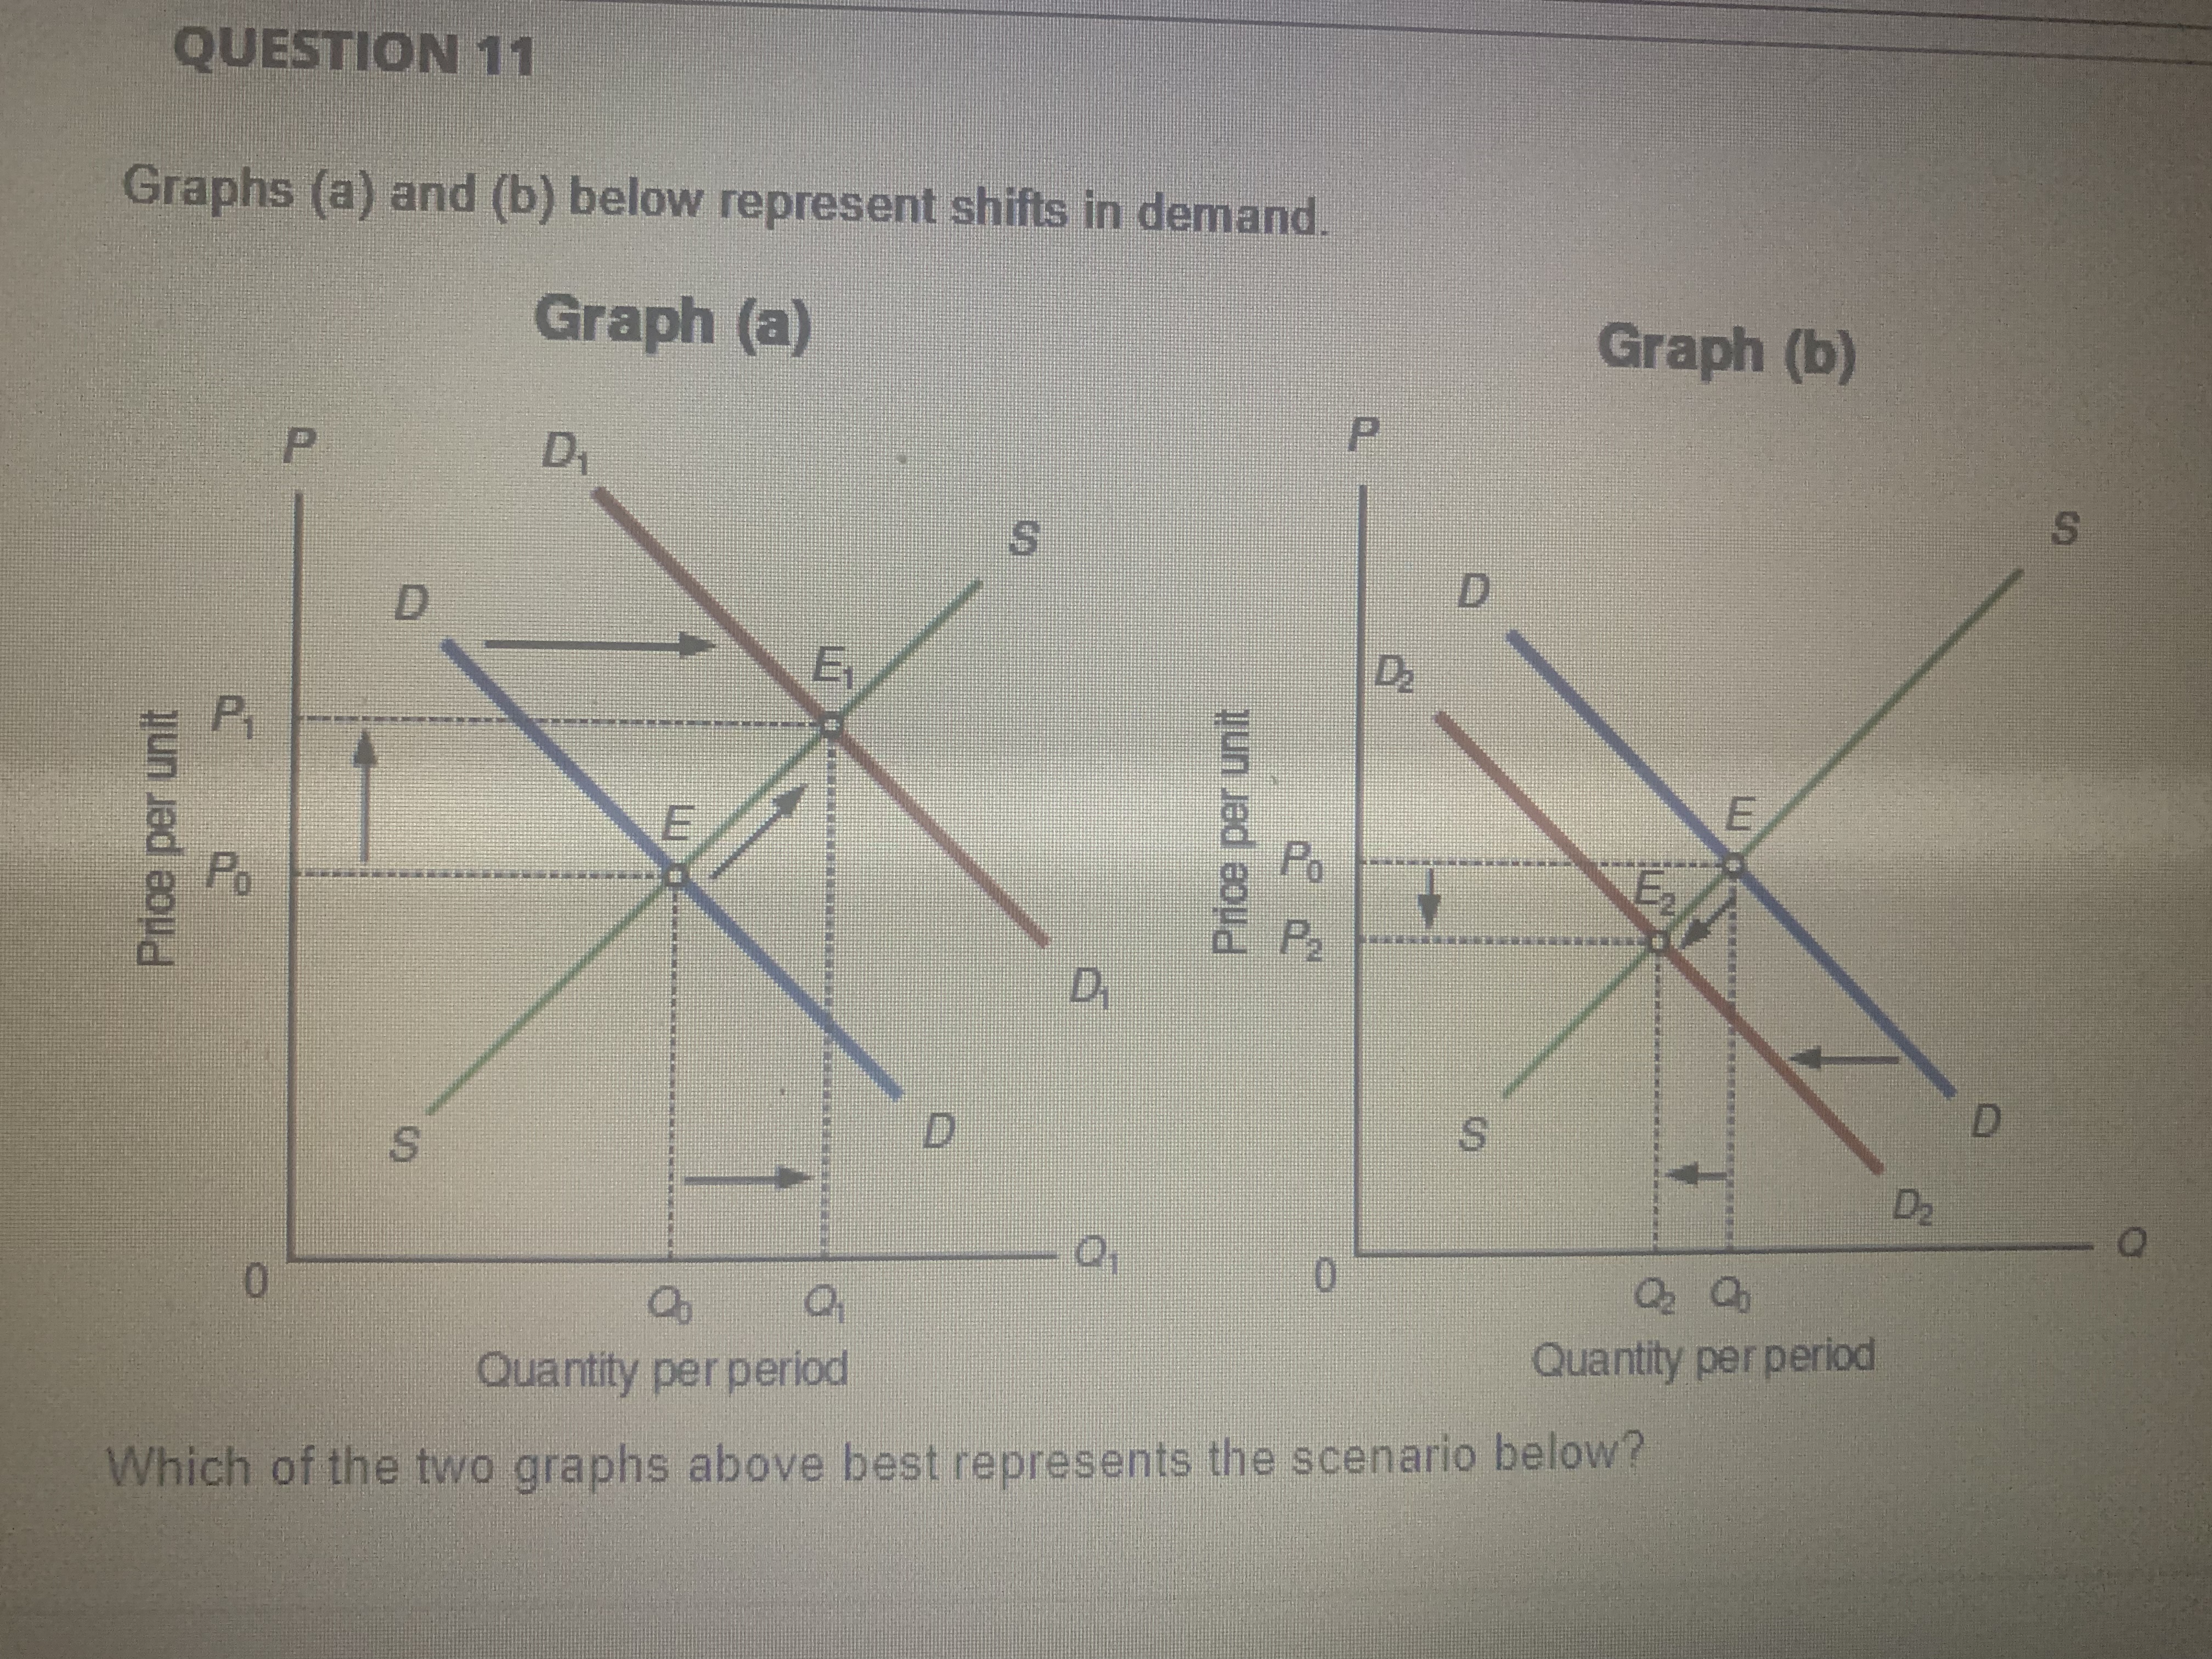
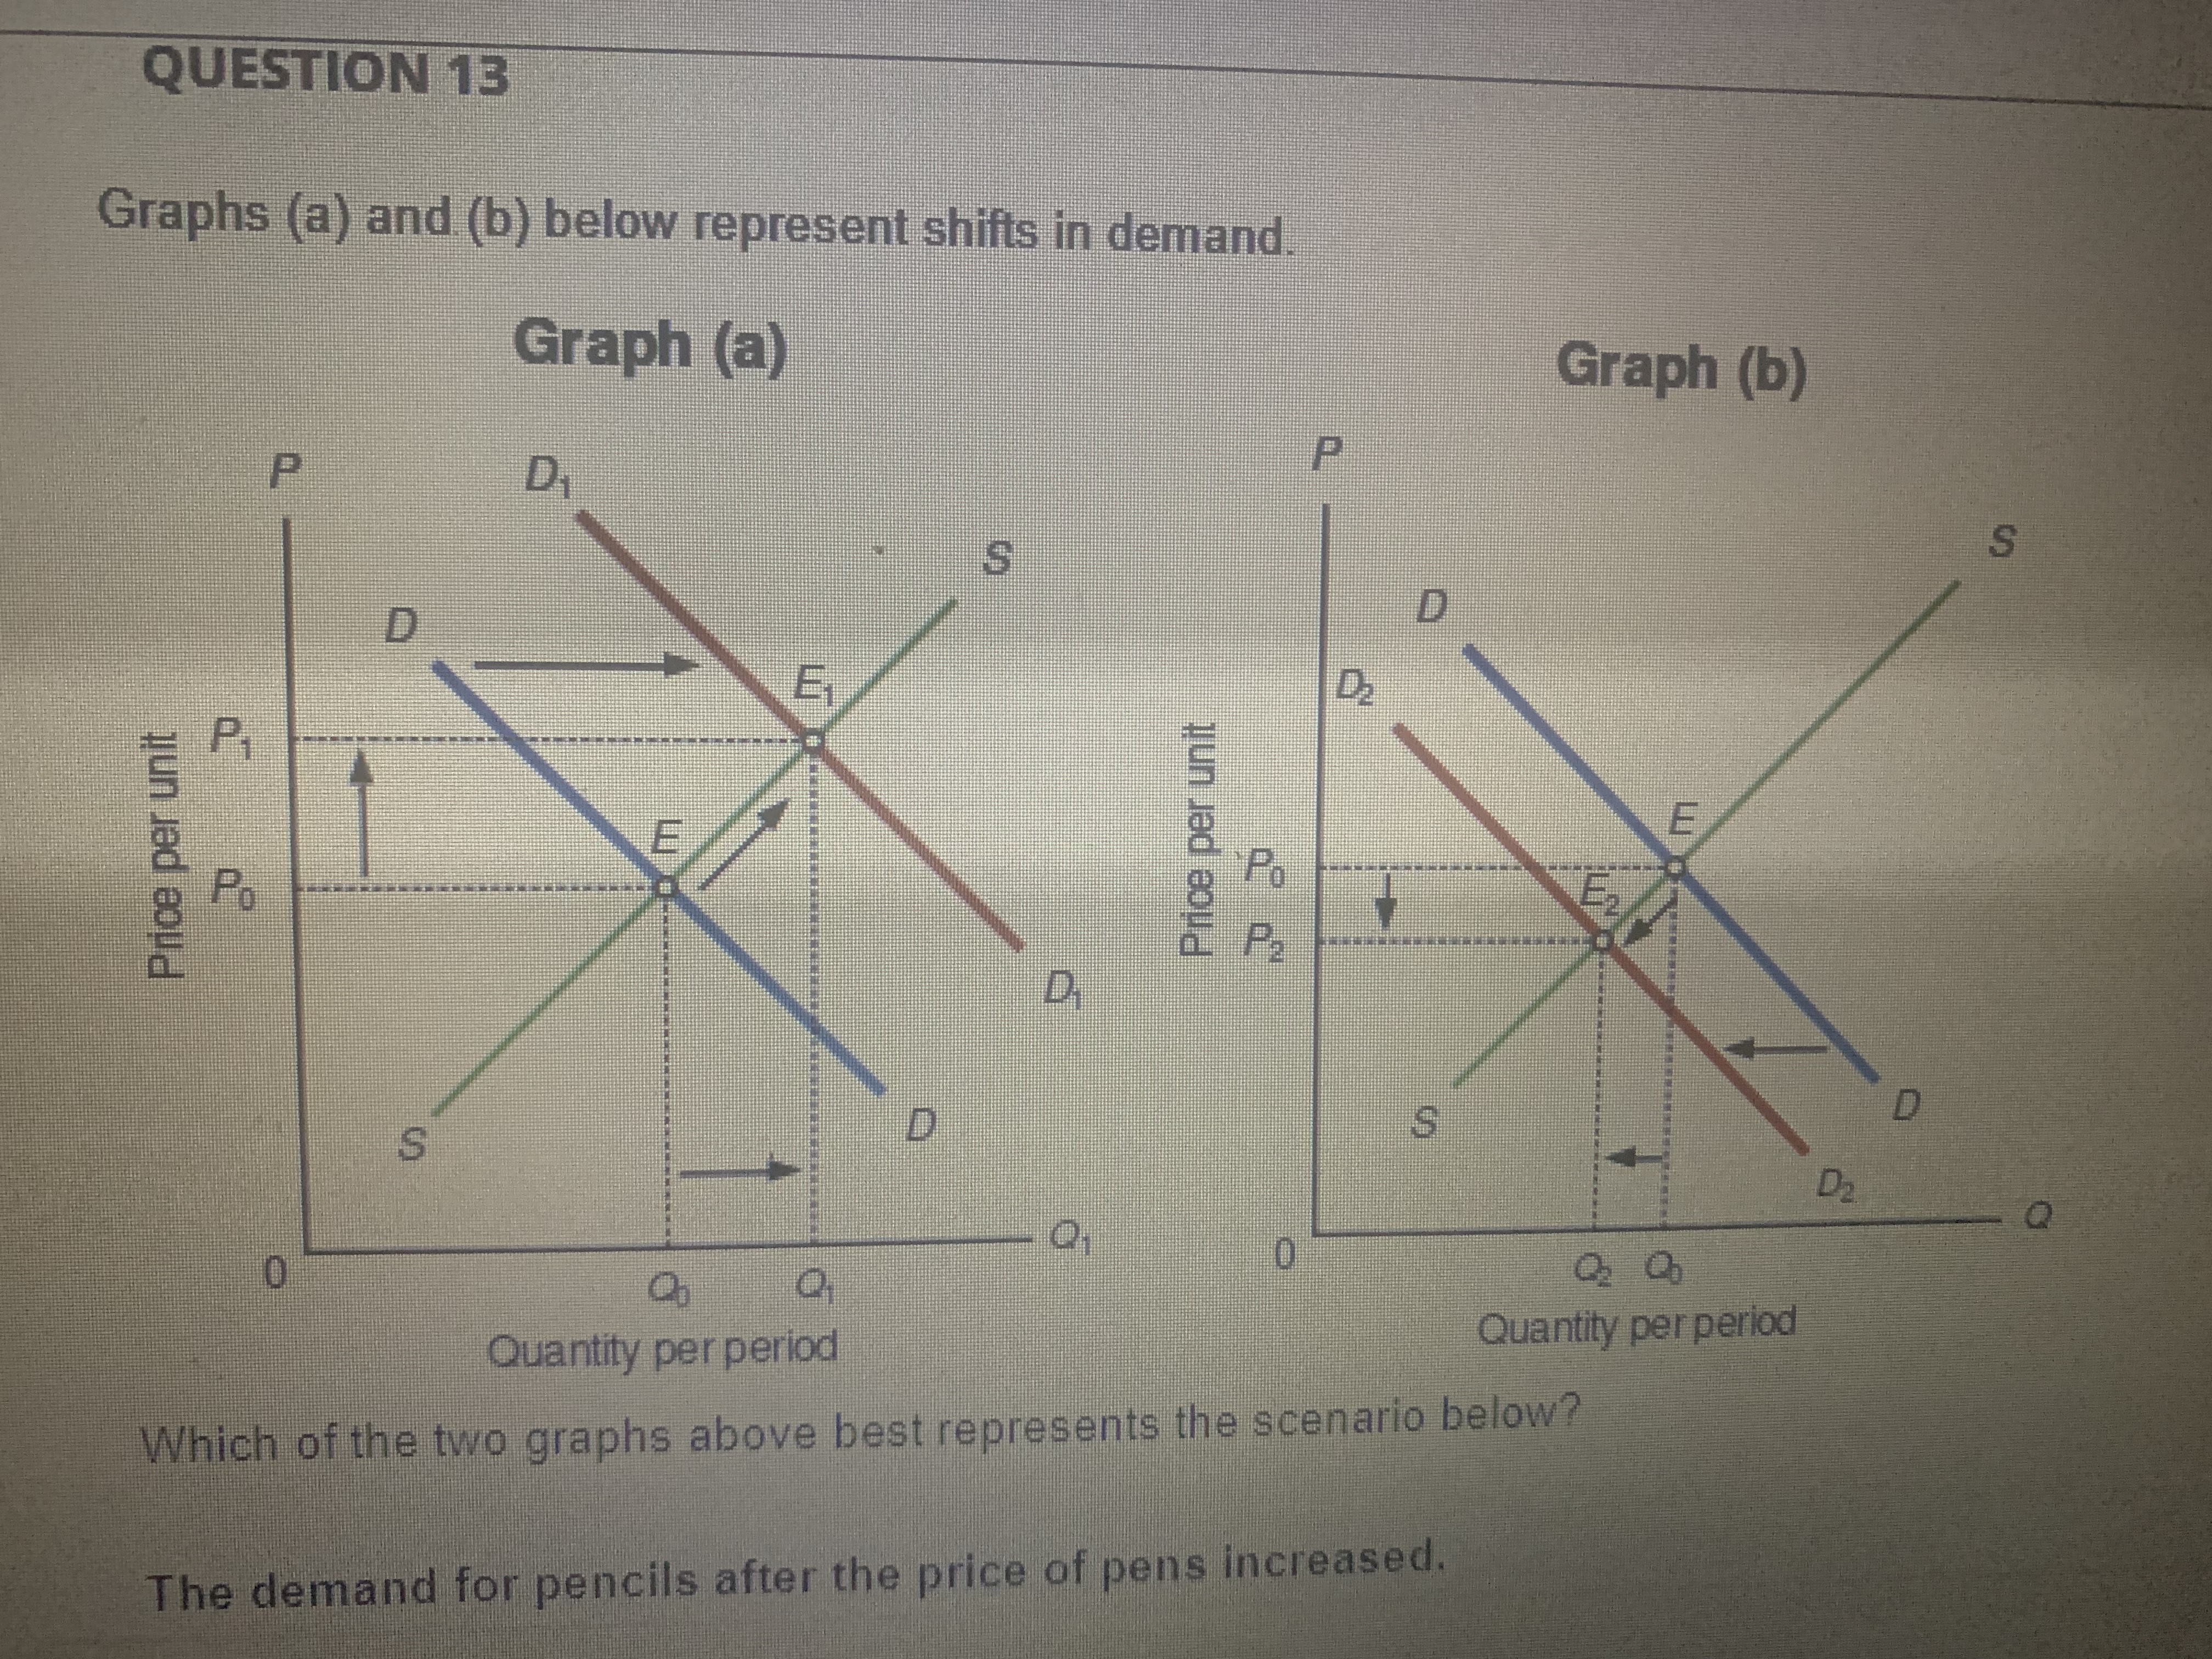
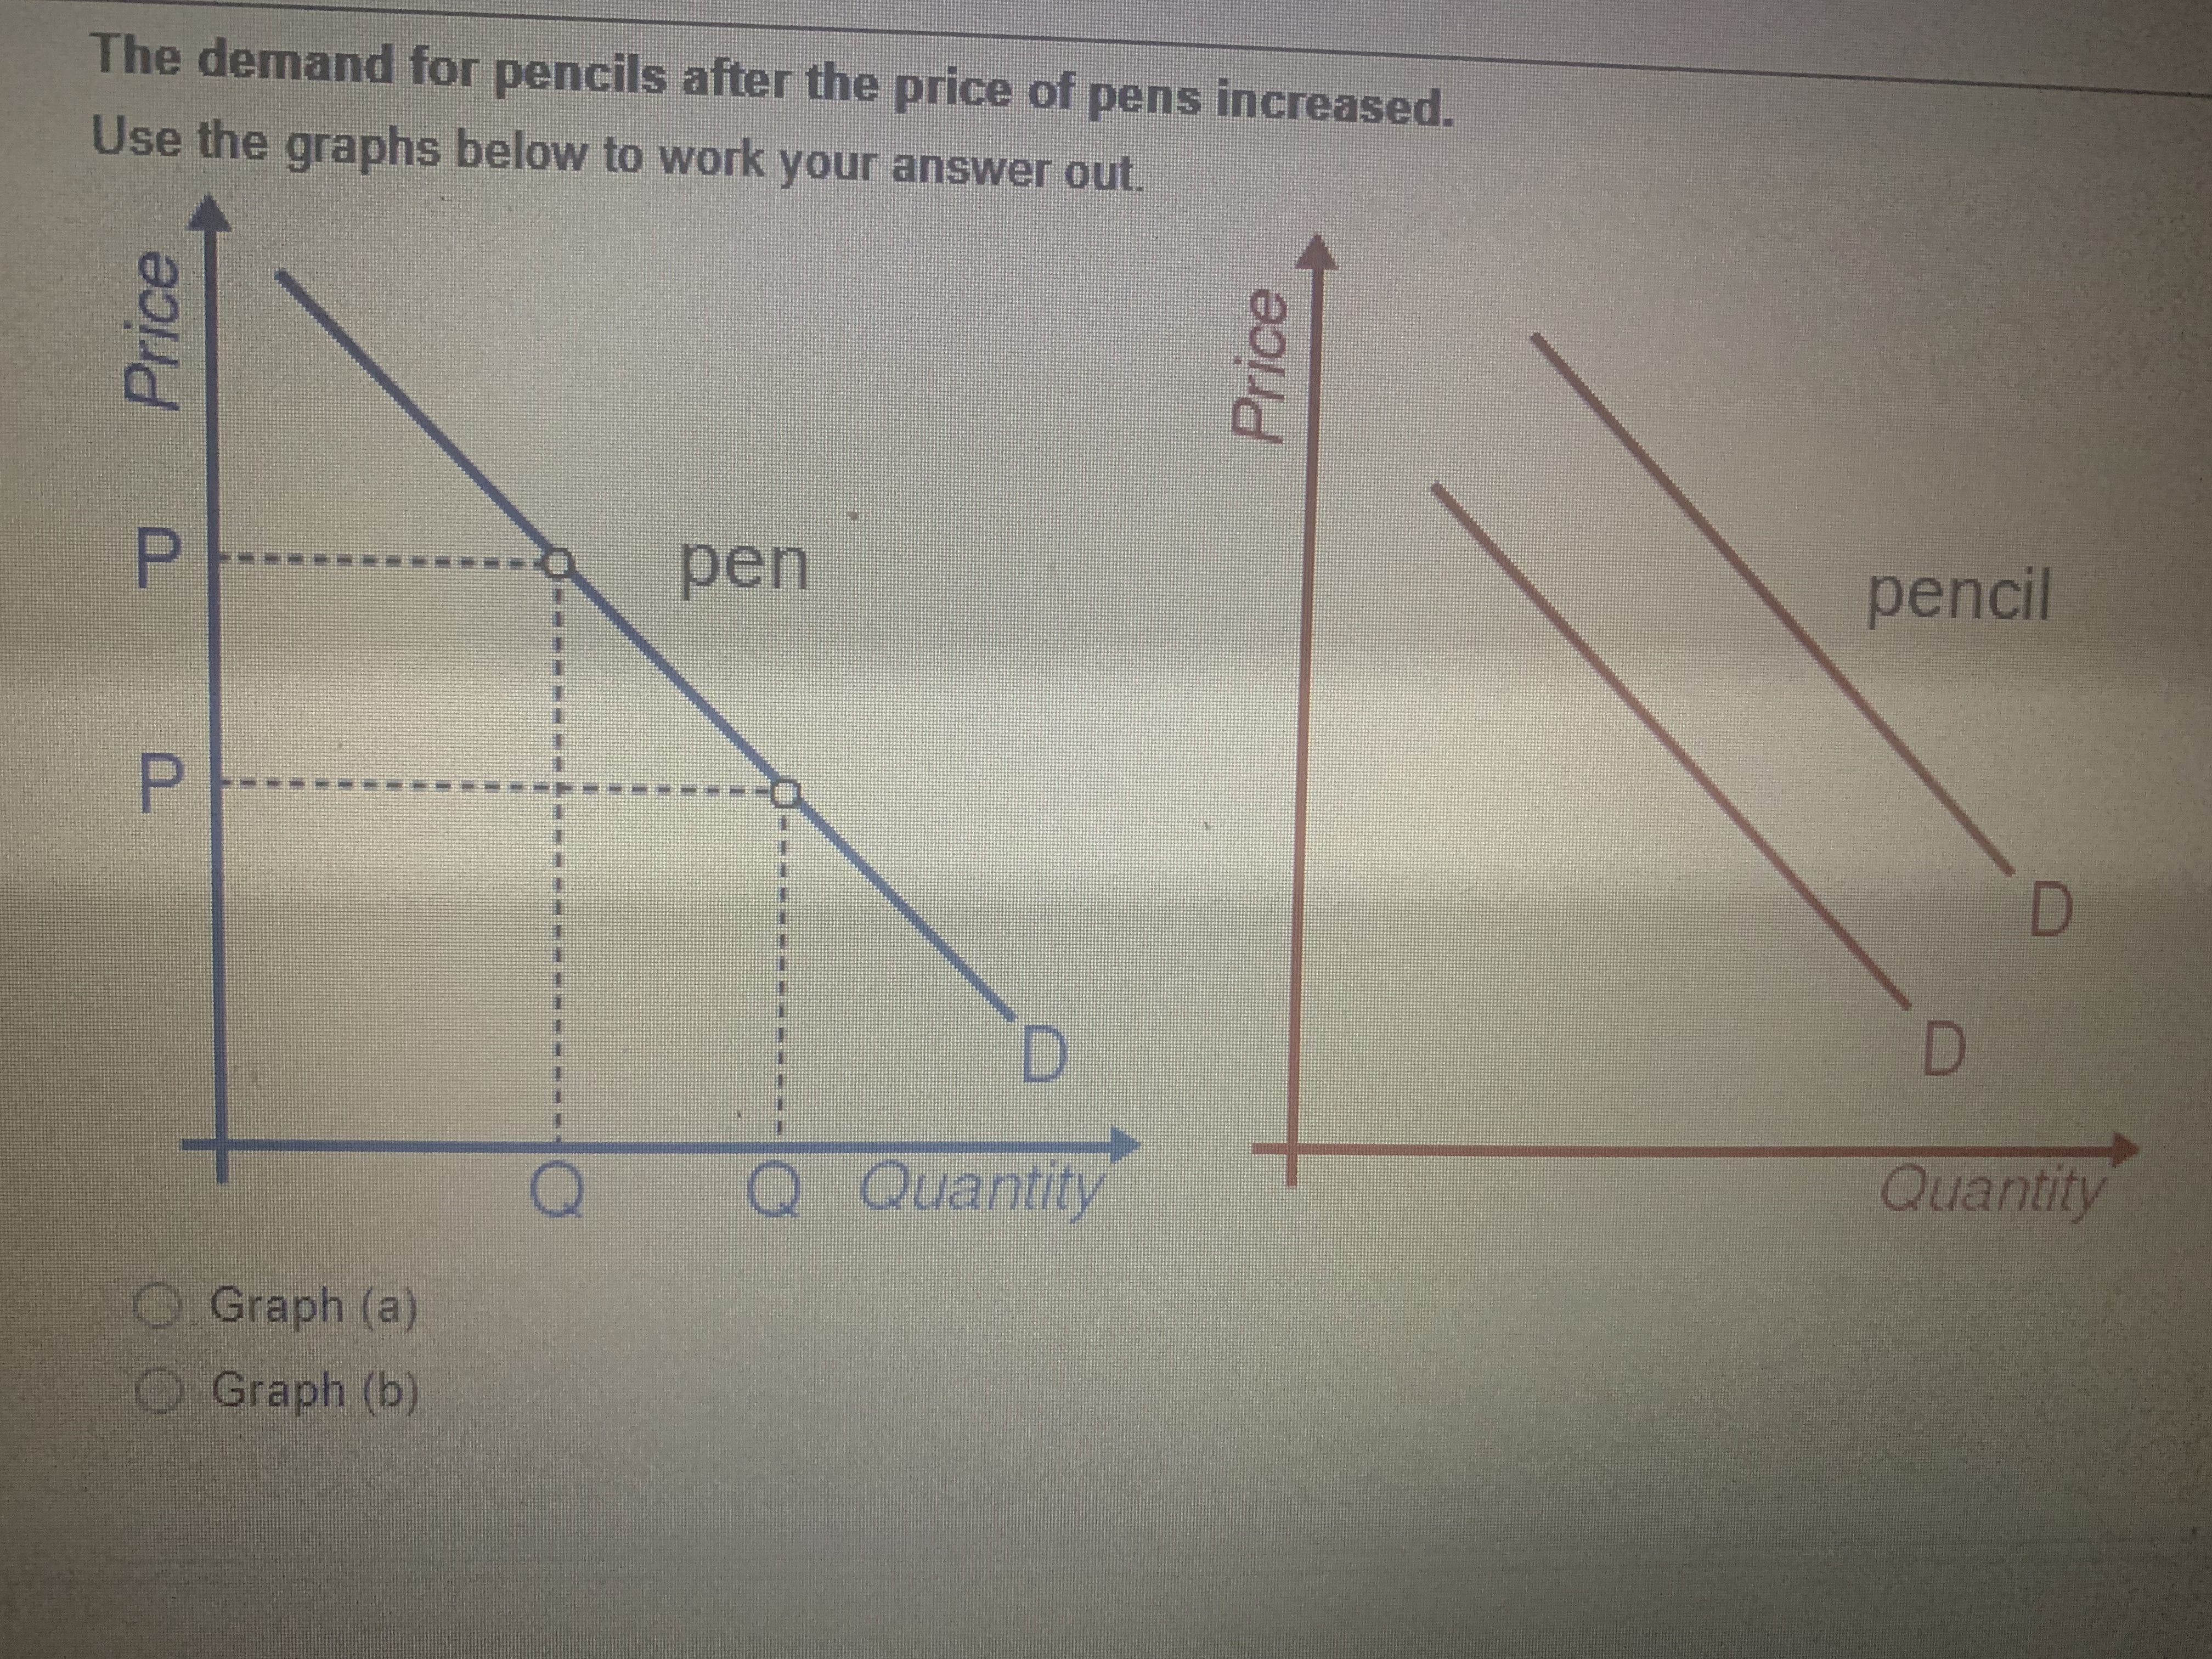
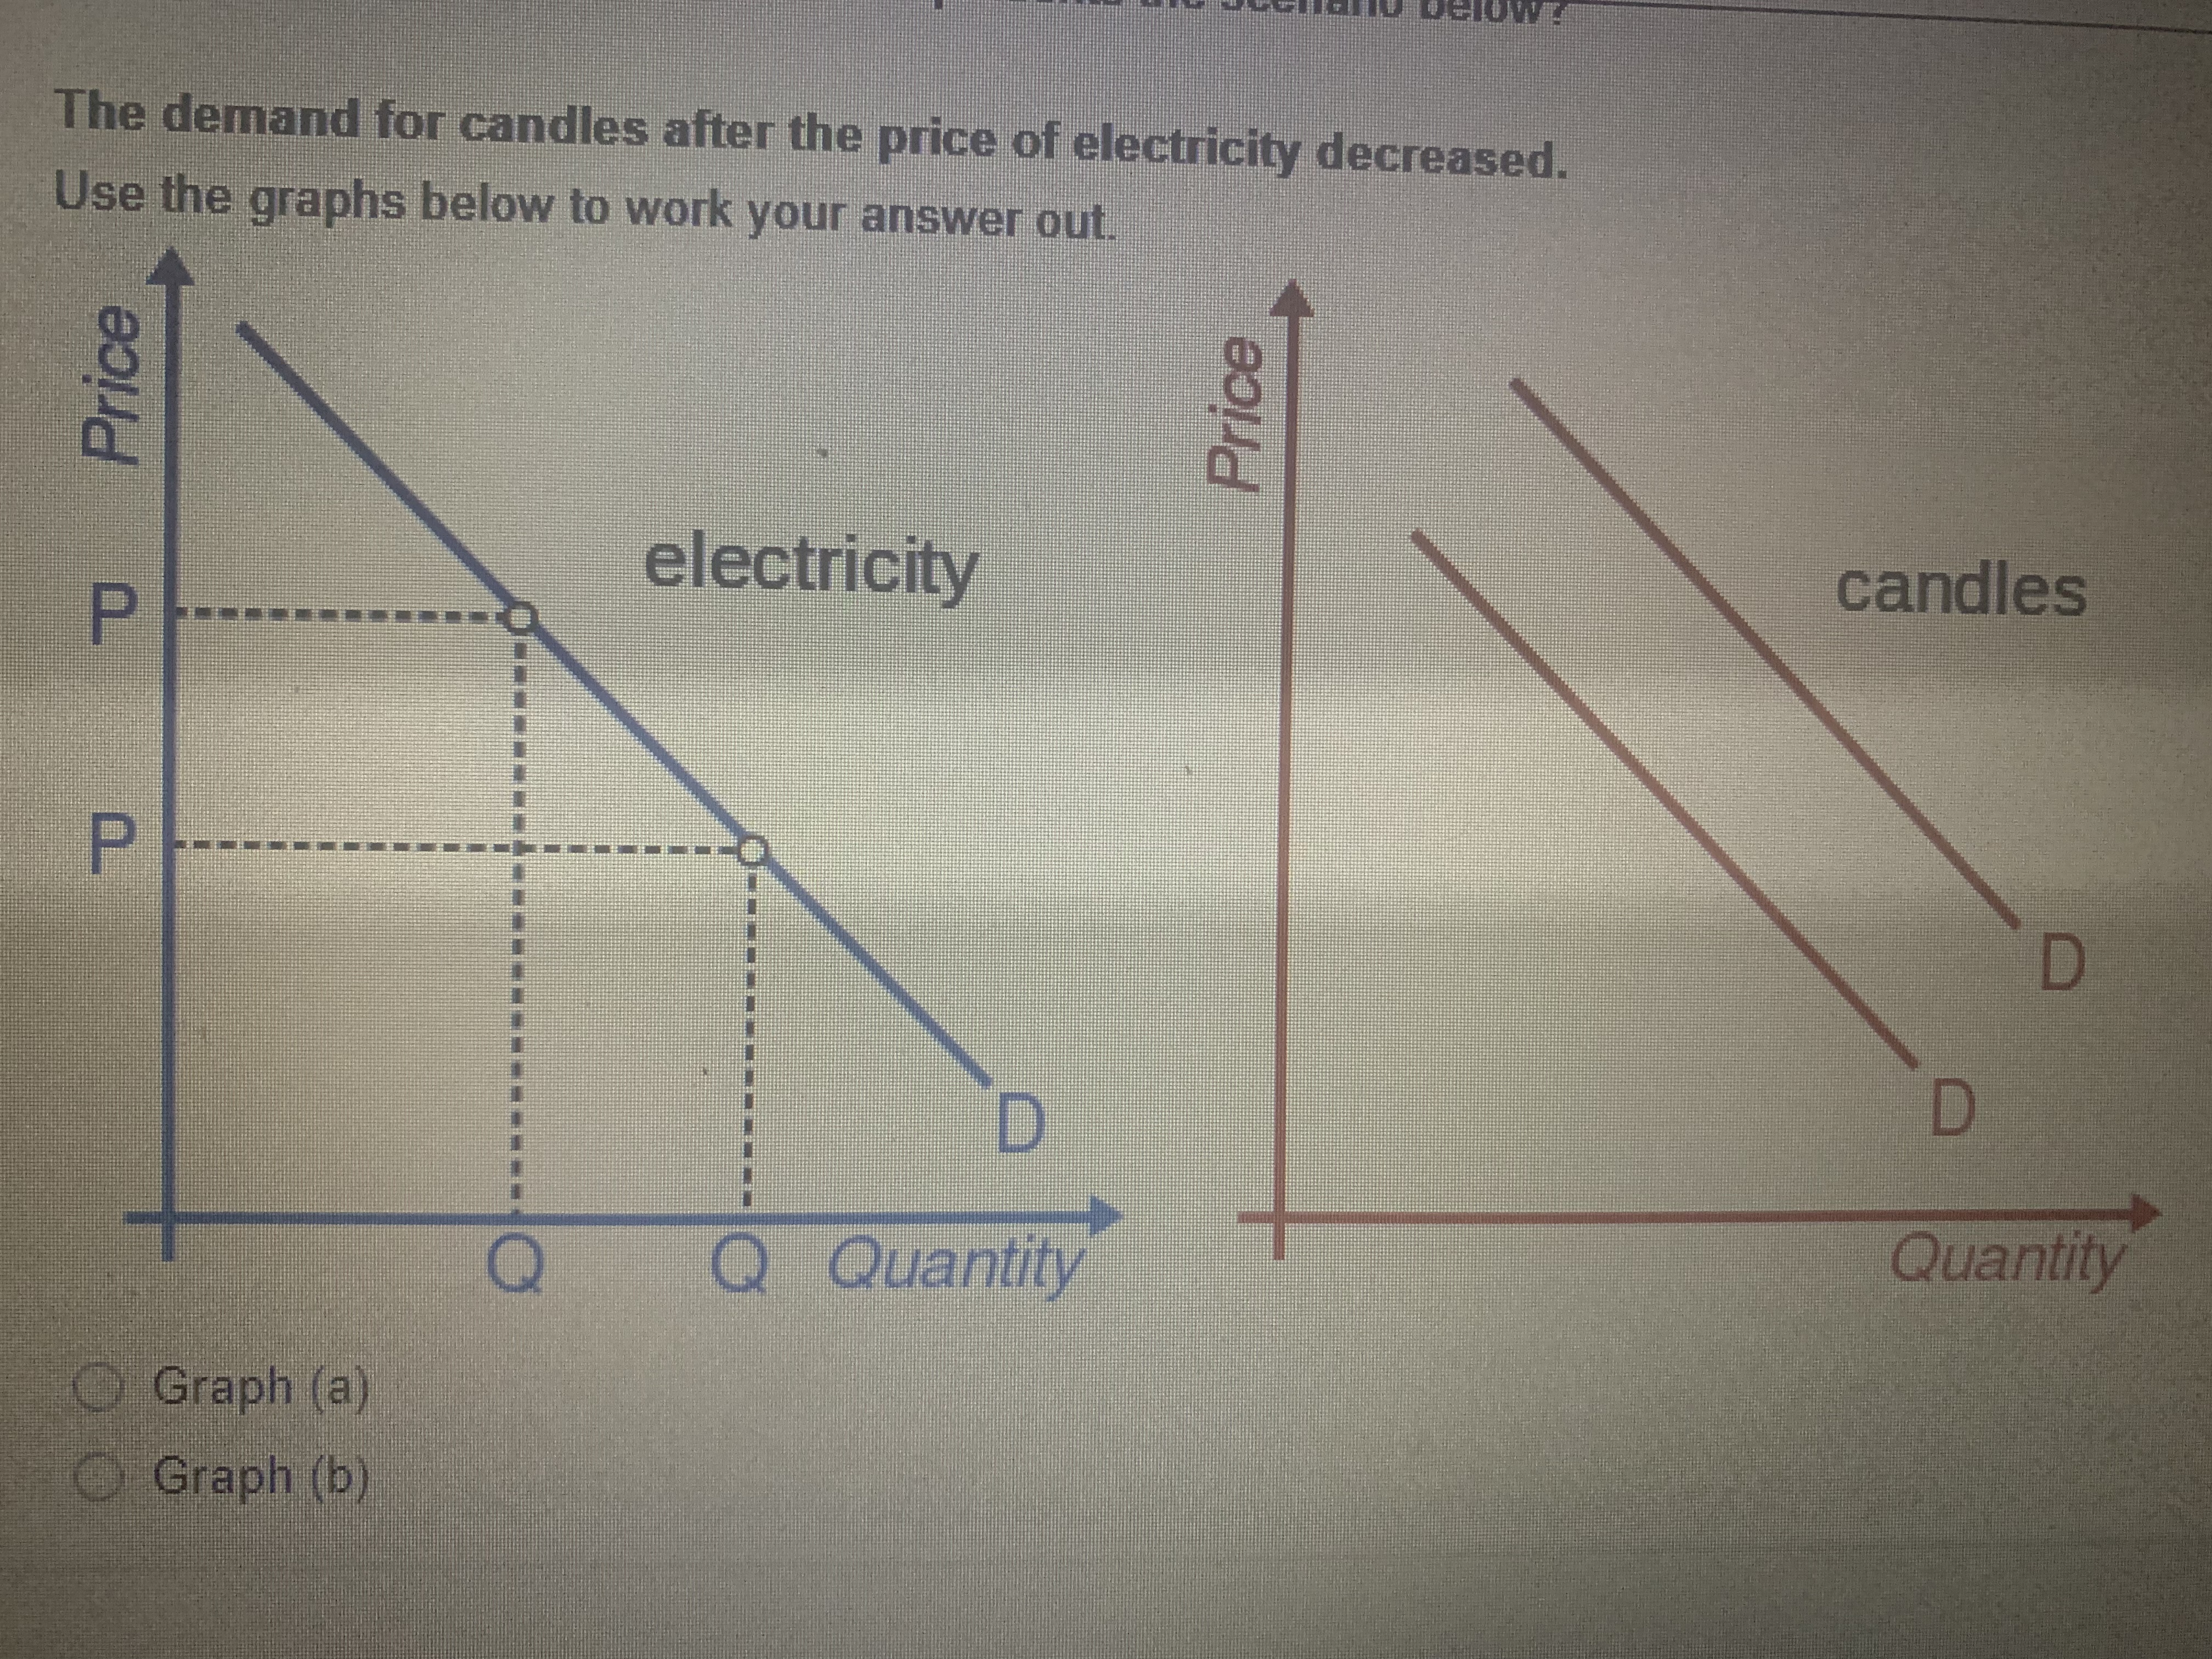


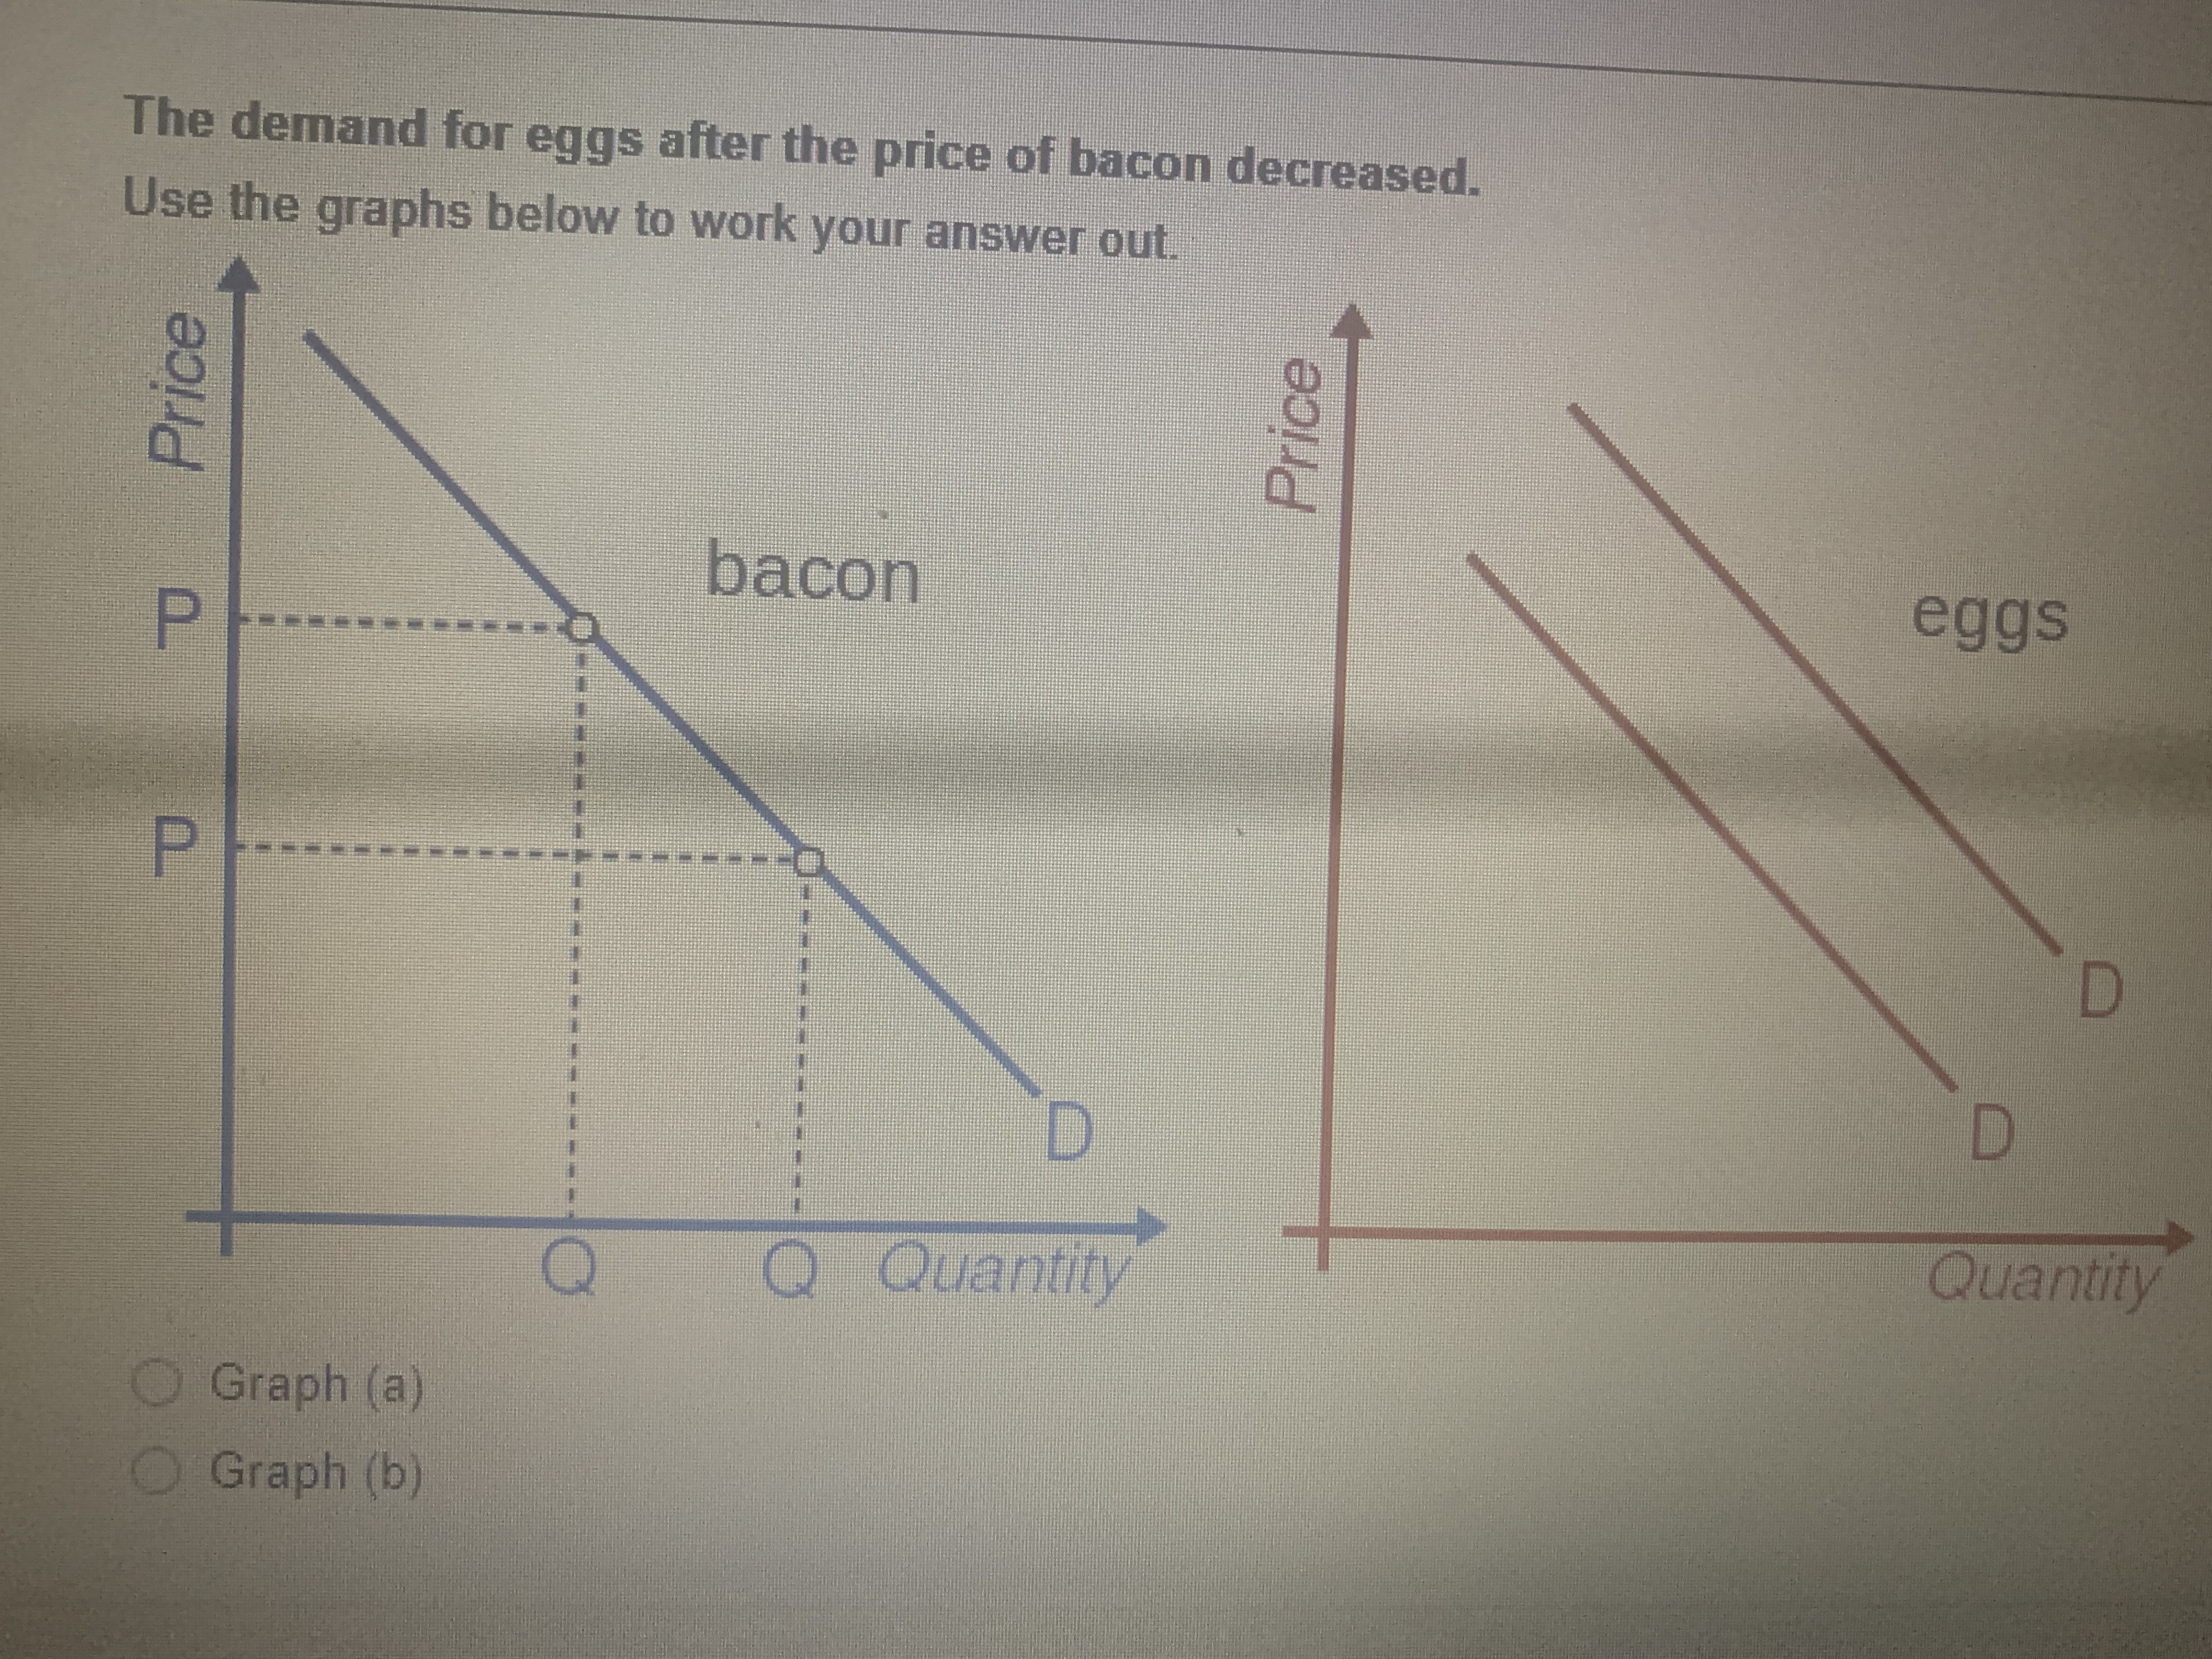
QUESTION 9 What effect will a decrease in demand combined with a increase in supply have on equiibrium price? The equilibrium price will increase. The equilibrium price will decrease. The equilibrium price will remain unchanged.QUESTION 10 Graphs (a) and (b) below represent shifts in demand Graph (a) Graph (b) P P D1 S D D2 Price per unit Price per unit Po IS D S Q 0 Quantity per period Quantity per period Which of the two graphs above best represents the scenario below? The demand for tvre pumps after the price of tvres decreased.QUESTION 11 Graphs (a) and (b) below represent shifts in demand. Graph (a) Graph (b) P D1 S D D P1 Price per unit Price per unit D D S S Q 0 Quantity per period Quantity per period Which of the two graphs above best represents the scenario below?QUESTION 13 Graphs (a) and (b) below represent shifts in demand Graph (a) Graph (b) P P D1 S S D E1 D2 P1 Price per unit Price per unit Po D S S D2 Q 0 Quantity per period Quantity per period Which of the two graphs above best represents the scenario below? The demand for pencils after the price of pens increased.The demand for pencils after the price of pens increased. Use the graphs below to work your answer out Price Price pen pencil P D D D Q Q Quantity Quantity Graph (a) Graph (b)The demand for candles after the price of electricity decreased. Use the graphs below to work your answer out. Price Price electricity P candles P D D 0 Q Q Quantity Quantity Graph (a) Graph (b)The demand for tyre pumps after the price of tyres decreased. Use the graphs below to work your answer out Price Price tyres tyre pumps P D D Q Q Quantity Quantity Graph (a) Graph (b)QUESTION 12 Graphs (a) and (b) below represent shifts in demand. Graph (a) Graph (b) P D1 P S S D D P1 E Price per unit Price per unit Po D S D S D2 Q 0 O Quantity per period Quantity per period Which of the two graphs above best represents the scenario below? rancertThe demand for eggs after the price of bacon decreased. Use the graphs below to work your answer out. Price Price bacon eggs P P D Q Q Quantity Quantity Graph (a) O Graph (b)
Step by Step Solution
There are 3 Steps involved in it

Get step-by-step solutions from verified subject matter experts