

Question I Price cents per gallon) 290 300 310 320 330 340 350 Quantity demanded Quantity...
Fantastic news! We've Found the answer you've been seeking!
Question:
Transcribed Image Text:
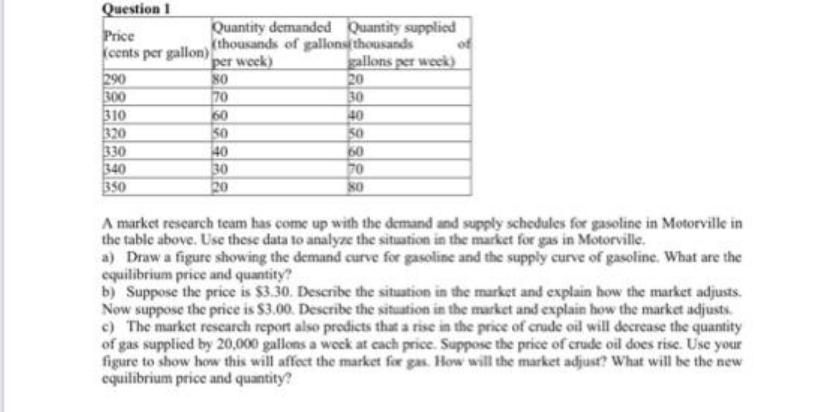
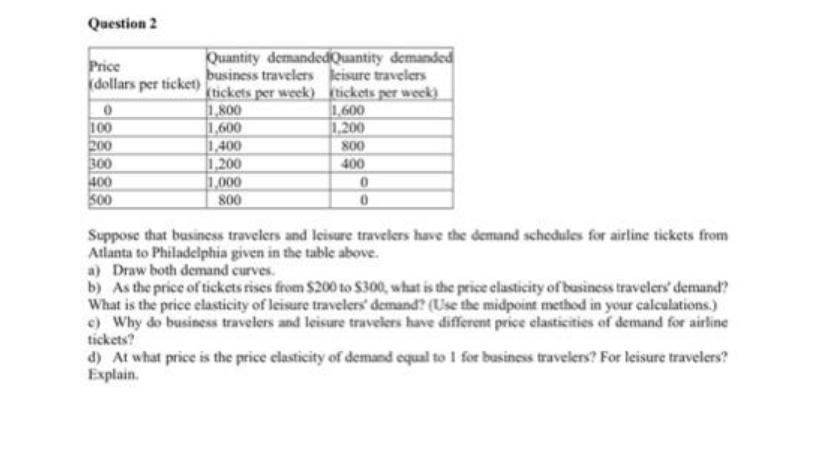
Question I Price cents per gallon) 290 300 310 320 330 340 350 Quantity demanded Quantity supplied (thousands of gallons thousands per week) gallons per week) 19288928 80 70 60 50 40 30 20 20 30 40 9882 50 60 70 80 A market research team has come up with the demand and supply schedules for gasoline in Motorville in the table above. Use these data to analyze the situation in the market for gas in Motorville. a) Draw a figure showing the demand curve for gasoline and the supply curve of gasoline. What are the equilibrium price and quantity? b) Suppose the price is $3.30. Describe the situation in the market and explain how the market adjusts. Now suppose the price is $3.00. Describe the situation in the market and explain how the market adjusts. c) The market research report also predicts that a rise in the price of crude oil will decrease the quantity of gas supplied by 20,000 gallons a week at each price. Suppose the price of crude oil does rise. Use your figure to show how this will affect the market for gas. How will the market adjust? What will be the new equilibrium price and quantity? Question 2 Price Quantity demandedQuantity demanded business travelers leisure travelers dollars per ticket) tickets per week) (tickets per week) 1,800 1,600 1,600 1,200 1,400 800 1,200 400 1,000 800 0 100 200 300 400 500 0 0 Suppose that business travelers and leisure travelers have the demand schedules for airline tickets from Atlanta to Philadelphia given in the table above. a) Draw both demand curves. b) As the price of tickets rises from $200 to $300, what is the price elasticity of business travelers' demand? What is the price elasticity of leisure travelers' demand? (Use the midpoint method in your calculations.) c) Why do business travelers and leisure travelers have different price elasticities of demand for airline tickets? d) At what price is the price elasticity of demand equal to 1 for business travelers? For leisure travelers? Explain. Question I Price cents per gallon) 290 300 310 320 330 340 350 Quantity demanded Quantity supplied (thousands of gallons thousands per week) gallons per week) 19288928 80 70 60 50 40 30 20 20 30 40 9882 50 60 70 80 A market research team has come up with the demand and supply schedules for gasoline in Motorville in the table above. Use these data to analyze the situation in the market for gas in Motorville. a) Draw a figure showing the demand curve for gasoline and the supply curve of gasoline. What are the equilibrium price and quantity? b) Suppose the price is $3.30. Describe the situation in the market and explain how the market adjusts. Now suppose the price is $3.00. Describe the situation in the market and explain how the market adjusts. c) The market research report also predicts that a rise in the price of crude oil will decrease the quantity of gas supplied by 20,000 gallons a week at each price. Suppose the price of crude oil does rise. Use your figure to show how this will affect the market for gas. How will the market adjust? What will be the new equilibrium price and quantity? Question 2 Price Quantity demandedQuantity demanded business travelers leisure travelers dollars per ticket) tickets per week) (tickets per week) 1,800 1,600 1,600 1,200 1,400 800 1,200 400 1,000 800 0 100 200 300 400 500 0 0 Suppose that business travelers and leisure travelers have the demand schedules for airline tickets from Atlanta to Philadelphia given in the table above. a) Draw both demand curves. b) As the price of tickets rises from $200 to $300, what is the price elasticity of business travelers' demand? What is the price elasticity of leisure travelers' demand? (Use the midpoint method in your calculations.) c) Why do business travelers and leisure travelers have different price elasticities of demand for airline tickets? d) At what price is the price elasticity of demand equal to 1 for business travelers? For leisure travelers? Explain. Question I Price cents per gallon) 290 300 310 320 330 340 350 Quantity demanded Quantity supplied (thousands of gallons thousands per week) gallons per week) 19288928 80 70 60 50 40 30 20 20 30 40 9882 50 60 70 80 A market research team has come up with the demand and supply schedules for gasoline in Motorville in the table above. Use these data to analyze the situation in the market for gas in Motorville. a) Draw a figure showing the demand curve for gasoline and the supply curve of gasoline. What are the equilibrium price and quantity? b) Suppose the price is $3.30. Describe the situation in the market and explain how the market adjusts. Now suppose the price is $3.00. Describe the situation in the market and explain how the market adjusts. c) The market research report also predicts that a rise in the price of crude oil will decrease the quantity of gas supplied by 20,000 gallons a week at each price. Suppose the price of crude oil does rise. Use your figure to show how this will affect the market for gas. How will the market adjust? What will be the new equilibrium price and quantity? Question 2 Price Quantity demandedQuantity demanded business travelers leisure travelers dollars per ticket) tickets per week) (tickets per week) 1,800 1,600 1,600 1,200 1,400 800 1,200 400 1,000 800 0 100 200 300 400 500 0 0 Suppose that business travelers and leisure travelers have the demand schedules for airline tickets from Atlanta to Philadelphia given in the table above. a) Draw both demand curves. b) As the price of tickets rises from $200 to $300, what is the price elasticity of business travelers' demand? What is the price elasticity of leisure travelers' demand? (Use the midpoint method in your calculations.) c) Why do business travelers and leisure travelers have different price elasticities of demand for airline tickets? d) At what price is the price elasticity of demand equal to 1 for business travelers? For leisure travelers? Explain. Question I Price cents per gallon) 290 300 310 320 330 340 350 Quantity demanded Quantity supplied (thousands of gallons thousands per week) gallons per week) 19288928 80 70 60 50 40 30 20 20 30 40 9882 50 60 70 80 A market research team has come up with the demand and supply schedules for gasoline in Motorville in the table above. Use these data to analyze the situation in the market for gas in Motorville. a) Draw a figure showing the demand curve for gasoline and the supply curve of gasoline. What are the equilibrium price and quantity? b) Suppose the price is $3.30. Describe the situation in the market and explain how the market adjusts. Now suppose the price is $3.00. Describe the situation in the market and explain how the market adjusts. c) The market research report also predicts that a rise in the price of crude oil will decrease the quantity of gas supplied by 20,000 gallons a week at each price. Suppose the price of crude oil does rise. Use your figure to show how this will affect the market for gas. How will the market adjust? What will be the new equilibrium price and quantity? Question 2 Price Quantity demandedQuantity demanded business travelers leisure travelers dollars per ticket) tickets per week) (tickets per week) 1,800 1,600 1,600 1,200 1,400 800 1,200 400 1,000 800 0 100 200 300 400 500 0 0 Suppose that business travelers and leisure travelers have the demand schedules for airline tickets from Atlanta to Philadelphia given in the table above. a) Draw both demand curves. b) As the price of tickets rises from $200 to $300, what is the price elasticity of business travelers' demand? What is the price elasticity of leisure travelers' demand? (Use the midpoint method in your calculations.) c) Why do business travelers and leisure travelers have different price elasticities of demand for airline tickets? d) At what price is the price elasticity of demand equal to 1 for business travelers? For leisure travelers? Explain.
Expert Answer:
Answer rating: 100% (QA)
Question 1 a The diagram is given below The equilibrium quantity is 50000 gallons per week and the equilibrium price is 320 At this point there is equilibrium because the market supply and demand for ... View the full answer

Related Book For 

The Macro Economy Today
ISBN: 978-1259291821
14th edition
Authors: Bradley R. Schiller, Karen Gebhardt
Posted Date:
Students also viewed these economics questions
-
Suppose the following table shows the quantity of laundry detergent that is demanded and supplied at various prices in Country 1. a. Use the data in the table to draw the demand and supply curves in...
-
The table shows the demand and supply schedules for running shoes. What is the market equilibrium? If the price is $70 a pair, describe the situation in the market. Explain how market equilibrium is...
-
The demand and supply schedules for gum are in the table. a. Draw a graph of the market for gum and mark in the equilibrium price and quantity. b. Suppose that the price of gum is 70 cents a pack....
-
A general ledger trial balance at June 30, 2011, for Millar City is as follows: Millar City uses a purchases basis in accounting for supplies. Open encumbrances are considered constrained by the...
-
Outdoor air (cp = 1.005 kJ/kg ¢ °C) is to be preheated by hot exhaust gases in a cross-flow heat exchanger before it enters the furnace. Air enters the heat exchanger at 95 kPa and 20°C...
-
Weddings on Demand sells on account and manages its own receivables. Average experience for the past three years has been as follows: Unhappy with the amount of bad debt expense she has been...
-
Find the = 0.05 critical value for the chi-square statistic with 14 degrees of freedom.
-
a. Firm D has net income of $66,640, sales of $2,380,000, and average total assets of $680,000. Calculate the firm's margin, turnover, and ROI. b. Firm E has net income of $300,000, sales of...
-
The Cecil-Booker Vending Company changed its method of valuing inventory from the average cost method to the FIFO cost method at the beginning of 2024. At December 31, 2023, Inventories were $120,000...
-
Inputs X i and Y i of each full adder in an arithmetic circuit have digital logic specified by the Boolean functions where S is a selection variable, C in is the input carry, and A i and B i are...
-
Metlock Company specializes in manufacturing a unique model of bicycle helmet. The model is well accepted by consumers, and the company has enough orders to keep the factory production at 10,000...
-
Samples of five cans are to be selected periodically from a canning process that has a standard deviation (o) of 0.2 ounces when in control. What will the standard devia- tion in the sampling...
-
What role do you think race should play in the formation of adoptive families? What about the sexual orientation of the parents?
-
A certain product can weigh no more than 1.001 and no less than 0.998 ounces by design. A machine being considered to produce this product has natural standard deviation of 0.0004 ounces in its...
-
Five cans are measured from the recent output of a high-speed bottling line. The weights of each of these cans are 12.23, 12.55, 12.01, 12.26, and 12.17 ounces. What is the range in this sample of...
-
Give two reasons why modal analysis should be used before using numerical integration of the convolution integral. Regarding the derivation of modal analysis for a system with a general damping...
-
Maxus International is considering making an offer to takeover Betrium Co. Further, suppose Betrium Co's shareholder are given one Maxus International's share in exchange for every two shares of...
-
C- Consider the following scenario:- A supermarket needs to develop the following software to encourage regular customers. For this, the customer needs to supply his/her residence address, telephone...
-
How is the aggregate supply curve affected by (a) Minimum wage laws (b) Social Security payroll taxes (c) Social Security retirement benefits (d) Tighter border security?
-
If people never withdrew cash from banks, how much money could the banking system potentially create? Could this really happen? What might limit deposit creation in this case?
-
Why do some nations grow and prosper while others stagnate?
-
Derive the mass matrix of the system shown in Fig. 5.42. 00000 2m 8(t) * 2m ellee x(t) m 00000 FIGURE 5.42 Rigid bar connected to masses and springs.
-
Derive the stiffness matrix of the system shown in Fig. 5.42. 00000 2m 8(t) * 2m ellee x(t) m 00000 FIGURE 5.42 Rigid bar connected to masses and springs.
-
Derive the flexibility matrix of the system shown in Fig. 5.42. 00000 2m 8(t) * 2m ellee x(t) m 00000 FIGURE 5.42 Rigid bar connected to masses and springs.

Study smarter with the SolutionInn App