

In a survey of 500 drivers from the South, 396 wear a seat belt. In a...
Fantastic news! We've Found the answer you've been seeking!
Question:
Transcribed Image Text:
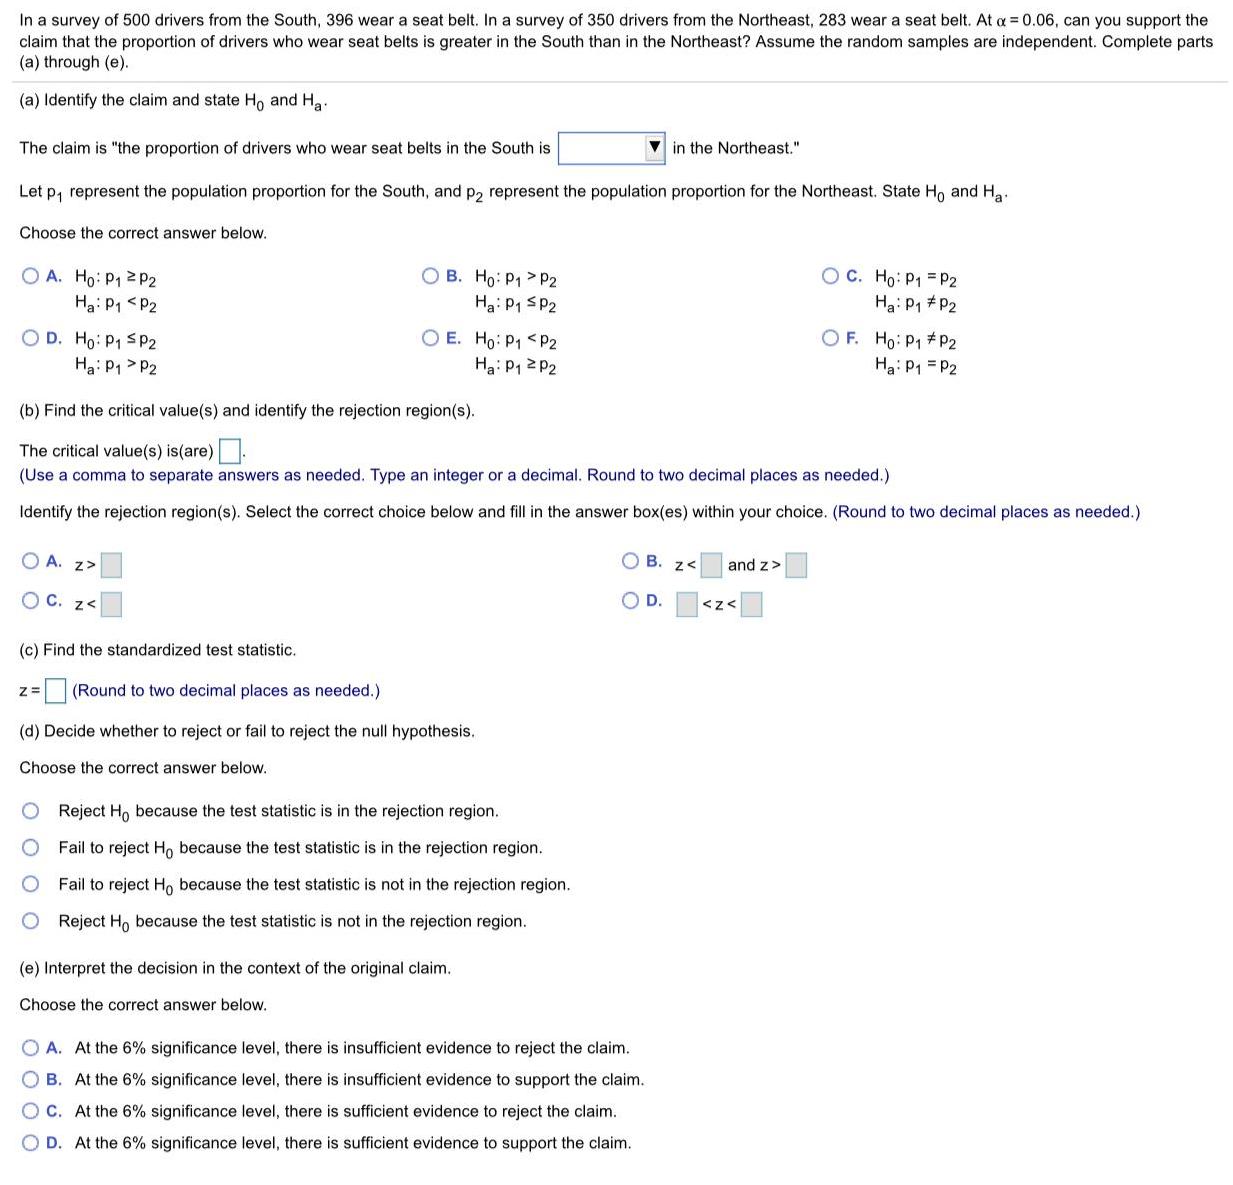
In a survey of 500 drivers from the South, 396 wear a seat belt. In a survey of 350 drivers from the Northeast, 283 wear a seat belt. At a = 0.06, can you support the claim that the proportion of drivers who wear seat belts is greater in the South than in the Northeast? Assume the random samples are independent. Complete parts (a) through (e). (a) Identify the claim and state Ho and Ha. The claim is "the proportion of drivers who wear seat belts in the South is v in the Northeast." Let p, represent the population proportion for the South, and p2 represent the population proportion for the Northeast. State Ho and Ha. Choose the correct answer below. OC. Ho: P1 = P2 O A. Ho: P1 2P2 Ha: P1 <P2 O B. Ho: P1 > P2 Ha: P1 SP2 Hai P1 # P2 O D. Ho: P1 SP2 Ha: P1 > P2 O E. Ho: P1 <P2 OF. Ho: P1 #P2 Ha: P1 2 P2 Ha: P1 = P2 (b) Find the critical value(s) and identify the rejection region(s). The critical value(s) is(are). (Use a comma to separate answers as needed. Type an integer or a decimal. Round to two decimal places as needed.) Identify the rejection region(s). Select the correct choice below and fill in the answer box(es) within your choice. (Round to two decimal places as needed.) O A. z> O B. z< and z> O C. z< OD. <z< (c) Find the standardized test statistic. z= (Round to two decimal places as needed.) (d) Decide whether to reject or fail to reject the null hypothesis. Choose the correct answer below. Reject H, because the test statistic is in the rejection region. Fail to reject Ho because the test statistic is in the rejection region. Fail to reject Ho because the test statistic is not in the rejection region. O Reject Ho because the test statistic is not in the rejection region. (e) Interpret the decision in the context of the original claim. Choose the correct answer below. O A. At the 6% significance level, there is insufficient evidence to reject the claim. O B. At the 6% significance level, there is insufficient evidence to support the claim. OC. At the 6% significance level, there is sufficient evidence to reject the claim. O D. At the 6% significance level, there is sufficient evidence to support the claim. In a survey of 500 drivers from the South, 396 wear a seat belt. In a survey of 350 drivers from the Northeast, 283 wear a seat belt. At a = 0.06, can you support the claim that the proportion of drivers who wear seat belts is greater in the South than in the Northeast? Assume the random samples are independent. Complete parts (a) through (e). (a) Identify the claim and state Ho and Ha. The claim is "the proportion of drivers who wear seat belts in the South is v in the Northeast." Let p, represent the population proportion for the South, and p2 represent the population proportion for the Northeast. State Ho and Ha. Choose the correct answer below. OC. Ho: P1 = P2 O A. Ho: P1 2P2 Ha: P1 <P2 O B. Ho: P1 > P2 Ha: P1 SP2 Hai P1 # P2 O D. Ho: P1 SP2 Ha: P1 > P2 O E. Ho: P1 <P2 OF. Ho: P1 #P2 Ha: P1 2 P2 Ha: P1 = P2 (b) Find the critical value(s) and identify the rejection region(s). The critical value(s) is(are). (Use a comma to separate answers as needed. Type an integer or a decimal. Round to two decimal places as needed.) Identify the rejection region(s). Select the correct choice below and fill in the answer box(es) within your choice. (Round to two decimal places as needed.) O A. z> O B. z< and z> O C. z< OD. <z< (c) Find the standardized test statistic. z= (Round to two decimal places as needed.) (d) Decide whether to reject or fail to reject the null hypothesis. Choose the correct answer below. Reject H, because the test statistic is in the rejection region. Fail to reject Ho because the test statistic is in the rejection region. Fail to reject Ho because the test statistic is not in the rejection region. O Reject Ho because the test statistic is not in the rejection region. (e) Interpret the decision in the context of the original claim. Choose the correct answer below. O A. At the 6% significance level, there is insufficient evidence to reject the claim. O B. At the 6% significance level, there is insufficient evidence to support the claim. OC. At the 6% significance level, there is sufficient evidence to reject the claim. O D. At the 6% significance level, there is sufficient evidence to support the claim.
Expert Answer:

Related Book For 

Posted Date:
Students also viewed these mathematics questions
-
A survey of 500 randomly selected high school students determined that 288 played organized sports. (a) What is the probability that a randomly selected high school student plays organized sports?...
-
In a survey of Americans age 16 years or older, respondents were asked if they texted or e-mailed while driving during the previous 30 days. The results are summarized in the accompanying graph...
-
In a survey of 3000 high school seniors, 60% indicated that they used alcohol on a regular basis, while 40% did not. Forty-fve percent of the students who used alcohol regularly said they had...
-
In Exercises solve the first-order differential equation by any appropriate method. y' = 2x1 - y
-
Which data would be most suitable for a pie chart? Why not the others? a. Presidential vote in the last election by party (Democratic, Republican, Other). b. Retail prices of six major brands of...
-
(a) A random .sample of 200 voters is selected and 114 are found to support, an annexation suit. Find the 96% confidence interval for the fraction of the voting population favoring the suit. (b) What...
-
Eco-control has five procedural steps.Think of an important corporate environmental intervention (e.g. emission of waste-water). With reference to this corporate environmental intervention, explain...
-
a. Create a data flow diagram of the current system. b. Create a system flowchart of the existing system. c. Identify the internal control weaknesses in the system. Use the six categories of physical...
-
Each year a local public high school allows the valedictorian of the senior class to deliver a speech at graduation. The school does not provide any guidelines beyond a 10 minute limit. This year,...
-
An internet service provider has two connection lines for its customers. Eighty percent of all customers are connected through line I, and twenty percent are connected through line II. Line I has a...
-
What advanced training programs or professional development initiatives have proven effective in enhancing the conflict resolution skills of leaders and mediators, and how do these programs evolve to...
-
Write a C++ program based on Structures and declare struct University Employee to store the Employee's details (Country name, First_name, Second_name, no. of Years' Experience, Date of Birth,...
-
What are your core strengths or motivated skills? In what functions and responsibilities do you excel? For what things are you the designated "gc to" person? What gap would your company be faced with...
-
Write the expression as a single logarithm. Check 1 7 logx- logy +6 log w 2 log (D
-
What proactive measures can organizations or governments take to prevent conflicts from escalating into larger disputes, and how do these measures align with broader goals of social cohesion and...
-
The following information related to physical units in Hayward Company's manufacturing facility. The company's product passes through each of the four departments in sequential order. Department 1 2...
-
Suppose you are comparing just two means. Among the possible statistics you could use is the difference in means, the MAD, or the max min (the difference between the largest mean and the smallest...
-
The flow rate of water through a cylindrical pipe is given by Q = r2v, where r is the radius of the pipe and v is the flow velocity. a. Assume that r = 3.00 0.03 m and v = 4.0 0.2 m/s. Estimate Q,...
-
Let T Weibull (0.5, 3). a. Find T. b. Find T. c. Find P(T < 1). d. Find P(T > 5).
-
The article "Computing and Using Rural versus Urban Measures in Statistical Applications" (C. Goodall, K. Kafadar, and J. Tukey, The American Statistician, 1998:101-111) discusses methods to measure...
-
A four-volume work is on a shelf in random order. What is the probabilty that the volumes stand in the proper order from left to right or from right to left?
-
There are \(M\) defective items in a lot consisting of \(N\) items. From this lot we select \(n(n
-
The numbers \(1,2,3,4,5\) are written on five cards. Three cards are drawn in succession and at random from the deck; the resulting digits are written from left to right. What is the probability that...

Study smarter with the SolutionInn App