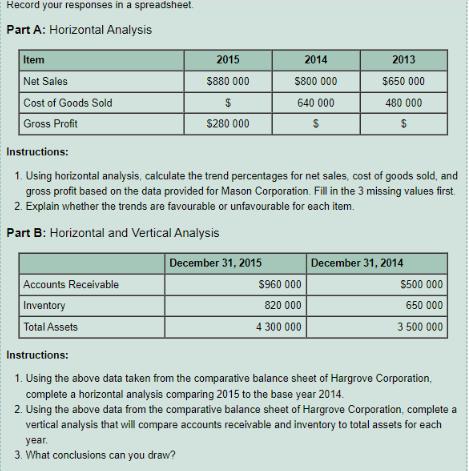
Record your responses in a spreadsheet. Part A: Horizontal Analysis Item Net Sales Cost of Goods...
Fantastic news! We've Found the answer you've been seeking!
Question:
Transcribed Image Text:
Record your responses in a spreadsheet. Part A: Horizontal Analysis Item Net Sales Cost of Goods Sold Gross Profit 2015 $880 000 $ $280 000 Accounts Receivable Inventory Total Assets 2014 $800 000 640 000 S December 31, 2015 Instructions: 1. Using horizontal analysis, calculate the trend percentages for net sales, cost of goods sold, and gross profit based on the data provided for Mason Corporation. Fill in the 3 missing values first 2. Explain whether the trends are favourable or unfavourable for each item. Part B: Horizontal and Vertical Analysis 2013 $960 000 820 000 4 300 000 $650 000 480 000 $ December 31, 2014 $500 000 650 000 3 500 000 Instructions: 1. Using the above data taken from the comparative balance sheet of Hargrove Corporation, complete a horizontal analysis comparing 2015 to the base year 2014. 2. Using the above data from the comparative balance sheet of Hargrove Corporation, complete a vertical analysis that will compare accounts receivable and inventory to total assets for each year. 3. What conclusions can you draw? Part C: Comparative Balance Sheet - Horizontal and Vertical Analysis Current assets Capital assets Current liabilities Long-term debt Common shares Retained earnings 2014 $322 678 $180 200 320 300 2013 $280 520 $120 160 320 200 Instructions: 1. Using horizontal analysis, show the percentage change for each balance sheet item of Martin Corporation, using 2013 as a base year 2. Using vertical analysis, prepare a common size comparative balance sheet for Martin Corporation for each year. Record your responses in a spreadsheet. Part A: Horizontal Analysis Item Net Sales Cost of Goods Sold Gross Profit 2015 $880 000 $ $280 000 Accounts Receivable Inventory Total Assets 2014 $800 000 640 000 S December 31, 2015 Instructions: 1. Using horizontal analysis, calculate the trend percentages for net sales, cost of goods sold, and gross profit based on the data provided for Mason Corporation. Fill in the 3 missing values first 2. Explain whether the trends are favourable or unfavourable for each item. Part B: Horizontal and Vertical Analysis 2013 $960 000 820 000 4 300 000 $650 000 480 000 $ December 31, 2014 $500 000 650 000 3 500 000 Instructions: 1. Using the above data taken from the comparative balance sheet of Hargrove Corporation, complete a horizontal analysis comparing 2015 to the base year 2014. 2. Using the above data from the comparative balance sheet of Hargrove Corporation, complete a vertical analysis that will compare accounts receivable and inventory to total assets for each year. 3. What conclusions can you draw? Part C: Comparative Balance Sheet - Horizontal and Vertical Analysis Current assets Capital assets Current liabilities Long-term debt Common shares Retained earnings 2014 $322 678 $180 200 320 300 2013 $280 520 $120 160 320 200 Instructions: 1. Using horizontal analysis, show the percentage change for each balance sheet item of Martin Corporation, using 2013 as a base year 2. Using vertical analysis, prepare a common size comparative balance sheet for Martin Corporation for each year.
Expert Answer:
Answer rating: 100% (QA)
Part A Horizontal Analysis This involves calculating the trend percentages for net sales cost of goods sold and gross profit on the data provided for Pearson Corporation To compute the horizontal anal... View the full answer
Related Book For
Fundamentals of Corporate Finance
ISBN: 978-0133400694
1st canadian edition
Authors: Jonathan Berk, Peter DeMarzo, Jarrad Harford, David A. Stangeland, Andras Marosi
Posted Date:
Students also viewed these accounting questions
-
List three specific parts of the Case Guide, Objectives and Strategy Section (See below) that you had the most difficulty understanding. Describe your current understanding of these parts. Provide...
-
From the information about Valdemar Corporation in Figures 22.10 and 22.11 (page 784), do the following: a. For each year calculate its current ratio and acid test ratio. b. For each year prepare the...
-
From the information about Valdemar Corporation in Figures 22.16 and 22.17 (page 788), do the following: a. For each year calculate its current ratio and acid test ratio. b. For each year prepare the...
-
(a) lim f(x) X-C+ 5. y 7. Y 9. 2 IT - Limits and Continuity In Exercises 5-10, use the graph to determine each limit, and discuss the continuity of the function. -3+ (4,3), + + 1/2 3 4 (3, 1) (b) lim...
-
How is the cost of goods available for sale determined?
-
For each of the following transactions, indicate the two (or more) accounts that are affected and how they are affected (increase or decrease). Indicate whether the accounts are debited or credited....
-
True or False: If \(\operatorname{IRR}(\mathrm{A})>\operatorname{IRR}(\mathrm{B})\), then \(\operatorname{ERR}(\mathrm{A})>\operatorname{ERR}(\mathrm{B})\).
-
Koontz Company manufactures a number of products. The standards relating to one of these products are shown below, along with actual cost data for May. The production superintendent was pleased when...
-
Regarding 1031 exchanges, which of these statements regarding debt load in an exchanged property is true? Unset starred question The 1031 exchange doesn't address debt load. The debt load for the new...
-
On September 1, 201X, Dan Potter opened an auto repair shop. Here is his chart of accounts: Assets Liabilities Equity 101 Cash 201 Accounts Payable 301 Dan Potter, Capital 102 Accounts Receivable 302...
-
delivery of loans it purchases under its Farmer Mac I and II programs. Explain its pricing relative to its interest rate risk for these different delivery periods. (How does its required net yield...
-
Suppose oil production in Libya is interrupted by political unrest. At the same time, the demand for oil by China continues to rise. (LO5-1) a. Demonstrate the impact on the quantity of oil bought...
-
Economists have estimated the demand elasticity for motor fuel to be between 0.4 and 0.85. a. If the price rises 10 percent and the initial quantity sold is 10 million gallons, what is the range of...
-
Which has greater elasticity: a supply curve that goes through the origin with slope of 1 or a supply curve that goes through the origin with slope of 4?
-
Which of the pairs of goods would you expect to have a greater price elasticity of demand? a. Cars, transportation. b. Housing, leisure travel. c. Rubber during World War II, rubber during the entire...
-
A firm has just increased its price by 5 percent over last years price, and it found that quantity sold remained the same. a. What is its price elasticity of demand? b. How would you calculate it? c....
-
Using Fig. 3.1-1, the lower plate is being pulled at a relative velocity of 0.40 m/s greater than the top plate. The fluid used is water at 24C. a. How far apart should the two plates be placed so...
-
What is the back work ratio? What are typical back work ratio values for gas-turbine engines?
-
What is the basic financial cycle?
-
In a perfect capital market, how important is the firm's decision to pay dividends versus repurchase shares?
-
For each of the following pairs of Government of Canada bonds, identify which will have the higher price as a percentage of the face value. a. A three-year zero-coupon bond or a five-year zero-coupon...
-
Classify each of the following as either a policy instrument or an intermediary target. Explain your answer. a. Long-term interest rates b. Central bank interest rates c. M2 d. Reserve requirements
-
The New York Fed executes foreign exchange interventions for the Federal Reserve system. Go to https://www.newyorkfed.org/markets/quar_reports.html to see quarterly summaries of the Feds foreign...
-
The New Zealand dollar to U.S. dollar exchange rate is 1.38, and the British pound to U.S. dollar exchange rate is 0.65. If you find that the British pound to New Zealand dollar is trading at 0.5,...
Study smarter with the SolutionInn App