

Refer to the extracts from the Ryanair's Annual Report included in the exam materials for answering...
Fantastic news! We've Found the answer you've been seeking!
Question:
Transcribed Image Text:
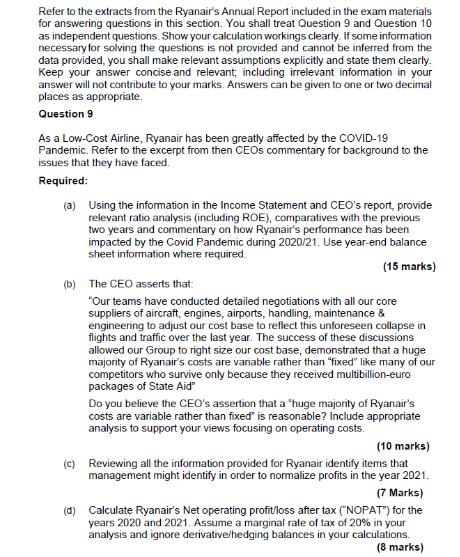
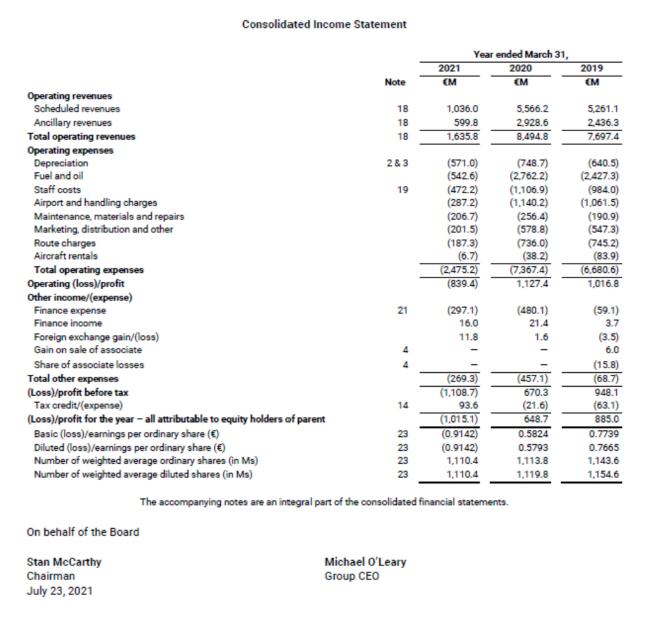
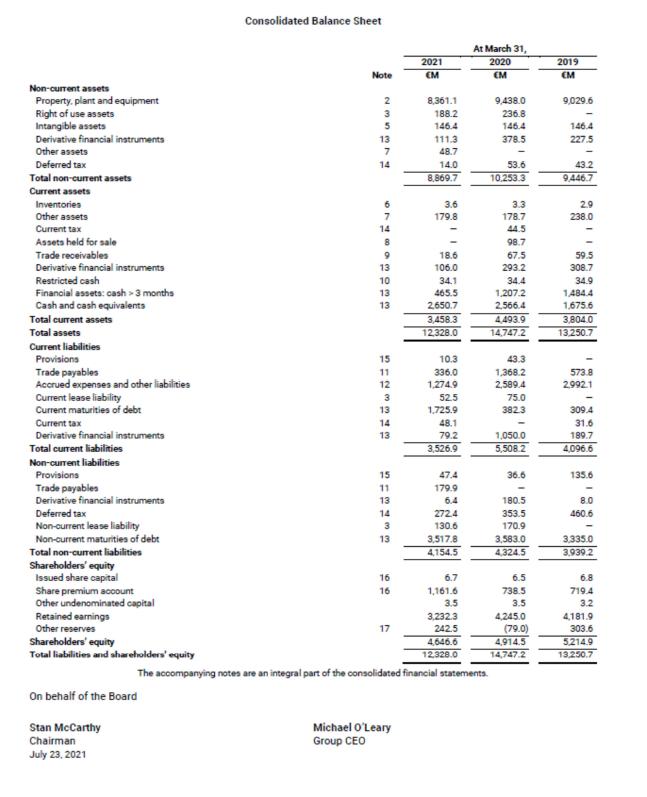
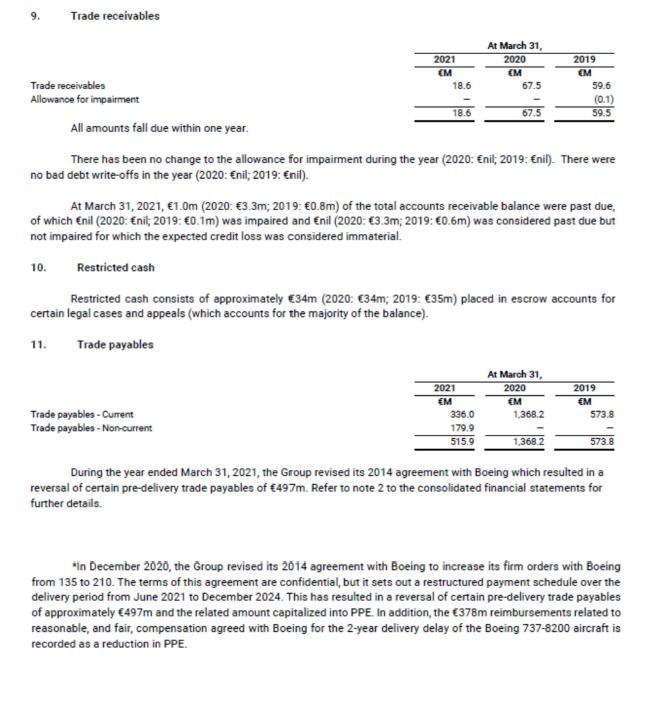
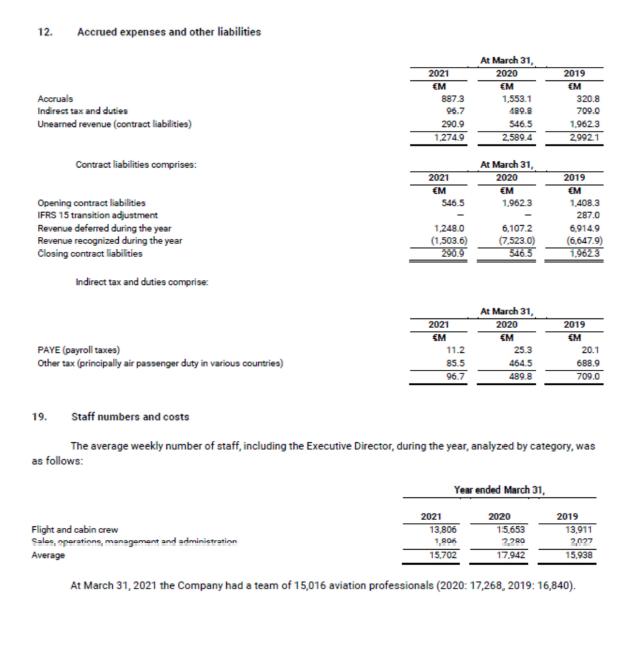
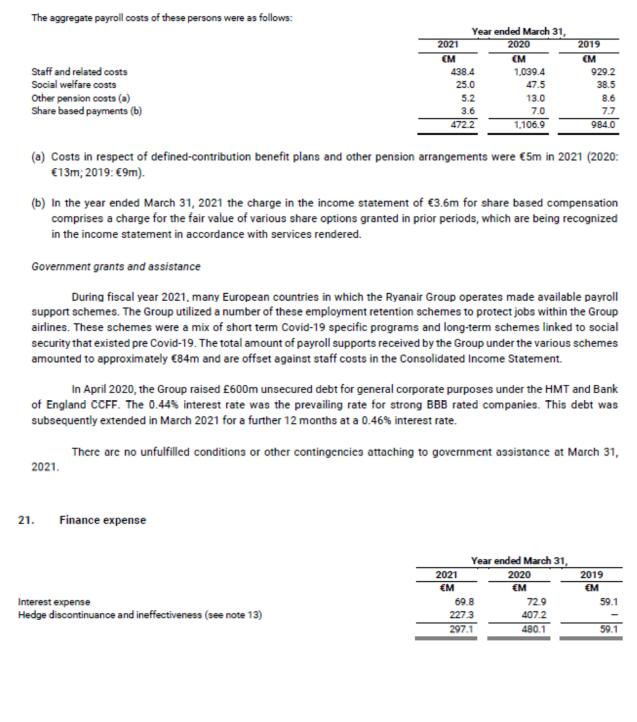
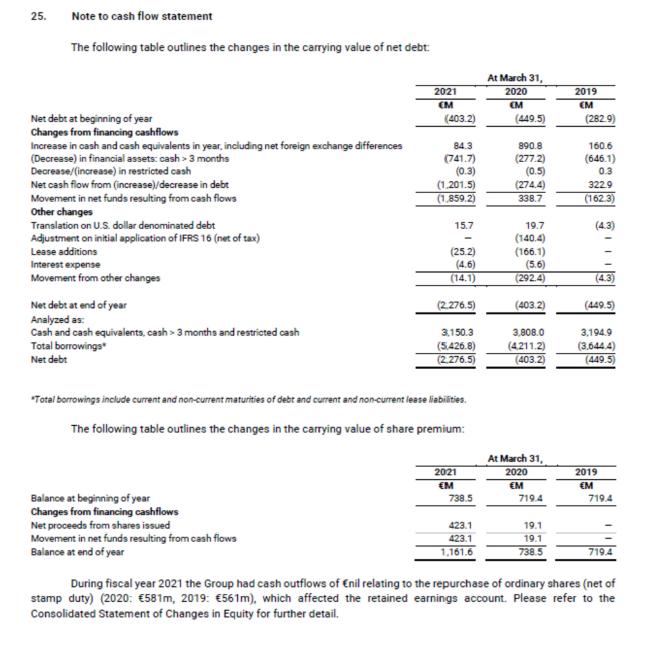
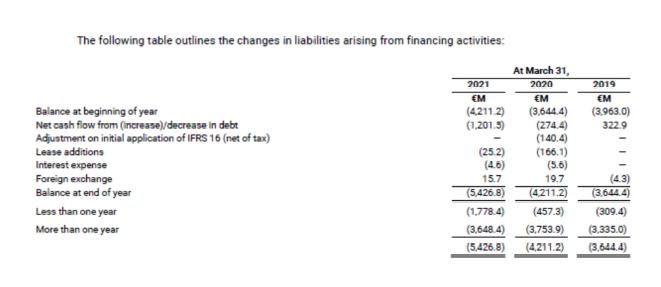
Refer to the extracts from the Ryanair's Annual Report included in the exam materials for answering questions in this section. You shall treat Question 9 and Question 10 as independent questions. Show your calculation workings clearly. If some information necessary for solving the questions is not provided and cannot be inferred from the data provided, you shall make relevant assumptions explicitly and state them clearly. Keep your answer concise and relevant; including irrelevant information in your answer will not contribute to your marks. Answers can be given to one or two decimal places as appropriate. Question 9 As a Low-Cost Airline, Ryanair has been greatly affected by the COVID-19 Pandemic. Refer to the excerpt from then CEOs commentary for background to the issues that they have faced. Required: (a) Using the information in the Income Statement and CEO's report, provide relevant ratio analysis (including ROE), comparatives with the previous two years and commentary on how Ryanair's performance has been impacted by the Covid Pandemic during 2020/21. Use year-end balance sheet information where required. (15 marks) (b) The CEO asserts that: "Our teams have conducted detailed negotiations with all our core suppliers of aircraft, engines, airports, handling, maintenance & engineering to adjust our cost base to reflect this unforeseen collapse in flights and traffic over the last year. The success of these discussions allowed our Group to right size our cost base, demonstrated that a huge majority of Ryanair's costs are variable rather than "fixed" like many of our competitors who survive only because they received multibillion-euro packages of State Aid" Do you believe the CEO's assertion that a "huge majority of Ryanair's costs are variable rather than fixed is reasonable? Include appropriate analysis to support your views focusing on operating costs. (10 marks) (c) Reviewing all the information provided for Ryanair identify items that management might identify in order to normalize profits in the year 2021. (7 Marks) (d) Calculate Ryanair's Net operating profit/loss after tax ("NOPAT") for the years 2020 and 2021. Assume a marginal rate of tax of 20% in your analysis and ignore derivative/hedging balances in your calculations. (8 marks) Operating revenues Scheduled revenues Ancillary revenues Total operating revenues Operating expenses Depreciation Fuel and oil Staff costs Airport and handling charges Maintenance, materials and repairs Marketing, distribution and other Route charges Aircraft rentals Total operating expenses Operating (loss)/profit Other income/(expense) Finance expense Finance income Foreign exchange gain/(loss) Gain on sale of associate Share of associate losses Total other expenses (Loss)/profit before tax Consolidated Income Statement Tax credit/(expense) (Loss)/profit for the year - all attributable to equity holders of parent Basic (loss)/earnings per ordinary share (€) Diluted (loss)/earnings per ordinary share (€) Number of weighted average ordinary shares (in Ms) Number of weighted average diluted shares (in Ms) On behalf of the Board Stan McCarthy Chairman July 23, 2021 Note 18 18 18 2&3 19 21 14 23 23 23 23 2021 CM Michael O'Leary Group CEO Year ended March 31, 2020 CM 1,036.0 599.8 1,635.8 (571.0) (542.6) (472.2) (287.2) (206.7) (201.5) (187.3) (6.7) (2,475.2) (839.4) (297.1) 16.0 11.8 (269.3) (1.108.7) 93.6 (1,015.1) (0.9142) (0.9142) 1,110.4 1,110.4 The accompanying notes are an integral part of the consolidated financial statements. 5,566.2 2.928.6 8,494.8 (748.7) (2,762.2) (1.106.9) (1.140.2) (256.4) (578.8) (736.0) (38.2) (7.367.4) 1,127.4 (480.1) 21.4 1.6 (457.1) 670.3 (21.6) 648.7 0.5824 0.5793 1,113.8 1,119.8 2019 (M 5,261.1 2,436.3 7,697.4 (640.5) (2,427.3) (984.0) (1.061.5) (190.9) (547.3) (745.2) (83.9) (6.680.6) 1,016.8 (59.1) 3.7 (3.5) 6.0 (15.8) (68.7) 948.1 (63.1) 885.0 0.7739 0.7665 1,143.6 1,154.6 Non-current assets Property, plant and equipment Right of use assets Intangible assets Derivative financial instruments Other assets Deferred tax Total non-current assets Current assets Inventories Other assets Current tax Assets held for sale Trade receivables Derivative financial instruments Restricted cash Financial assets: cash > 3 months Cash and cash equivalents Total current assets Total assets Current liabilities Provisions Trade payables Accrued expenses and other liabilities Current lease liability Current maturities of debt Current tax Derivative financial instruments Total current liabilities Non-current liabilities Provisions Trade payables Derivative financial instruments Deferred tax Non-current lease liability Non-current maturities of debt Total non-current liabilities Shareholders' equity Issued share capital Share premium account Other undenominated capital Retained earnings Other reserves Shareholders' equity Total liabilities and shareholders' equity On behalf of the Board Stan McCarthy Chairman July 23, 2021 Consolidated Balance Sheet Note 23337N 13 14 674893ORM 14 13 10 13 13 15 WHWW NG 11 12 3 13 14 13 R13433 15 11 16 16 17 2021 EM Michael O'Leary Group CEO 8,361.1 188.2 146.4 111.3 48.7 14.0 8,869.7 3.6 179.8 18.6 106.0 34.1 465.5 2.650.7 3,458.3 12,328.0 10.3 336.0 1,274.9 52.5 1,725.9 48.1 79.2 3,526.9 47.4 179.9 6.4 272.4 130.6 3,517.8 4,154.5 6.7 1,161.6 3.5 3,232.3 242.5 4,646.6 12.328.0 The accompanying notes are an integral part of the consolidated financial statements. At March 31, 2020 EM 9,438.0 236.8 146.4 378.5 53.6 10.253.3 3.3 178.7 44.5 98.7 67.5 293.2 34.4 1,207.2 2,566.4 4,493.9 14,747.2 43.3 1,368.2 2,589.4 75.0 382.3 1,050.0 5,508.2 36.6 180.5 353.5 170.9 3,583.0 4,324.5 6.5 738.5 3.5 4,245.0 (79.0) 4,914.5 14,747.2 2019 EM 9,029.6 146.4 227.5 43.2 9,446.7 2.9 238.0 59.5 308.7 34.9 1.484.4 1,675.6 3,804.0 13,250.7 573.8 2,992.1 309.4 31.6 189.7 4,096.6 135.6 8.0 460.6 3,335.0 3,939.2 6.8 719.4 3.2 4,181.9 303.6 5.214.9 13,250.7 Operating activities (Loss)/profit after tax Adjustments to reconcile profit after tax to net cash provided by operating activities Depreciation (Increase)/decrease in inventories Tax (credit)/expense on (loss)/profit Share-based payments Decrease/(increase) in trade receivables Increase/(decrease) in other assets Decrease/(increase) in trade payables (Decrease)/increase in accrued expenses & other liabilities (Decrease) in other creditors (Decrease) in provisions Decrease/(increase) in finance income (Decrease) in finance expense Gain on sale of associate Share of associate losses Consolidated Statement of Cash Flows Hedge ineffectiveness/foreign exchange Income tax refunded/(paid) Net cash (used in)/provided by operating activities Investing activities Capital expenditure-purchase of property, plant and equipment Supplier reimbursements for property, plant and equipment Proceeds from sale of property, plant and equipment Decrease/(increase) in restricted cash Decrease in financial assets: cash > 3 months Acquisition of subsidiary (net of cash acquired) Investment in associate Net cash provided by/(used in) investing activities Financing activities Shareholder returns (net of tax) Net proceeds from shares issued Proceeds from borrowings Repayments of borrowings Lease liabilities paid Net cash provided by/(used in) financing activities Increase in cash and cash equivalents Net foreign exchange differences Cash and cash equivalents at beginning of year Cash and cash equivalents at end of year Interest income received Interest expense paid Note Included in the cash flows from operating activities for the year are the following amounts: 2&3 6 14 19 9 15 14 2 10 13 13 25 13 2021 EM Year ended March 31, 2020 Restated EM (1,015.1) 571.0 (0.3) (93.6) 3.6 48.9 (3.5) (407.6) (1,318.8) (21.9) (3.7) (294.1) 87.1 (2.448.0) (294.7) 377.6 112.1 0.3 741.7 937.0 421.0 2.228.6 (950.3) (76.8) 1,622.5 111.5 (27.2) 2,566.4 2.650.7 *Includes amendments to trade payables and capital expenditure. See note 1 (vi) for further detail 648.7 748.7 (0.4) 21.6 7.0 (8.1) 61.9 15.2 (401.4) (55.7) 29 407.2 (120.5) 1,327.1 (578.8) 0.5 277.2 (301.1) (580.5) 19.1 750.0 (408.1) (67.5) (287.0) 739.0 151.8 1,675.6 2.566.4 0.2 (59.2) The accompanying notes are an integral part of the consolidated financial statements. 24.4 (74.3) 2019 Restated EM 885.0 640.5 0.8 63.1 7.7 (1.9) (2.1) 66.0 198.6 (2.8) (2.5) (0.5) (1.5) (6.0) 15.8 (100.9) 1,759.3 (1,288.5) (0.3) 646.1 (86.5) (15.0) (744.2) (531.6) 99.9 (422.8) (854.5) 160.6 1,515.0 1,675.6 3.2 (60.6) Trade receivables Trade receivables Allowance for impairment All amounts fall due within one year. 10. 2021 (M 18.6 18.6 Trade payables - Current Trade payables - Non-current At March 31, 2020 (M 67.5 2021 EM 67.5 There has been no change to the allowance for impairment during the year (2020: Enil; 2019: Énil). There were no bad debt write-offs in the year (2020: Enil; 2019: Enil). 336.0 179.9 515.9 At March 31, 2021, €1.0m (2020: €3.3m; 2019: €0.8m) of the total accounts receivable balance were past due, of which Enil (2020: Enil; 2019: €0.1m) was impaired and Enil (2020: €3.3m; 2019: €0.6m) was considered past due but not impaired for which the expected credit loss was considered immaterial. Restricted cash Restricted cash consists of approximately €34m (2020: €34m; 2019: €35m) placed in escrow accounts for certain legal cases and appeals (which accounts for the majority of the balance). 11. Trade payables 2019 EM At March 31, 2020 EM 59.6 1,368.2 (0.1) 59.5 1,368.2 2019 €M 573.8 573.8 During the year ended March 31, 2021, the Group revised its 2014 agreement with Boeing which resulted in a reversal of certain pre-delivery trade payables of €497m. Refer to note 2 to the consolidated financial statements for further details. *In December 2020, the Group revised its 2014 agreement with Boeing to increase its firm orders with Boeing from 135 to 210. The terms of this agreement are confidential, but it sets out a restructured payment schedule over the delivery period from June 2021 to December 2024. This has resulted in a reversal of certain pre-delivery trade payables of approximately €497m and the related amount capitalized into PPE. In addition, the €378m reimbursements related to reasonable, and fair, compensation agreed with Boeing for the 2-year delivery delay of the Boeing 737-8200 aircraft is recorded as a reduction in PPE. 12. Accrued expenses and other liabilities Accruals Indirect tax and duties Unearned revenue (contract liabilities) Contract liabilities comprises: Opening contract liabilities IFRS 15 transition adjustment Revenue deferred during the year Revenue recognized during the year Closing contract liabilities 19. Indirect tax and duties comprise: PAYE (payroll taxes) Other tax (principally air passenger duty in various countries) 2021 €M Flight and cabin crew Sales, aparatinne, management and administration Average 887.3 96.7 290.9 1.274.9 2021 EM 546.5 1,248.0 (1,503.6) 290.9 2021 €M 2021 11.2 85.5 96.7 At March 31, 2020 EM 1,553.1 489.8 546.5 2,589.4 13,806 1,906 15,702 At March 31, 2020 EM 1,962.3 6,107.2 (7.523.0) 546.5 At March 31, 2020 SM 25.3 464.5 489.8 Year ended March 31, 2020 2019 EM 15.653 2,290 17,942 Staff numbers and costs The average weekly number of staff, including the Executive Director, during the year, analyzed by category, was as follows: 320.8 709.0 1,962.3 2.992.1 2019 EM 1,408.3 287.0 6,914.9 (6.647.9) 1.962.3 2019 (M 20.1 688.9 709.0 2019 At March 31, 2021 the Company had a team of 15,016 aviation professionals (2020: 17,268, 2019: 16,840). 13,911 2,027 15,938 The aggregate payroll costs of these persons were as follows: Staff and related costs Social welfare costs Other pension costs (a) Share based payments (b) 2021 CM 2021. 21. Year ended March 31, 2020 (M 438.4 25.0 5.2 3.6 472.2 (a) Costs in respect of defined-contribution benefit plans and other pension arrangements were €5m in 2021 (2020: €13m; 2019: €9m). Finance expense (b) In the year ended March 31, 2021 the charge in the income statement of €3.6m for share based compensation comprises a charge for the fair value of various share options granted in prior periods, which are being recognized in the income statement in accordance with services rendered. Interest expense Hedge discontinuance and ineffectiveness (see note 13) Government grants and assistance During fiscal year 2021, many European countries in which the Ryanair Group operates made available payroll support schemes. The Group utilized a number of these employment retention schemes to protect jobs within the Group airlines. These schemes were a mix of short term Covid-19 specific programs and long-term schemes linked to social security that existed pre Covid-19. The total amount of payroll supports received by the Group under the various schemes amounted to approximately €84m and are offset against staff costs in the Consolidated Income Statement. 1,039.4 47.5 13.0 7.0 1,106.9 In April 2020, the Group raised £600m unsecured debt for general corporate purposes under the HMT and Bank of England CCFF. The 0.44% interest rate was the prevailing rate for strong BBB rated companies. This debt was subsequently extended in March 2021 for a further 12 months at a 0.46% interest rate. There are no unfulfilled conditions or other contingencies attaching to government assistance at March 31, 2021 EM 2019 (M 929.2 38.5 8.6 7.7 984.0 Year ended March 31, 2020 EM 69.8 227.3 297.1 72.9 407.2 480.1 2019 EM 59.1 59.1 25. Note to cash flow statement The following table outlines the changes in the carrying value of net debt Net debt at beginning of year Changes from financing cashflows Increase in cash and cash equivalents in year, including net foreign exchange differences (Decrease) in financial assets: cash > 3 months Decrease/(increase) in restricted cash Net cash flow from (increase)/decrease in debt Movement in net funds resulting from cash flows Other changes Translation on U.S. dollar denominated debt Adjustment on initial application of IFRS 16 (net of tax) Lease additions Interest expense Movement from other changes Net debt at end of year Analyzed as: Cash and cash equivalents, cash >3 months and restricted cash Total borrowings* Net debt 2021 (M Balance at beginning of year Changes from financing cashflows Net proceeds from shares issued Movement in net funds resulting from cash flows Balance at end of year (403.2) 84.3 (741.7) (0.3) (1.201.5) (1.859.2) 15.7 (25.2) (4.6) (14.1) (2.276.5) 3,150.3 (5.426.8) (2.276.5) *Total borrowings include current and non-current maturities of debt and current and non-current lease liabilities. The following table outlines the changes in the carrying value of share premium: 2021 €M 738.5 423.1 423.1 1,161.6 At March 31, 2020 OM (449.5) 890.8 (277.2) (0.5) (274.4) 338.7 19.7 (140.4) (166.1) (5.6) (292.4) (403.2) 3,808.0 (4.211.2) (403.2) At March 31, 2020 EM 719.4 19.1 19.1 738.5 2019 CM (282.9) 160.6 (646.1) 0.3 322.9 (162.3) (4.3) (4.3) (449.5) 3,194.9 (3.644.4) (449.5) 2019 EM 719.4 719.4 During fiscal year 2021 the Group had cash outflows of Enil relating to the repurchase of ordinary shares (net of stamp duty) (2020: €581m, 2019: €561m), which affected the retained earnings account. Please refer to the Consolidated Statement of Changes in Equity for further detail. The following table outlines the changes in liabilities arising from financing activities: Balance at beginning of year Net cash flow from (increase)/decrease in debt Adjustment on initial application of IFRS 16 (net of tax) Lease additions Interest expense Foreign exchange Balance at end of year Less than one year More than one year 2021 EM (4.211.2) (1,201.5) - (25.2) (4.6) 15.7 (5,426.8) At March 31, 2020 €M (3,644.4) (274.4) (140.4) (166.1) (5.6) 19.7 (4,211,2) (1,778.4) (457.3) (3,648.4) (3,753.9) (5,426.8) (4,211.2) 2019 EM (3.963.0) 322.9 (4.3) (3.644.4) (309.4) (3.335.0) (3,644.4) Refer to the extracts from the Ryanair's Annual Report included in the exam materials for answering questions in this section. You shall treat Question 9 and Question 10 as independent questions. Show your calculation workings clearly. If some information necessary for solving the questions is not provided and cannot be inferred from the data provided, you shall make relevant assumptions explicitly and state them clearly. Keep your answer concise and relevant; including irrelevant information in your answer will not contribute to your marks. Answers can be given to one or two decimal places as appropriate. Question 9 As a Low-Cost Airline, Ryanair has been greatly affected by the COVID-19 Pandemic. Refer to the excerpt from then CEOs commentary for background to the issues that they have faced. Required: (a) Using the information in the Income Statement and CEO's report, provide relevant ratio analysis (including ROE), comparatives with the previous two years and commentary on how Ryanair's performance has been impacted by the Covid Pandemic during 2020/21. Use year-end balance sheet information where required. (15 marks) (b) The CEO asserts that: "Our teams have conducted detailed negotiations with all our core suppliers of aircraft, engines, airports, handling, maintenance & engineering to adjust our cost base to reflect this unforeseen collapse in flights and traffic over the last year. The success of these discussions allowed our Group to right size our cost base, demonstrated that a huge majority of Ryanair's costs are variable rather than "fixed" like many of our competitors who survive only because they received multibillion-euro packages of State Aid" Do you believe the CEO's assertion that a "huge majority of Ryanair's costs are variable rather than fixed is reasonable? Include appropriate analysis to support your views focusing on operating costs. (10 marks) (c) Reviewing all the information provided for Ryanair identify items that management might identify in order to normalize profits in the year 2021. (7 Marks) (d) Calculate Ryanair's Net operating profit/loss after tax ("NOPAT") for the years 2020 and 2021. Assume a marginal rate of tax of 20% in your analysis and ignore derivative/hedging balances in your calculations. (8 marks) Operating revenues Scheduled revenues Ancillary revenues Total operating revenues Operating expenses Depreciation Fuel and oil Staff costs Airport and handling charges Maintenance, materials and repairs Marketing, distribution and other Route charges Aircraft rentals Total operating expenses Operating (loss)/profit Other income/(expense) Finance expense Finance income Foreign exchange gain/(loss) Gain on sale of associate Share of associate losses Total other expenses (Loss)/profit before tax Consolidated Income Statement Tax credit/(expense) (Loss)/profit for the year - all attributable to equity holders of parent Basic (loss)/earnings per ordinary share (€) Diluted (loss)/earnings per ordinary share (€) Number of weighted average ordinary shares (in Ms) Number of weighted average diluted shares (in Ms) On behalf of the Board Stan McCarthy Chairman July 23, 2021 Note 18 18 18 2&3 19 21 14 23 23 23 23 2021 CM Michael O'Leary Group CEO Year ended March 31, 2020 CM 1,036.0 599.8 1,635.8 (571.0) (542.6) (472.2) (287.2) (206.7) (201.5) (187.3) (6.7) (2,475.2) (839.4) (297.1) 16.0 11.8 (269.3) (1.108.7) 93.6 (1,015.1) (0.9142) (0.9142) 1,110.4 1,110.4 The accompanying notes are an integral part of the consolidated financial statements. 5,566.2 2.928.6 8,494.8 (748.7) (2,762.2) (1.106.9) (1.140.2) (256.4) (578.8) (736.0) (38.2) (7.367.4) 1,127.4 (480.1) 21.4 1.6 (457.1) 670.3 (21.6) 648.7 0.5824 0.5793 1,113.8 1,119.8 2019 (M 5,261.1 2,436.3 7,697.4 (640.5) (2,427.3) (984.0) (1.061.5) (190.9) (547.3) (745.2) (83.9) (6.680.6) 1,016.8 (59.1) 3.7 (3.5) 6.0 (15.8) (68.7) 948.1 (63.1) 885.0 0.7739 0.7665 1,143.6 1,154.6 Non-current assets Property, plant and equipment Right of use assets Intangible assets Derivative financial instruments Other assets Deferred tax Total non-current assets Current assets Inventories Other assets Current tax Assets held for sale Trade receivables Derivative financial instruments Restricted cash Financial assets: cash > 3 months Cash and cash equivalents Total current assets Total assets Current liabilities Provisions Trade payables Accrued expenses and other liabilities Current lease liability Current maturities of debt Current tax Derivative financial instruments Total current liabilities Non-current liabilities Provisions Trade payables Derivative financial instruments Deferred tax Non-current lease liability Non-current maturities of debt Total non-current liabilities Shareholders' equity Issued share capital Share premium account Other undenominated capital Retained earnings Other reserves Shareholders' equity Total liabilities and shareholders' equity On behalf of the Board Stan McCarthy Chairman July 23, 2021 Consolidated Balance Sheet Note 23337N 13 14 674893ORM 14 13 10 13 13 15 WHWW NG 11 12 3 13 14 13 R13433 15 11 16 16 17 2021 EM Michael O'Leary Group CEO 8,361.1 188.2 146.4 111.3 48.7 14.0 8,869.7 3.6 179.8 18.6 106.0 34.1 465.5 2.650.7 3,458.3 12,328.0 10.3 336.0 1,274.9 52.5 1,725.9 48.1 79.2 3,526.9 47.4 179.9 6.4 272.4 130.6 3,517.8 4,154.5 6.7 1,161.6 3.5 3,232.3 242.5 4,646.6 12.328.0 The accompanying notes are an integral part of the consolidated financial statements. At March 31, 2020 EM 9,438.0 236.8 146.4 378.5 53.6 10.253.3 3.3 178.7 44.5 98.7 67.5 293.2 34.4 1,207.2 2,566.4 4,493.9 14,747.2 43.3 1,368.2 2,589.4 75.0 382.3 1,050.0 5,508.2 36.6 180.5 353.5 170.9 3,583.0 4,324.5 6.5 738.5 3.5 4,245.0 (79.0) 4,914.5 14,747.2 2019 EM 9,029.6 146.4 227.5 43.2 9,446.7 2.9 238.0 59.5 308.7 34.9 1.484.4 1,675.6 3,804.0 13,250.7 573.8 2,992.1 309.4 31.6 189.7 4,096.6 135.6 8.0 460.6 3,335.0 3,939.2 6.8 719.4 3.2 4,181.9 303.6 5.214.9 13,250.7 Operating activities (Loss)/profit after tax Adjustments to reconcile profit after tax to net cash provided by operating activities Depreciation (Increase)/decrease in inventories Tax (credit)/expense on (loss)/profit Share-based payments Decrease/(increase) in trade receivables Increase/(decrease) in other assets Decrease/(increase) in trade payables (Decrease)/increase in accrued expenses & other liabilities (Decrease) in other creditors (Decrease) in provisions Decrease/(increase) in finance income (Decrease) in finance expense Gain on sale of associate Share of associate losses Consolidated Statement of Cash Flows Hedge ineffectiveness/foreign exchange Income tax refunded/(paid) Net cash (used in)/provided by operating activities Investing activities Capital expenditure-purchase of property, plant and equipment Supplier reimbursements for property, plant and equipment Proceeds from sale of property, plant and equipment Decrease/(increase) in restricted cash Decrease in financial assets: cash > 3 months Acquisition of subsidiary (net of cash acquired) Investment in associate Net cash provided by/(used in) investing activities Financing activities Shareholder returns (net of tax) Net proceeds from shares issued Proceeds from borrowings Repayments of borrowings Lease liabilities paid Net cash provided by/(used in) financing activities Increase in cash and cash equivalents Net foreign exchange differences Cash and cash equivalents at beginning of year Cash and cash equivalents at end of year Interest income received Interest expense paid Note Included in the cash flows from operating activities for the year are the following amounts: 2&3 6 14 19 9 15 14 2 10 13 13 25 13 2021 EM Year ended March 31, 2020 Restated EM (1,015.1) 571.0 (0.3) (93.6) 3.6 48.9 (3.5) (407.6) (1,318.8) (21.9) (3.7) (294.1) 87.1 (2.448.0) (294.7) 377.6 112.1 0.3 741.7 937.0 421.0 2.228.6 (950.3) (76.8) 1,622.5 111.5 (27.2) 2,566.4 2.650.7 *Includes amendments to trade payables and capital expenditure. See note 1 (vi) for further detail 648.7 748.7 (0.4) 21.6 7.0 (8.1) 61.9 15.2 (401.4) (55.7) 29 407.2 (120.5) 1,327.1 (578.8) 0.5 277.2 (301.1) (580.5) 19.1 750.0 (408.1) (67.5) (287.0) 739.0 151.8 1,675.6 2.566.4 0.2 (59.2) The accompanying notes are an integral part of the consolidated financial statements. 24.4 (74.3) 2019 Restated EM 885.0 640.5 0.8 63.1 7.7 (1.9) (2.1) 66.0 198.6 (2.8) (2.5) (0.5) (1.5) (6.0) 15.8 (100.9) 1,759.3 (1,288.5) (0.3) 646.1 (86.5) (15.0) (744.2) (531.6) 99.9 (422.8) (854.5) 160.6 1,515.0 1,675.6 3.2 (60.6) Trade receivables Trade receivables Allowance for impairment All amounts fall due within one year. 10. 2021 (M 18.6 18.6 Trade payables - Current Trade payables - Non-current At March 31, 2020 (M 67.5 2021 EM 67.5 There has been no change to the allowance for impairment during the year (2020: Enil; 2019: Énil). There were no bad debt write-offs in the year (2020: Enil; 2019: Enil). 336.0 179.9 515.9 At March 31, 2021, €1.0m (2020: €3.3m; 2019: €0.8m) of the total accounts receivable balance were past due, of which Enil (2020: Enil; 2019: €0.1m) was impaired and Enil (2020: €3.3m; 2019: €0.6m) was considered past due but not impaired for which the expected credit loss was considered immaterial. Restricted cash Restricted cash consists of approximately €34m (2020: €34m; 2019: €35m) placed in escrow accounts for certain legal cases and appeals (which accounts for the majority of the balance). 11. Trade payables 2019 EM At March 31, 2020 EM 59.6 1,368.2 (0.1) 59.5 1,368.2 2019 €M 573.8 573.8 During the year ended March 31, 2021, the Group revised its 2014 agreement with Boeing which resulted in a reversal of certain pre-delivery trade payables of €497m. Refer to note 2 to the consolidated financial statements for further details. *In December 2020, the Group revised its 2014 agreement with Boeing to increase its firm orders with Boeing from 135 to 210. The terms of this agreement are confidential, but it sets out a restructured payment schedule over the delivery period from June 2021 to December 2024. This has resulted in a reversal of certain pre-delivery trade payables of approximately €497m and the related amount capitalized into PPE. In addition, the €378m reimbursements related to reasonable, and fair, compensation agreed with Boeing for the 2-year delivery delay of the Boeing 737-8200 aircraft is recorded as a reduction in PPE. 12. Accrued expenses and other liabilities Accruals Indirect tax and duties Unearned revenue (contract liabilities) Contract liabilities comprises: Opening contract liabilities IFRS 15 transition adjustment Revenue deferred during the year Revenue recognized during the year Closing contract liabilities 19. Indirect tax and duties comprise: PAYE (payroll taxes) Other tax (principally air passenger duty in various countries) 2021 €M Flight and cabin crew Sales, aparatinne, management and administration Average 887.3 96.7 290.9 1.274.9 2021 EM 546.5 1,248.0 (1,503.6) 290.9 2021 €M 2021 11.2 85.5 96.7 At March 31, 2020 EM 1,553.1 489.8 546.5 2,589.4 13,806 1,906 15,702 At March 31, 2020 EM 1,962.3 6,107.2 (7.523.0) 546.5 At March 31, 2020 SM 25.3 464.5 489.8 Year ended March 31, 2020 2019 EM 15.653 2,290 17,942 Staff numbers and costs The average weekly number of staff, including the Executive Director, during the year, analyzed by category, was as follows: 320.8 709.0 1,962.3 2.992.1 2019 EM 1,408.3 287.0 6,914.9 (6.647.9) 1.962.3 2019 (M 20.1 688.9 709.0 2019 At March 31, 2021 the Company had a team of 15,016 aviation professionals (2020: 17,268, 2019: 16,840). 13,911 2,027 15,938 The aggregate payroll costs of these persons were as follows: Staff and related costs Social welfare costs Other pension costs (a) Share based payments (b) 2021 CM 2021. 21. Year ended March 31, 2020 (M 438.4 25.0 5.2 3.6 472.2 (a) Costs in respect of defined-contribution benefit plans and other pension arrangements were €5m in 2021 (2020: €13m; 2019: €9m). Finance expense (b) In the year ended March 31, 2021 the charge in the income statement of €3.6m for share based compensation comprises a charge for the fair value of various share options granted in prior periods, which are being recognized in the income statement in accordance with services rendered. Interest expense Hedge discontinuance and ineffectiveness (see note 13) Government grants and assistance During fiscal year 2021, many European countries in which the Ryanair Group operates made available payroll support schemes. The Group utilized a number of these employment retention schemes to protect jobs within the Group airlines. These schemes were a mix of short term Covid-19 specific programs and long-term schemes linked to social security that existed pre Covid-19. The total amount of payroll supports received by the Group under the various schemes amounted to approximately €84m and are offset against staff costs in the Consolidated Income Statement. 1,039.4 47.5 13.0 7.0 1,106.9 In April 2020, the Group raised £600m unsecured debt for general corporate purposes under the HMT and Bank of England CCFF. The 0.44% interest rate was the prevailing rate for strong BBB rated companies. This debt was subsequently extended in March 2021 for a further 12 months at a 0.46% interest rate. There are no unfulfilled conditions or other contingencies attaching to government assistance at March 31, 2021 EM 2019 (M 929.2 38.5 8.6 7.7 984.0 Year ended March 31, 2020 EM 69.8 227.3 297.1 72.9 407.2 480.1 2019 EM 59.1 59.1 25. Note to cash flow statement The following table outlines the changes in the carrying value of net debt Net debt at beginning of year Changes from financing cashflows Increase in cash and cash equivalents in year, including net foreign exchange differences (Decrease) in financial assets: cash > 3 months Decrease/(increase) in restricted cash Net cash flow from (increase)/decrease in debt Movement in net funds resulting from cash flows Other changes Translation on U.S. dollar denominated debt Adjustment on initial application of IFRS 16 (net of tax) Lease additions Interest expense Movement from other changes Net debt at end of year Analyzed as: Cash and cash equivalents, cash >3 months and restricted cash Total borrowings* Net debt 2021 (M Balance at beginning of year Changes from financing cashflows Net proceeds from shares issued Movement in net funds resulting from cash flows Balance at end of year (403.2) 84.3 (741.7) (0.3) (1.201.5) (1.859.2) 15.7 (25.2) (4.6) (14.1) (2.276.5) 3,150.3 (5.426.8) (2.276.5) *Total borrowings include current and non-current maturities of debt and current and non-current lease liabilities. The following table outlines the changes in the carrying value of share premium: 2021 €M 738.5 423.1 423.1 1,161.6 At March 31, 2020 OM (449.5) 890.8 (277.2) (0.5) (274.4) 338.7 19.7 (140.4) (166.1) (5.6) (292.4) (403.2) 3,808.0 (4.211.2) (403.2) At March 31, 2020 EM 719.4 19.1 19.1 738.5 2019 CM (282.9) 160.6 (646.1) 0.3 322.9 (162.3) (4.3) (4.3) (449.5) 3,194.9 (3.644.4) (449.5) 2019 EM 719.4 719.4 During fiscal year 2021 the Group had cash outflows of Enil relating to the repurchase of ordinary shares (net of stamp duty) (2020: €581m, 2019: €561m), which affected the retained earnings account. Please refer to the Consolidated Statement of Changes in Equity for further detail. The following table outlines the changes in liabilities arising from financing activities: Balance at beginning of year Net cash flow from (increase)/decrease in debt Adjustment on initial application of IFRS 16 (net of tax) Lease additions Interest expense Foreign exchange Balance at end of year Less than one year More than one year 2021 EM (4.211.2) (1,201.5) - (25.2) (4.6) 15.7 (5,426.8) At March 31, 2020 €M (3,644.4) (274.4) (140.4) (166.1) (5.6) 19.7 (4,211,2) (1,778.4) (457.3) (3,648.4) (3,753.9) (5,426.8) (4,211.2) 2019 EM (3.963.0) 322.9 (4.3) (3.644.4) (309.4) (3.335.0) (3,644.4)
Expert Answer:
Answer rating: 100% (QA)
To answer the questions accurately I need to address each part one by one a For the Return on Equity ROE calculation we use the net income available to common shareholders divided by the average share... View the full answer

Related Book For 

Income Tax Fundamentals 2013
ISBN: 9781285586618
31st Edition
Authors: Gerald E. Whittenburg, Martha Altus Buller, Steven L Gill
Posted Date:
Students also viewed these finance questions
-
What discount rate would ensure a sustainable harvest is set to Maximum Sustainable Yield?
-
List three specific parts of the Case Guide, Objectives and Strategy Section (See below) that you had the most difficulty understanding. Describe your current understanding of these parts. Provide...
-
Planning is one of the most important management functions in any business. A front office managers first step in planning should involve determine the departments goals. Planning also includes...
-
please help with the entire question asap please thank you!! 12. ABC Manufacturing Company has the following data for 2024 (amounts in millions): EIE (Cick the icon to viow the information.) Prepare...
-
Capaz Company completed its income statement and balance sheet for 2012 and provided the following information: In addition, Capaz bought a small service machine for $5,000. Required: 1. Present the...
-
Best Electronics Inc. offers a no hassle returns policy. The daily number of customers returning items follows the normal distribution. The mean number of customers returning items is 10.3 per day...
-
Identify the critical areas of a projects supply chain.
-
Required Use the following information to prepare a multistep income statement and a balance sheet for Sherman Equipment Co. for 2016. Salaries Expense$ ............. 69,000 Common Stock...
-
Shown below is D. Diesel Company's adjusted trial balance at the end of its annual accounting period (December 31, 2022). Account Debit Credit Cash $15,000 Accounts Receivable 15,000 Office Supplies...
-
On January 1, 2023, Logan Limited had shares outstanding as follows: 6% cumulative preferred shares, $100 par value, 10,000 shares issued and outstanding $1,000,000 Common shares, 200,000 shares...
-
WH2 differ between Initial public offerings and Public offerings WH3 differ between Primary market and secondary market WH4: What are the market orders and give examples
-
Using the direct stiffness method, determine the reactions at the supports. Draw shear & moment diagrams. Members are axially rigid. While recovering the member internal forces, first use slope...
-
Show the earthwork distribution on mass diagram and representative profile if (!..): a) 1400 m (10p) b) Bruckner (10p) Write down all the equations.
-
Using Find Bugs Description: Locating and fixing software defects (bugs) is one of the most expensive tasks involved in software development. Because of this, software projects benefit greatly from...
-
a UML diagram for the project based on the resources provided and also your inputs . JAVA: Complete the below project in JAVA coding. The basic system components. Jukebox CD Song Artist Playlist...
-
You are the manager of both John and Martha. John has a resentment toward Martha. John has been monitoring Martha's every move for about 3 months, but you just found out about it last week. John...
-
Easements and covenants both impact how a piece of private property can be used by the landowner. How are these arrangements similar and how do they differ? How are they treated in legislation?
-
ABC company leased new advanced computer equipment to STU Ltd on 1 January 2019.STULtd has to pay annual rental of $290,000 starting at 1 January 2019. It is a four years lease with ultimate rental...
-
The following additional information is available for the Dr. Ivan and Irene Incisor family from Chapters 1-7. Ivan sold the following securities during the year and received a Form 1099-B that...
-
Cypress Corporation has regular taxable income of $170,000 (assume annual gross receipts are greater than $5 million) and regular tax liability of $49,550 for 2012. The corporation also has tax...
-
If Charles, a 16-year-old child model, earns $50,000 a year and is completely self supporting even though he lives with his parents, can his parents claim him as a dependent? Why or why not?...
-
All public charities are nonprofits, but not all nonprofits are public charities. How do you explain that?
-
Nonprofit organizations are defined as private organizations that must use any profits for future operations. Is nonprofit organization a good name for this group of organizations? Can you think of...
-
How do you account for the varying perceptions of the human service subsector from colonial days to the present?

Study smarter with the SolutionInn App