

Consider the following actual FY2019 data and a forecast of FY2020 selected balance sheet and income...
Fantastic news! We've Found the answer you've been seeking!
Question:
Transcribed Image Text:
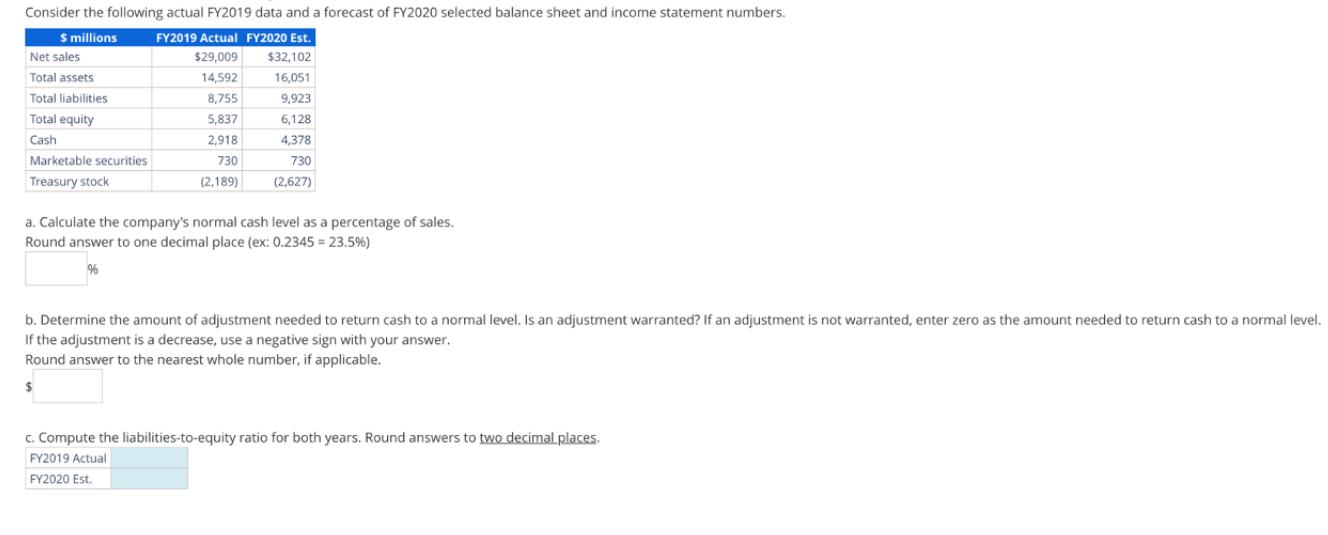
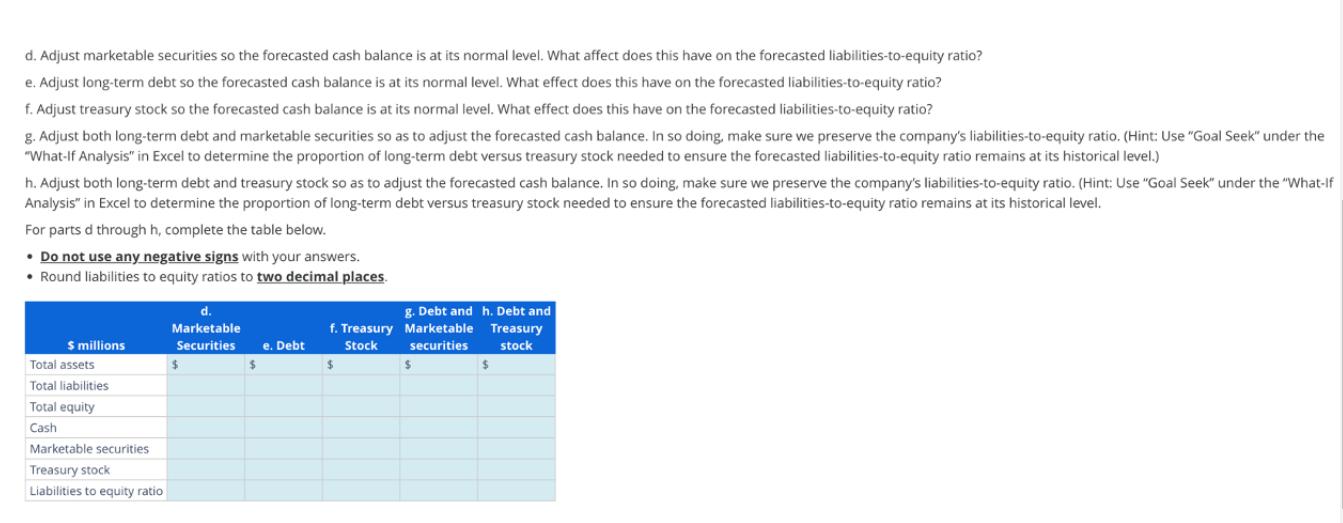
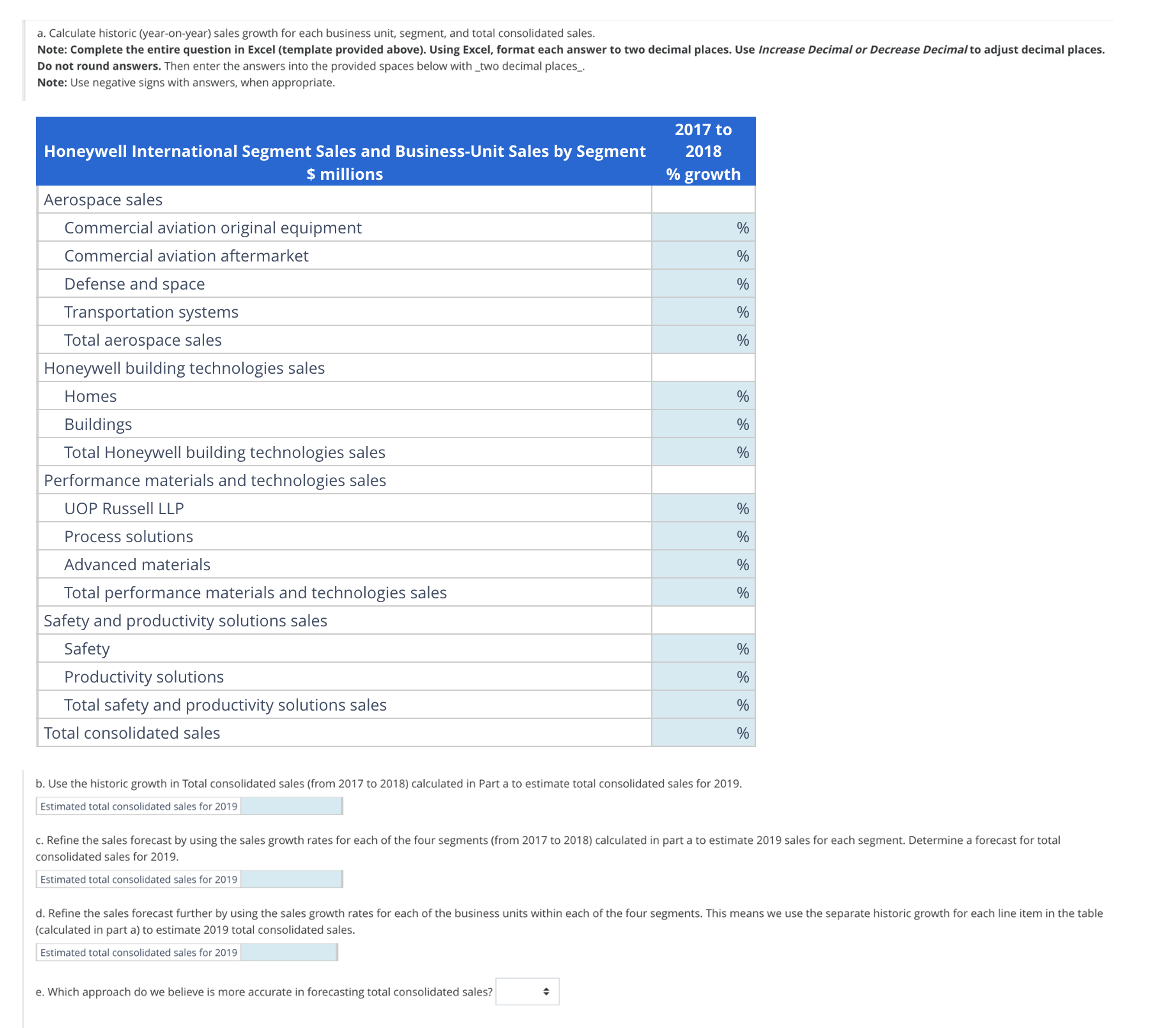
Consider the following actual FY2019 data and a forecast of FY2020 selected balance sheet and income statement numbers. $ millions FY2019 Actual FY2020 Est. $29,009 $32,102 14,592 16,051 8,755 9,923 5,837 6,128 2,918 4,378 730 730 (2,189) (2,627) Net sales Total assets Total liabilities Total equity Cash Marketable securities Treasury stock a. Calculate the company's normal cash level as a percentage of sales. Round answer to one decimal place (ex: 0.2345= 23.5%) % b. Determine the amount of adjustment needed to return cash to a normal level. Is an adjustment warranted? If an adjustment is not warranted, enter zero as the amount needed to return cash to a normal level. If the adjustment is a decrease, use a negative sign with your answer. Round answer to the nearest whole number, if applicable. $ c. Compute the liabilities-to-equity ratio for both years. Round answers to two decimal places. FY2019 Actual FY2020 Est. d. Adjust marketable securities so the forecasted cash balance is at its normal level. What affect does this have on the forecasted liabilities-to-equity ratio? e. Adjust long-term debt so the forecasted cash balance is at its normal level. What effect does this have on the forecasted liabilities-to-equity ratio? f. Adjust treasury stock so the forecasted cash balance is at its normal level. What effect does this have on the forecasted liabilities-to-equity ratio? g. Adjust both long-term debt and marketable securities so as to adjust the forecasted cash balance. In so doing, make sure we preserve the company's liabilities-to-equity ratio. (Hint: Use "Goal Seek" under the "What-If Analysis" in Excel to determine the proportion of long-term debt versus treasury stock needed to ensure the forecasted liabilities-to-equity ratio remains at its historical level.) h. Adjust both long-term debt and treasury stock so as to adjust the forecasted cash balance. In so doing, make sure we preserve the company's liabilities-to-equity ratio. (Hint: Use "Goal Seek" under the "What-if Analysis" in Excel to determine the proportion of long-term debt versus treasury stock needed to ensure the forecasted liabilities-to-equity ratio remains at its historical level. For parts d through h, complete the table below. • Do not use any negative signs with your answers. • Round liabilities to equity ratios to two decimal places. $ millions Total assets Total liabilities Total equity Cash Marketable securities Treasury stock Liabilities to equity ratio d. Marketable Securities e. Debt $ f. Treasury Stock $ g. Debt and h. Debt and Marketable Treasury securities stock $ $ a. Calculate historic (year-on-year) sales growth for each business unit, segment, and total consolidated sales. Note: Complete the entire question in Excel (template provided above). Using Excel, format each answer to two decimal places. Use Increase Decimal or Decrease Decimal to adjust decimal places. Do not round answers. Then enter the answers into the provided spaces below with two decimal places_. Note: Use negative signs with answers, when appropriate. Honeywell International Segment Sales and Business-Unit Sales by Segment $ millions Aerospace sales Commercial aviation original equipment Commercial aviation aftermarket Defense and space Transportation systems Total aerospace sales Honeywell building technologies sales Homes Buildings Total Honeywell building technologies sales Performance materials and technologies sales UOP Russell LLP Process solutions Advanced materials Total performance materials and technologies sales Safety and productivity solutions sales Safety Productivity solutions Total safety and productivity solutions sales. Total consolidated sales 2017 to 2018 % growth % % % % % e. Which approach do we believe is more accurate in forecasting total consolidated sales? % % % + % % % % % % % b. Use the historic growth in Total consolidated sales (from 2017 to 2018) calculated in Part a to estimate total consolidated sales for 2019. Estimated total consolidated sales for 2019 % c. Refine the sales forecast by using the sales growth rates for each of the four segments (from 2017 to 2018) calculated in part a to estimate 2019 sales for each segment. Determine a forecast for total consolidated sales for 2019. Estimated total consolidated sales for 2019 d. Refine the sales forecast further by using the sales growth rates for each of the business units within each of the four segments. This means we use the separate historic growth for each line item in the table (calculated in part a) to estimate 2019 total consolidated sales. Estimated total consolidated sales for 2019 Consider the following actual FY2019 data and a forecast of FY2020 selected balance sheet and income statement numbers. $ millions FY2019 Actual FY2020 Est. $29,009 $32,102 14,592 16,051 8,755 9,923 5,837 6,128 2,918 4,378 730 730 (2,189) (2,627) Net sales Total assets Total liabilities Total equity Cash Marketable securities Treasury stock a. Calculate the company's normal cash level as a percentage of sales. Round answer to one decimal place (ex: 0.2345= 23.5%) % b. Determine the amount of adjustment needed to return cash to a normal level. Is an adjustment warranted? If an adjustment is not warranted, enter zero as the amount needed to return cash to a normal level. If the adjustment is a decrease, use a negative sign with your answer. Round answer to the nearest whole number, if applicable. $ c. Compute the liabilities-to-equity ratio for both years. Round answers to two decimal places. FY2019 Actual FY2020 Est. Consider the following actual FY2019 data and a forecast of FY2020 selected balance sheet and income statement numbers. $ millions FY2019 Actual FY2020 Est. $29,009 $32,102 14,592 16,051 8,755 9,923 5,837 6,128 2,918 4,378 730 730 (2,189) (2,627) Net sales Total assets Total liabilities Total equity Cash Marketable securities Treasury stock a. Calculate the company's normal cash level as a percentage of sales. Round answer to one decimal place (ex: 0.2345= 23.5%) % b. Determine the amount of adjustment needed to return cash to a normal level. Is an adjustment warranted? If an adjustment is not warranted, enter zero as the amount needed to return cash to a normal level. If the adjustment is a decrease, use a negative sign with your answer. Round answer to the nearest whole number, if applicable. $ c. Compute the liabilities-to-equity ratio for both years. Round answers to two decimal places. FY2019 Actual FY2020 Est. d. Adjust marketable securities so the forecasted cash balance is at its normal level. What affect does this have on the forecasted liabilities-to-equity ratio? e. Adjust long-term debt so the forecasted cash balance is at its normal level. What effect does this have on the forecasted liabilities-to-equity ratio? f. Adjust treasury stock so the forecasted cash balance is at its normal level. What effect does this have on the forecasted liabilities-to-equity ratio? g. Adjust both long-term debt and marketable securities so as to adjust the forecasted cash balance. In so doing, make sure we preserve the company's liabilities-to-equity ratio. (Hint: Use "Goal Seek" under the "What-If Analysis" in Excel to determine the proportion of long-term debt versus treasury stock needed to ensure the forecasted liabilities-to-equity ratio remains at its historical level.) h. Adjust both long-term debt and treasury stock so as to adjust the forecasted cash balance. In so doing, make sure we preserve the company's liabilities-to-equity ratio. (Hint: Use "Goal Seek" under the "What-if Analysis" in Excel to determine the proportion of long-term debt versus treasury stock needed to ensure the forecasted liabilities-to-equity ratio remains at its historical level. For parts d through h, complete the table below. • Do not use any negative signs with your answers. • Round liabilities to equity ratios to two decimal places. $ millions Total assets Total liabilities Total equity Cash Marketable securities Treasury stock Liabilities to equity ratio d. Marketable Securities e. Debt $ f. Treasury Stock $ g. Debt and h. Debt and Marketable Treasury securities stock $ $ d. Adjust marketable securities so the forecasted cash balance is at its normal level. What affect does this have on the forecasted liabilities-to-equity ratio? e. Adjust long-term debt so the forecasted cash balance is at its normal level. What effect does this have on the forecasted liabilities-to-equity ratio? f. Adjust treasury stock so the forecasted cash balance is at its normal level. What effect does this have on the forecasted liabilities-to-equity ratio? g. Adjust both long-term debt and marketable securities so as to adjust the forecasted cash balance. In so doing, make sure we preserve the company's liabilities-to-equity ratio. (Hint: Use "Goal Seek" under the "What-If Analysis" in Excel to determine the proportion of long-term debt versus treasury stock needed to ensure the forecasted liabilities-to-equity ratio remains at its historical level.) h. Adjust both long-term debt and treasury stock so as to adjust the forecasted cash balance. In so doing, make sure we preserve the company's liabilities-to-equity ratio. (Hint: Use "Goal Seek" under the "What-if Analysis" in Excel to determine the proportion of long-term debt versus treasury stock needed to ensure the forecasted liabilities-to-equity ratio remains at its historical level. For parts d through h, complete the table below. • Do not use any negative signs with your answers. • Round liabilities to equity ratios to two decimal places. $ millions Total assets Total liabilities Total equity Cash Marketable securities Treasury stock Liabilities to equity ratio d. Marketable Securities e. Debt $ f. Treasury Stock $ g. Debt and h. Debt and Marketable Treasury securities stock $ $ a. Calculate historic (year-on-year) sales growth for each business unit, segment, and total consolidated sales. Note: Complete the entire question in Excel (template provided above). Using Excel, format each answer to two decimal places. Use Increase Decimal or Decrease Decimal to adjust decimal places. Do not round answers. Then enter the answers into the provided spaces below with two decimal places_. Note: Use negative signs with answers, when appropriate. Honeywell International Segment Sales and Business-Unit Sales by Segment $ millions Aerospace sales Commercial aviation original equipment Commercial aviation aftermarket Defense and space Transportation systems Total aerospace sales Honeywell building technologies sales Homes Buildings Total Honeywell building technologies sales Performance materials and technologies sales UOP Russell LLP Process solutions Advanced materials Total performance materials and technologies sales Safety and productivity solutions sales Safety Productivity solutions Total safety and productivity solutions sales. Total consolidated sales 2017 to 2018 % growth % % % % % e. Which approach do we believe is more accurate in forecasting total consolidated sales? % % % + % % % % % % % b. Use the historic growth in Total consolidated sales (from 2017 to 2018) calculated in Part a to estimate total consolidated sales for 2019. Estimated total consolidated sales for 2019 % c. Refine the sales forecast by using the sales growth rates for each of the four segments (from 2017 to 2018) calculated in part a to estimate 2019 sales for each segment. Determine a forecast for total consolidated sales for 2019. Estimated total consolidated sales for 2019 d. Refine the sales forecast further by using the sales growth rates for each of the business units within each of the four segments. This means we use the separate historic growth for each line item in the table (calculated in part a) to estimate 2019 total consolidated sales. Estimated total consolidated sales for 2019 a. Calculate historic (year-on-year) sales growth for each business unit, segment, and total consolidated sales. Note: Complete the entire question in Excel (template provided above). Using Excel, format each answer to two decimal places. Use Increase Decimal or Decrease Decimal to adjust decimal places. Do not round answers. Then enter the answers into the provided spaces below with two decimal places_. Note: Use negative signs with answers, when appropriate. Honeywell International Segment Sales and Business-Unit Sales by Segment $ millions Aerospace sales Commercial aviation original equipment Commercial aviation aftermarket Defense and space Transportation systems Total aerospace sales Honeywell building technologies sales Homes Buildings Total Honeywell building technologies sales Performance materials and technologies sales UOP Russell LLP Process solutions Advanced materials Total performance materials and technologies sales Safety and productivity solutions sales Safety Productivity solutions Total safety and productivity solutions sales. Total consolidated sales 2017 to 2018 % growth % % % % % e. Which approach do we believe is more accurate in forecasting total consolidated sales? % % % + % % % % % % % b. Use the historic growth in Total consolidated sales (from 2017 to 2018) calculated in Part a to estimate total consolidated sales for 2019. Estimated total consolidated sales for 2019 % c. Refine the sales forecast by using the sales growth rates for each of the four segments (from 2017 to 2018) calculated in part a to estimate 2019 sales for each segment. Determine a forecast for total consolidated sales for 2019. Estimated total consolidated sales for 2019 d. Refine the sales forecast further by using the sales growth rates for each of the business units within each of the four segments. This means we use the separate historic growth for each line item in the table (calculated in part a) to estimate 2019 total consolidated sales. Estimated total consolidated sales for 2019
Expert Answer:
Answer rating: 100% (QA)
SOLUTION Here are the answers based on the provided data a Historic Sales Growth Rates 20172018 Aerospace sales Commercial aviation original equipment ... View the full answer

Related Book For 

Horngrens Financial and Managerial Accounting
ISBN: 978-0133866292
5th edition
Authors: Tracie L. Nobles, Brenda L. Mattison, Ella Mae Matsumura
Posted Date:
Students also viewed these accounting questions
-
The following additional information is available for the Dr. Ivan and Irene Incisor family from Chapters 1-5. Ivan's grandfather died and left a portfolio of municipal bonds. In 2012, they pay Ivan...
-
Annapolis Company purchased a $2,000, 7%, 9-year bond at 99 and held it to maturity. The straight line method of amortization is used for both premiums & discounts. What is the net cash received...
-
How do you ensure data quality?
-
What benefits does Cemex bring to host countries? How have the company's investments in foreign markets contributed to its ability to be a leader in the global cement industry?
-
In Problem if it is possible to solve for y in terms of x, do so. If not, write Impossible. y 2 + e x y + x 3 = 0
-
Daphne Brown-Wright worked as a teacher for East St. Louis School District 189 from 1975 until 1998 and then returned as an administrator from 2002 until 2012, thus serving the District for 33...
-
Kaylee James, a connoisseur of fine chocolate, opened Kaylees Sweets in Collegetown on February 1, 2014. The shop specializes in a selection of gourmet chocolate candies and a line of gourmet ice...
-
Describe Edgar F. Codd's accomplishments and contributions to the relational model.?
-
Record the adjusting entry for supplies remaining on hand at the end of the year equal to $3,900. Record the closing entry for revenue. Record the closing entry for expenses. Record the closing entry...
-
Bock describes his preferred interview process, which involves "combining behavioral and situational structured interviews with assessments of cognitive ability, conscientiousness, and leadership."...
-
A person who is 1.45 m tall and has a mass of 70 kg is performing a bicep curl exercise (e.g., elbow flexion and elbow extension) with a dumbbell that is 11 kg. If we assume that the dumbbell is...
-
Introduce yourself to the class by sharing: Who you are and where you're from Your current profession and professional goals Describe your primary and secondary communication style. Your DISC...
-
Discuss how pay as you earn taxation upholds the principle of equitable taxation in Zambia
-
Analyze the complexities involved in implementing advanced real-time operating systems, focusing on issues such as task scheduling precision, interrupt latency, and the application of deterministic...
-
Once the nonprofit organization selects the theme for its new public service campaign, it wants to take all steps to ensure its success. Prior to launch, the organization will conduct a premortem...
-
x? Consider : fe) =e, s)=-x*, f)=xe- f"(x) = x'e ? -e Find for f(x): a) The critical number(s). b) The absolute extreme value(s) if exist. c) The inflection points.
-
Define deferred revenue. Why is it a liability?
-
Parent Furniture Company manufactures and sells oak tables and chairs. Price and cost data for the furniture follow: Parent Furniture has three sales representatives: Archie, Brett, and Cory. Archie...
-
Explain the three basic components of an accounting information system.
-
Utopia Pool Cleaning Service provides pool cleaning services to residential customers. The company has three employees, each assigned to specific customers. The company considers each employees...
-
For the finite square well potential, prove the formula for the transmission coefficient (7.83), calculate \(R\), and prove that \(|R|^{2}+T=1\). Equation 7.83:- T = |S|2 K3 = 42 2(+)2 cos KL + (2 +...
-
Consider an asymmetric potential barrier, with Calculate the tunneling probability \(T\) for energy \(U_{1} U_{0}\). 0, x < 0 U(x) = U> U, 0 < x 0, x > L. (7.96)
-
The data in Table 1 represent the first exam score of 10 students enrolled in Introductory Statistics. Treat the 10 students as a population. (a) Compute the population mean. (b) Find a simple random...

Study smarter with the SolutionInn App