

Remember, the expected value of a probability distribution is a statistical measure of the average (mean)...
Fantastic news! We've Found the answer you've been seeking!
Question:

Transcribed Image Text:
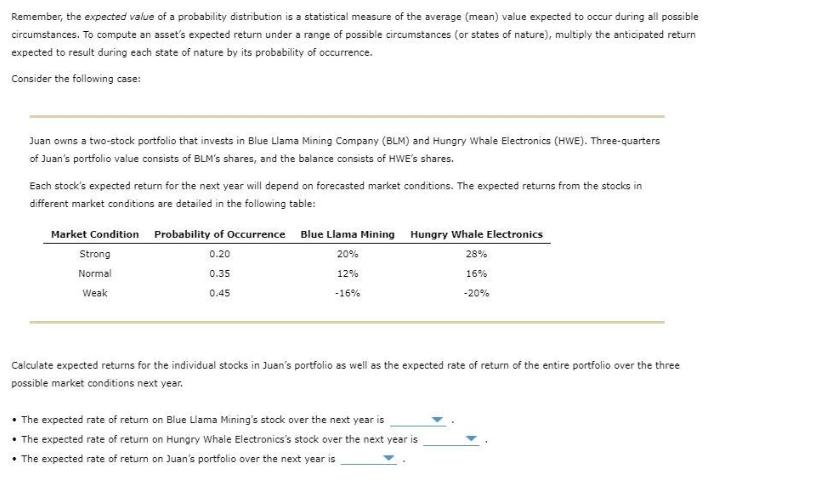
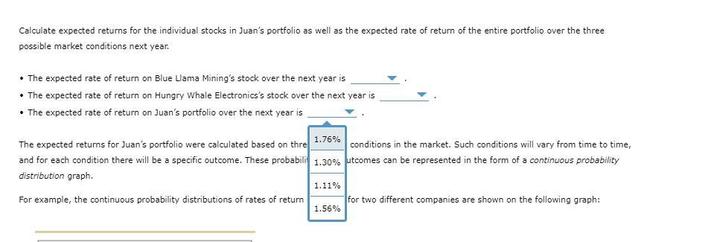
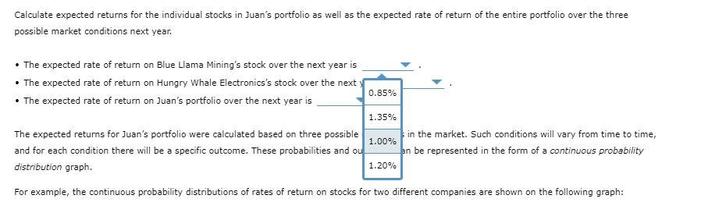
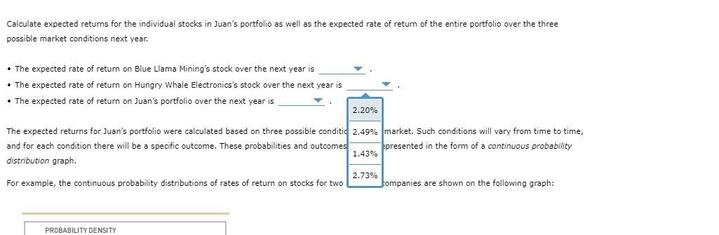
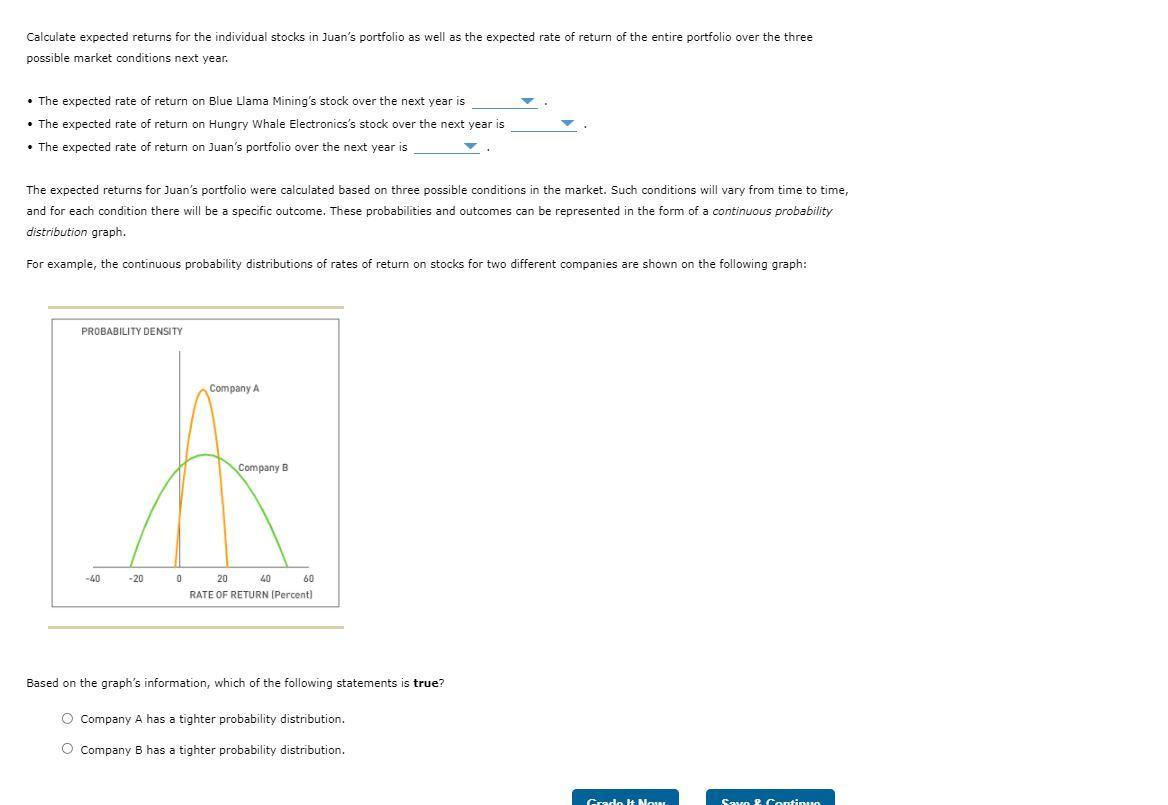
Remember, the expected value of a probability distribution is a statistical measure of the average (mean) value expected to occur during all possible circumstances. To compute an asset's expected return under a range of possible circumstances (or states of nature), multiply the anticipated return expected to result during each state of nature by its probability of occurrence. Consider the following case: Juan owns a two-stock portfolio that invests in Blue Llama Mining Company (BLM) and Hungry Whale Electronics (HWE). Three-quarters of Juan's portfolio value consists of BLM's shares, and the balance consists of HWE's shares. Each stock's expected return for the next year will depend on forecasted market conditions. The expected returns from the stocks in different market conditions are detailed in the following table: Market Condition Probability of Occurrence Blue Llama Mining 0.20 20% 0.35 12% 0.45 -16% Strong Normal Weak Hungry Whale Electronics 28% 16% -20% Calculate expected returns for the individual stocks in Juan's portfolio as well as the expected rate of return of the entire portfolio over the three possible market conditions next year. • The expected rate of return on Blue Liama Mining's stock over the next year is • The expected rate of return on Hungry Whale Electronics's stock over the next year is • The expected rate of return on Juan's portfolio over the next year is Calculate expected returns for the individual stocks in Juan's portfolio as well as the expected rate of return of the entire portfolio over the three possible market conditions next year. • The expected rate of return on Blue Llama Mining's stock over the next year is • The expected rate of return on Hungry Whale Electronics's stock over the next year is • The expected rate of return on Juan's portfolio over the next year is The expected returns for Juan's portfolio were calculated based on thre 1.76% conditions in the market. Such conditions will vary from time to time, and for each condition there will be a specific outcome. These probabili 1.30% utcomes can be represented in the form of a continuous probability distribution graph. For example, the continuous probability distributions of rates of return 1.11% 1.56% for two different companies are shown on the following graph: Calculate expected returns for the individual stocks in Juan's portfolio as well as the expected rate of return of the entire portfolio over the three possible market conditions next year. • The expected rate of return on Blue Llama Mining's stock over the next year is • The expected rate of return on Hungry Whale Electronics's stock over the next • The expected rate of return on Juan's portfolio over the next year is 0.85% 1.35% The expected returns for Juan's portfolio were calculated based on three possible and for each condition there will be a specific outcome. These probabilities and ou distribution graph. For example, the continuous probability distributions of rates of return on stocks for two different companies are shown on the following graph: 1.00% in the market. Such conditions will vary from time to time, an be represented in the form of a continuous probability 1.20% Calculate expected returns for the individual stocks in Juan's portfolio as well as the expected rate of return of the entire portfolio over the three possible market conditions next year. • The expected rate of return on Blue Llama Mining's stock over the next year is • The expected rate of return on Hungry Whale Electronics's stock over the next year is • The expected rate of return on Juan's portfolio over the next year is 2.20% The expected returns for Juan's portfolio were calculated based on three possible conditic 2.49% and for each condition there will be a specific outcome. These probabilities and outcomes distribution graph, 1.43% For example, the continuous probability distributions of rates of return on stocks for two PROBABILITY DENSITY 2.73% market. Such conditions will vary from time to time, presented in the form of a continuous probability tompanies are shown on the following graph: Calculate expected returns for the individual stocks in Juan's portfolio as well as the expected rate of return of the entire portfolio over the three possible market conditions next year. • The expected rate of return on Blue Llama Mining's stock over the next year is • The expected rate of return on Hungry Whale Electronics's stock over the next year is • The expected rate of return on Juan's portfolio over the next year is The expected returns for Juan's portfolio were calculated based on three possible conditions in the market. Such conditions will vary from time to time, and for each condition there will be a specific outcome. These probabilities and outcomes can be represented in the form of a continuous probability distribution graph. For example, the continuous probability distributions of rates of return on stocks for two different companies are shown on the following graph: PROBABILITY DENSITY -40 Company A Company B A 0 20 RATE OF RETURN (Percent) -20 40 60 Based on the graph's information, which of the following statements is true? O Company A has a tighter probability distribution. O Company B has a tighter probability distribution. Grado It Nour Savo & Continuo Calculate expected returns for the individual stocks in Juan's portfolio as well as the expected rate of return of the entire portfolio over the three possible market conditions next year. • The expected rate of return on Blue Llama Mining's stock over the next year is • The expected rate of return on Hungry Whale Electronics's stock over the next year is • The expected rate of return on Juan's portfolio over the next year is 2.20% The expected returns for Juan's portfolio were calculated based on three possible conditic 2.49% and for each condition there will be a specific outcome. These probabilities and outcomes distribution graph, 1.43% For example, the continuous probability distributions of rates of return on stocks for two PROBABILITY DENSITY 2.73% market. Such conditions will vary from time to time, presented in the form of a continuous probability tompanies are shown on the following graph: Remember, the expected value of a probability distribution is a statistical measure of the average (mean) value expected to occur during all possible circumstances. To compute an asset's expected return under a range of possible circumstances (or states of nature), multiply the anticipated return expected to result during each state of nature by its probability of occurrence. Consider the following case: Juan owns a two-stock portfolio that invests in Blue Llama Mining Company (BLM) and Hungry Whale Electronics (HWE). Three-quarters of Juan's portfolio value consists of BLM's shares, and the balance consists of HWE's shares. Each stock's expected return for the next year will depend on forecasted market conditions. The expected returns from the stocks in different market conditions are detailed in the following table: Market Condition Probability of Occurrence Blue Llama Mining 0.20 20% 0.35 12% 0.45 -16% Strong Normal Weak Hungry Whale Electronics 28% 16% -20% Calculate expected returns for the individual stocks in Juan's portfolio as well as the expected rate of return of the entire portfolio over the three possible market conditions next year. • The expected rate of return on Blue Liama Mining's stock over the next year is • The expected rate of return on Hungry Whale Electronics's stock over the next year is • The expected rate of return on Juan's portfolio over the next year is Calculate expected returns for the individual stocks in Juan's portfolio as well as the expected rate of return of the entire portfolio over the three possible market conditions next year. • The expected rate of return on Blue Llama Mining's stock over the next year is • The expected rate of return on Hungry Whale Electronics's stock over the next year is • The expected rate of return on Juan's portfolio over the next year is The expected returns for Juan's portfolio were calculated based on thre 1.76% conditions in the market. Such conditions will vary from time to time, and for each condition there will be a specific outcome. These probabili 1.30% utcomes can be represented in the form of a continuous probability distribution graph. For example, the continuous probability distributions of rates of return 1.11% 1.56% for two different companies are shown on the following graph: Calculate expected returns for the individual stocks in Juan's portfolio as well as the expected rate of return of the entire portfolio over the three possible market conditions next year. • The expected rate of return on Blue Llama Mining's stock over the next year is • The expected rate of return on Hungry Whale Electronics's stock over the next • The expected rate of return on Juan's portfolio over the next year is 0.85% 1.35% The expected returns for Juan's portfolio were calculated based on three possible and for each condition there will be a specific outcome. These probabilities and ou distribution graph. For example, the continuous probability distributions of rates of return on stocks for two different companies are shown on the following graph: 1.00% in the market. Such conditions will vary from time to time, an be represented in the form of a continuous probability 1.20% Calculate expected returns for the individual stocks in Juan's portfolio as well as the expected rate of return of the entire portfolio over the three possible market conditions next year. • The expected rate of return on Blue Llama Mining's stock over the next year is • The expected rate of return on Hungry Whale Electronics's stock over the next year is • The expected rate of return on Juan's portfolio over the next year is 2.20% The expected returns for Juan's portfolio were calculated based on three possible conditic 2.49% and for each condition there will be a specific outcome. These probabilities and outcomes distribution graph, 1.43% For example, the continuous probability distributions of rates of return on stocks for two PROBABILITY DENSITY 2.73% market. Such conditions will vary from time to time, presented in the form of a continuous probability tompanies are shown on the following graph: Calculate expected returns for the individual stocks in Juan's portfolio as well as the expected rate of return of the entire portfolio over the three possible market conditions next year. • The expected rate of return on Blue Llama Mining's stock over the next year is • The expected rate of return on Hungry Whale Electronics's stock over the next year is • The expected rate of return on Juan's portfolio over the next year is The expected returns for Juan's portfolio were calculated based on three possible conditions in the market. Such conditions will vary from time to time, and for each condition there will be a specific outcome. These probabilities and outcomes can be represented in the form of a continuous probability distribution graph. For example, the continuous probability distributions of rates of return on stocks for two different companies are shown on the following graph: PROBABILITY DENSITY -40 Company A Company B A 0 20 RATE OF RETURN (Percent) -20 40 60 Based on the graph's information, which of the following statements is true? O Company A has a tighter probability distribution. O Company B has a tighter probability distribution. Grado It Nour Savo & Continuo Calculate expected returns for the individual stocks in Juan's portfolio as well as the expected rate of return of the entire portfolio over the three possible market conditions next year. • The expected rate of return on Blue Llama Mining's stock over the next year is • The expected rate of return on Hungry Whale Electronics's stock over the next year is • The expected rate of return on Juan's portfolio over the next year is 2.20% The expected returns for Juan's portfolio were calculated based on three possible conditic 2.49% and for each condition there will be a specific outcome. These probabilities and outcomes distribution graph, 1.43% For example, the continuous probability distributions of rates of return on stocks for two PROBABILITY DENSITY 2.73% market. Such conditions will vary from time to time, presented in the form of a continuous probability tompanies are shown on the following graph:
Expert Answer:
Answer rating: 100% (QA)
Expected return is the weighted average of individual returns Expected return of Blue L... View the full answer

Related Book For 

Business Analytics Communicating With Numbers
ISBN: 9781260785005
1st Edition
Authors: Sanjiv Jaggia, Alison Kelly, Kevin Lertwachara, Leida Chen
Posted Date:
Students also viewed these accounting questions
-
First National Bank has made a 5-year, $100 million fixed-rate loan at 10%. Annual interest payments are $10 million, and all principal will be repaid in year 5. The bank wants to swap the fixed...
-
Remember, the expected value of a probability distribution is a statistical measure of the average (mean) value expected to occur during all possible circumstances. To compute an assets expected...
-
The Price Effects of Vouchers and Recipient Welfare: Using Figure 2 as a starting point (v is the voucher point and j is the public-housing point), suppose the $300 program increases the price of...
-
Write short note on context switch
-
An electromagnetic wave of frequency w = 3.0 MHz passes from vacuum into a non-magnetic medium with permittivity e = 4.0. Find the increment of its wavelength.
-
The polynomial p(2) +7-36 has a known factor of (+3). Rewrite p(ar) as a product of linear factors. p(r)-
-
Define patterns, methodologies, and recipes and give an example for each.
-
Prepare general journal entries to record the effects on the General Long-Term Liabilities accounts of the following transactions. The transactions are independent of one another unless otherwise...
-
Greg Thomas purchased one - half of Ian Hamilton s interest in the Freidman and Hamilton partnership for $ 4 9 , 5 0 0 . Prior to the investment, land was revalued to a market value of $ 1 8 9 , 2 0...
-
Suppose you take out a margin loan for $75,000. You pay a 6.4 percent effective rate. If you repay the loan in two months, how much interest will you pay?
-
Explain the purpose of this function: function myFunction (int x) { if ((x & 1) == 0) { return true; } else { } } return false;
-
This question takes a step back from the quantitative analysis and makes you think about how you would manage a capital budgeting project in a firm. You have just graduated from university and taken...
-
In the accounts of P Toona, an account payable tax invoice for office equipment from G Heath for $8415 ($7650 + $765 GST) was erroneously entered and processed in the purchases journal as $5148...
-
On April 20, 2004, six lanes of the Nicoll Highway in Singapore disappeared into a 100-foot hole when a tunnel being constructed underneath the highway collapsed. Incredibly, no one was driving on...
-
What is the relationship between the one-factor model and the CAPM? In contrast to the CAPM, the APT does not indicate which factors are expected to determine the risk premium of an asset. How can we...
-
Many companies in emerging markets use AAA rated firms in the West to guarantee any debt issue that is made by the firm. A good example is the Bakrie family in Indonesia, who used Bumi plc in the UK...
-
Blue Mountain Manufacturing Company uses job order costing, and developed the following data: Beginning work in process inventory $1,000,000 Direct materials used Actual overhead Overhead applied...
-
In the busy port of Chennai, India, the number of containers loaded onto ships during a 15-week period is as follows: 1. Develop a linear trend equation to forecast container loadings. 2. Using the...
-
Consider the following LP problem. where x 1 and x 2 represents the decision variables. Solve the LP problem to answer the following questions. a. What are the values of x 1 and x 2 at the optimal...
-
Since 1940, the Billboard magazine has published a variety of weekly music popularity charts. Today, the magazine uses a combination of sales volume, airplay on radio, digital downloads, and online...
-
Perform principal component analysis on the accompanying data set. a. Use the data with the covariance matrix to compute the seven principal components. How many principal components do you need to...
-
N = 230, n = 15, k = 200 Compute the mean and standard deviation of the hypergeometric random variable X.
-
N = 60, n = 8, k = 25 Compute the mean and standard deviation of the hypergeometric random variable X.
-
One study showed that in a certain year, airline fatalities occur at the rate of 0.011 deaths per 100 million miles. Find the probability that, during the next 100 million miles of flight, there will...

Study smarter with the SolutionInn App